Trace your first call
Introduction
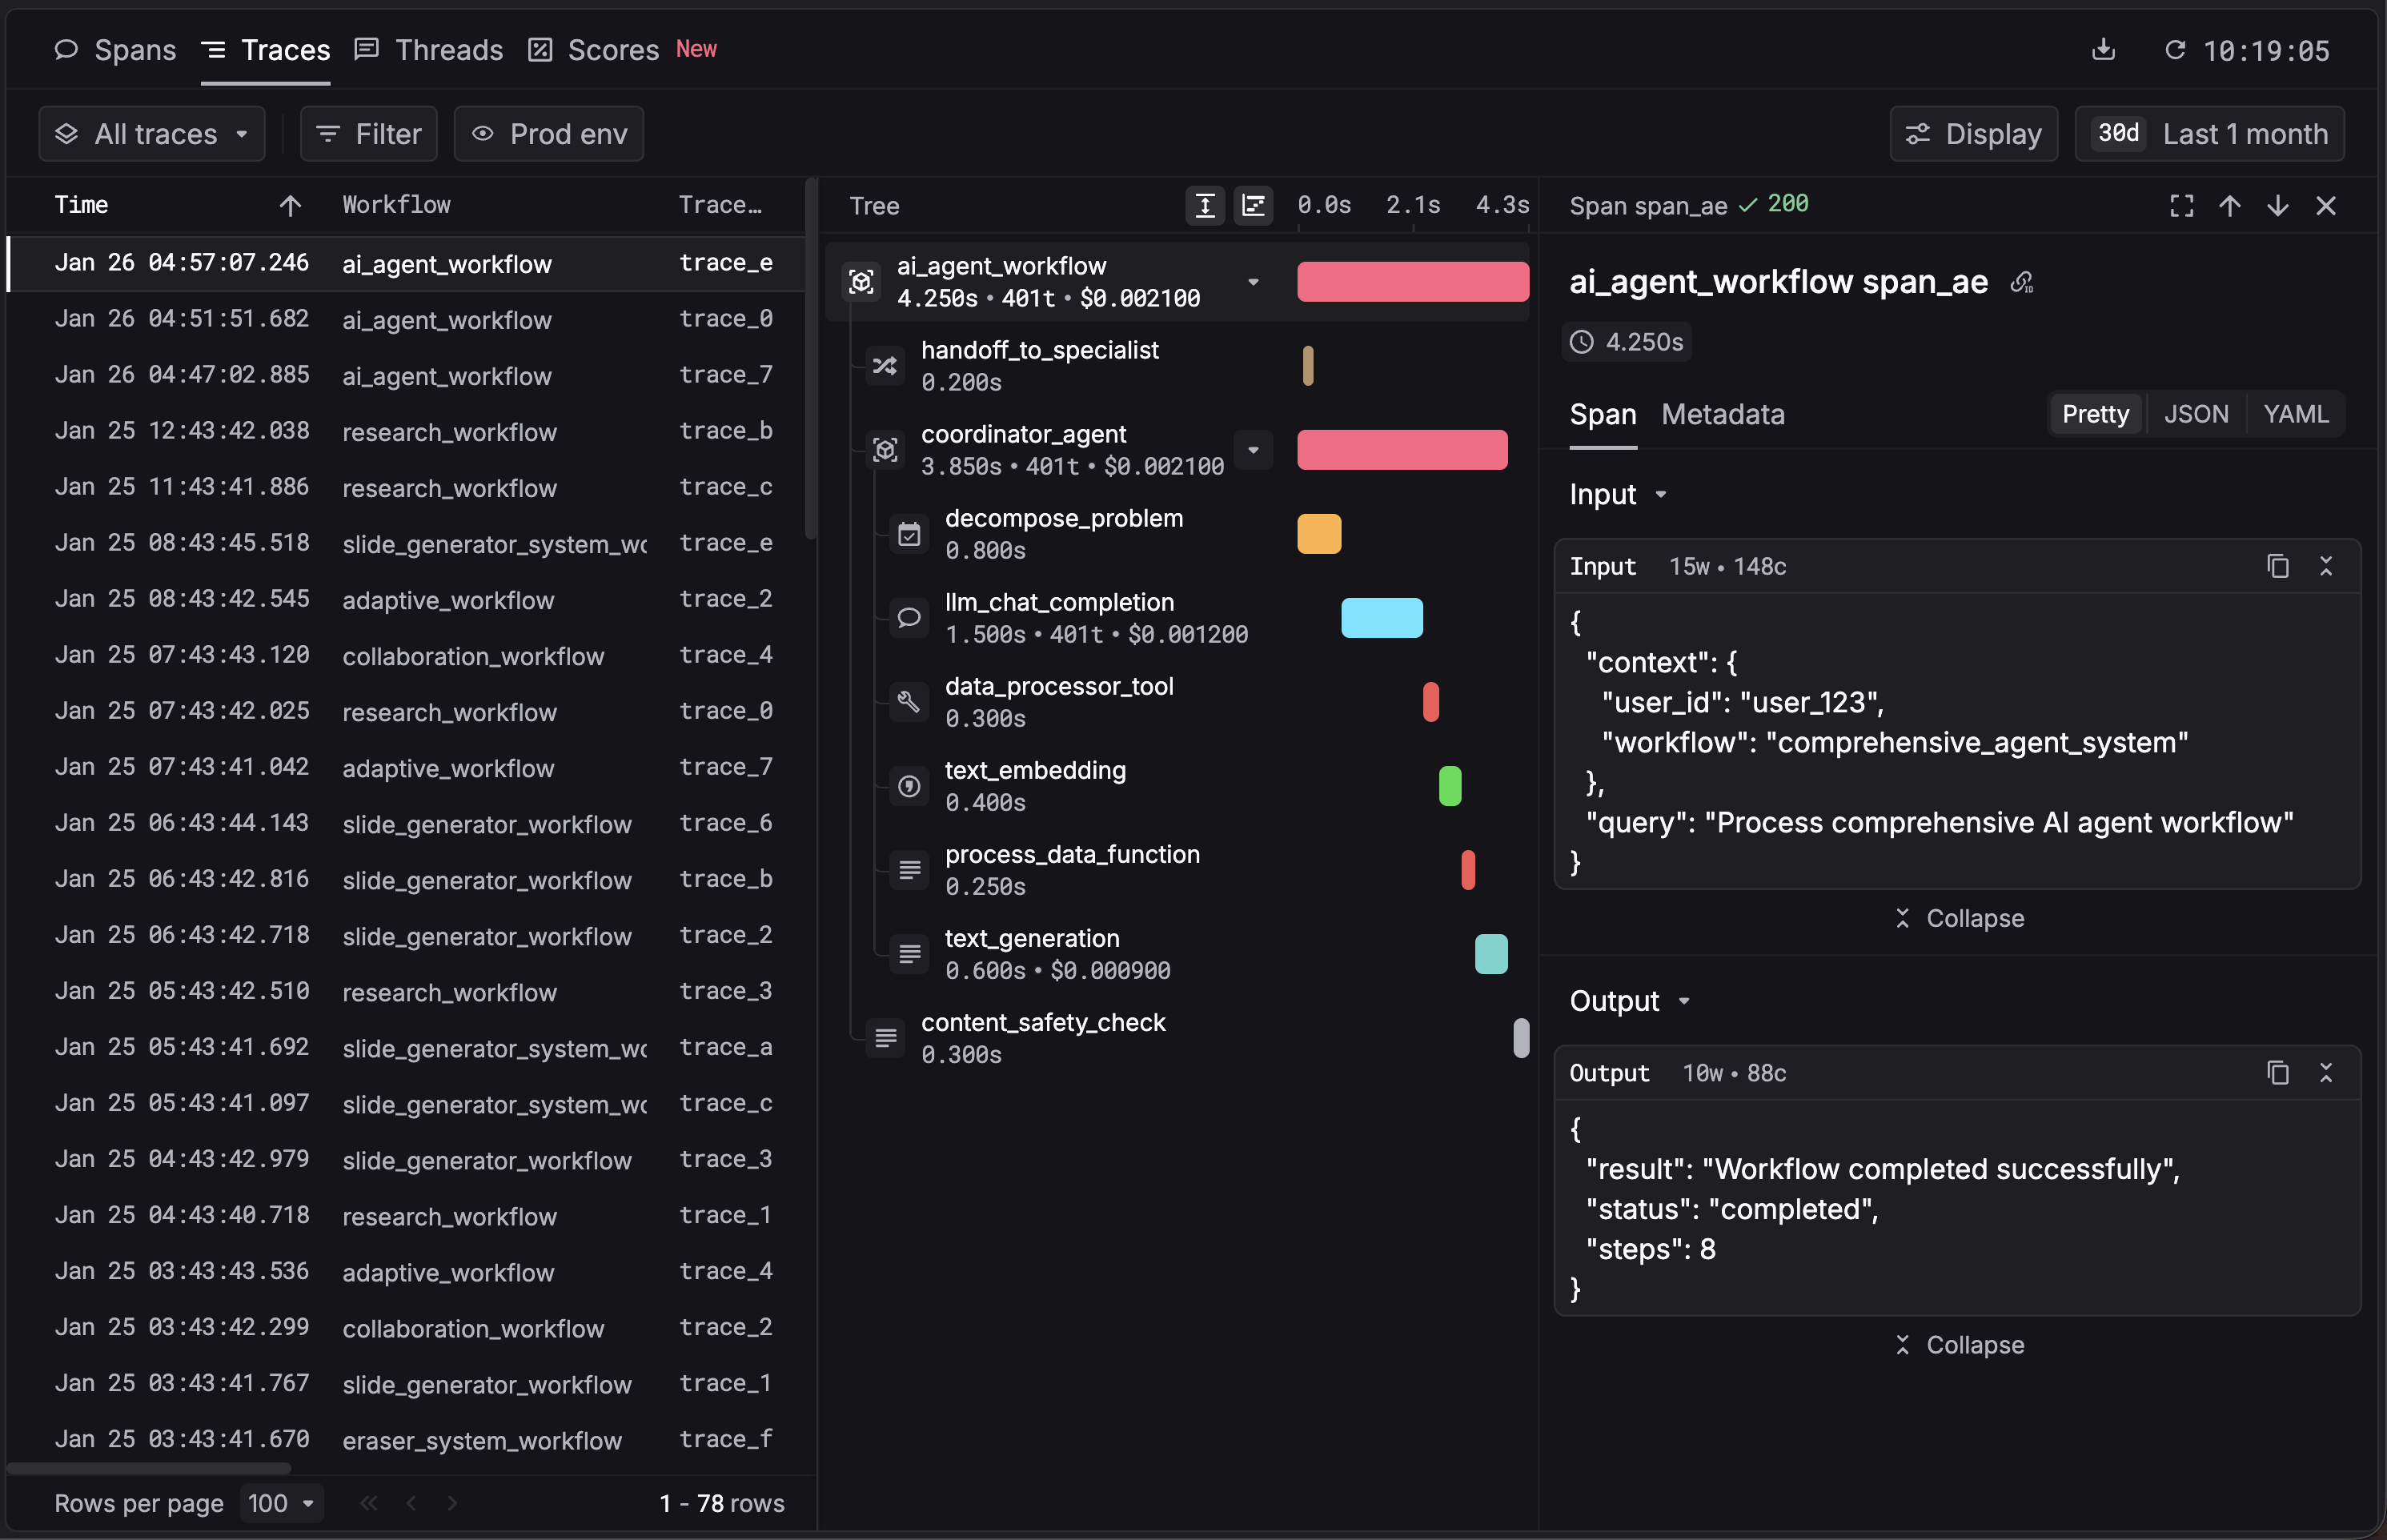
Tracing captures every LLM call, tool execution, and agent step in your application and sends it to the Respan platform. The Respan SDK instruments your code, automatically records inputs, outputs, latency, cost, and token usage, and exports the data as spans. Spans form a tree view of your workflow so you can see exactly how a request flowed through your agents and tools.
1. Set up your account
Sign up at platform.respan.ai and create an API key on the API keys page.
Set your environment variable:
Try it live. Add your API key below, ask the chatbot a question, and watch a trace appear in your dashboard.
2. Choose your integration
Pick the integration that matches your stack, install the packages, and initialize Respan. Agent SDKs like Claude Agent SDK and Vercel AI SDK automatically group all nested LLM calls into a single trace. The OpenAI SDK traces each call independently. To group multiple calls into one trace, wrap them in a @workflow (Python) or withWorkflow() (TypeScript). We will cover decorators in more detail in the Traces section.
OpenAI SDK
Claude Agent SDK
Vercel AI SDK
Respan Native
3. See your first trace
Open the Traces page in the Respan dashboard. You should see your trace appear within a few seconds.
4. Set up the gateway
Route your LLM traffic through Respan’s AI gateway to get automatic logging, fallbacks, retries, load balancing, and caching across 250+ models. Point your SDK at Respan’s base URL and use your Respan API key.
Either add credits or add your LLM provider key so Respan can call models on your behalf.
OpenAI SDK
Claude Agent SDK
Vercel AI SDK
Respan SDK
Change the model parameter to use any supported provider through the same endpoint. See the full Gateway guide for advanced configuration.
What’s next
- Enrich your spans with
customer_identifier,metadata, andthread_identifier. - Run evaluations on your traced data to measure output quality.
- Configure fallbacks and load balancing for production reliability.