TL;DR
LLM observability is the operational discipline of tracing, evaluating, and monitoring large language model interactions in production. It rests on five pillars — tracing, evals, metrics, prompt management, and dataset curation. Traditional APM is not enough because LLM responses can be technically successful yet functionally wrong. The platforms compete on instrumentation model, eval depth, gateway support, and self-host options; comparison table further down.
What is LLM observability?
LLM observability is the practice of capturing every interaction between your application and a large language model — the input prompt, the output completion, intermediate tool calls, retrieval chunks, latency, token usage, cost, and quality scores — and surfacing that information in a way engineers can search, compare, alert on, and learn from.
The term borrows from traditional observability, the discipline introduced by Twitter and Google engineers in the mid-2010s for distributed systems: any sufficiently complex system requires not just logs and metrics, but distributed traces and structured introspection. LLM applications are the most extreme version of that complexity, because they are non-deterministic by design.
A useful working definition: LLM observability is whatever it takes to answer "why did the model produce that output?" at scale, in production, after the fact.
Why LLM observability matters
Every team that ships an LLM feature without observability eventually hits the same five walls:
- Bad outputs have no trail. A user reports a hallucination. You have no record of what they asked, what context was retrieved, what model was called, or what came back. You cannot reproduce, isolate, or fix it.
- Cost runs ahead of revenue. Without per-request cost attribution by model, feature, and user, your monthly LLM bill spikes and you cannot tell which feature, customer, or prompt change is responsible.
- Multi-step agents are black boxes. An agent that makes ten LLM calls plus tool invocations is impossible to debug from logs alone. You need distributed traces with parent/child spans.
- Regressions reach users first. A new prompt or model version subtly degrades quality. Without eval scores tracked over time, you find out when complaints arrive, not before.
- You ship blind. Deciding whether GPT-4o or Claude or a fine-tuned smaller model is better for your task requires quality scores and cost trade-offs side by side. Without evals, you guess.
These problems compound. A team that solves them six months in has already shipped six months of buggy product to users.

Today's observability tools are built around the request-and-response trace, but agents make ten LLM calls and twenty tool calls for one user action — and the bottleneck is no longer the model, it's the orchestration. The next two years will sort observability platforms into two camps: those that treat the agent run as the unit and the model call as a span, and those that don't and fall behind. We bet on the first.
The eval consequence is that LLM-as-judge alone stops being enough. It became the default eval method because it's cheap and feels rigorous — but it inherits every bias of the judge model, and most teams never sample-validate it against humans. Use it for breadth at the trace level, sure. But anchor it with weekly human review of edge cases and a gold-set you don't let drift. Without that anchor, you're not measuring quality; you're measuring whether two LLMs happen to agree.
Teams shipping LLM products in production with Respan
The five pillars of LLM observability
The pillars are not a checklist — they're a loop. Production traces feed datasets, datasets feed evals, evals catch regressions in prompt changes, prompt changes ship to production and produce new traces. The teams that close this loop turn observability into compounding leverage; the teams that don't end up with five disconnected tools and the same bugs every quarter.
The observability loop. Every pillar is on a feedback edge — removing one breaks the cycle.
1. Tracing
A trace captures one logical operation end-to-end: the user query, the retrieval step, the LLM call, any tool invocations, and the final response. Each step is a span with timing, inputs, outputs, and attributes. Multi-step agent pipelines are impossible to debug without this.
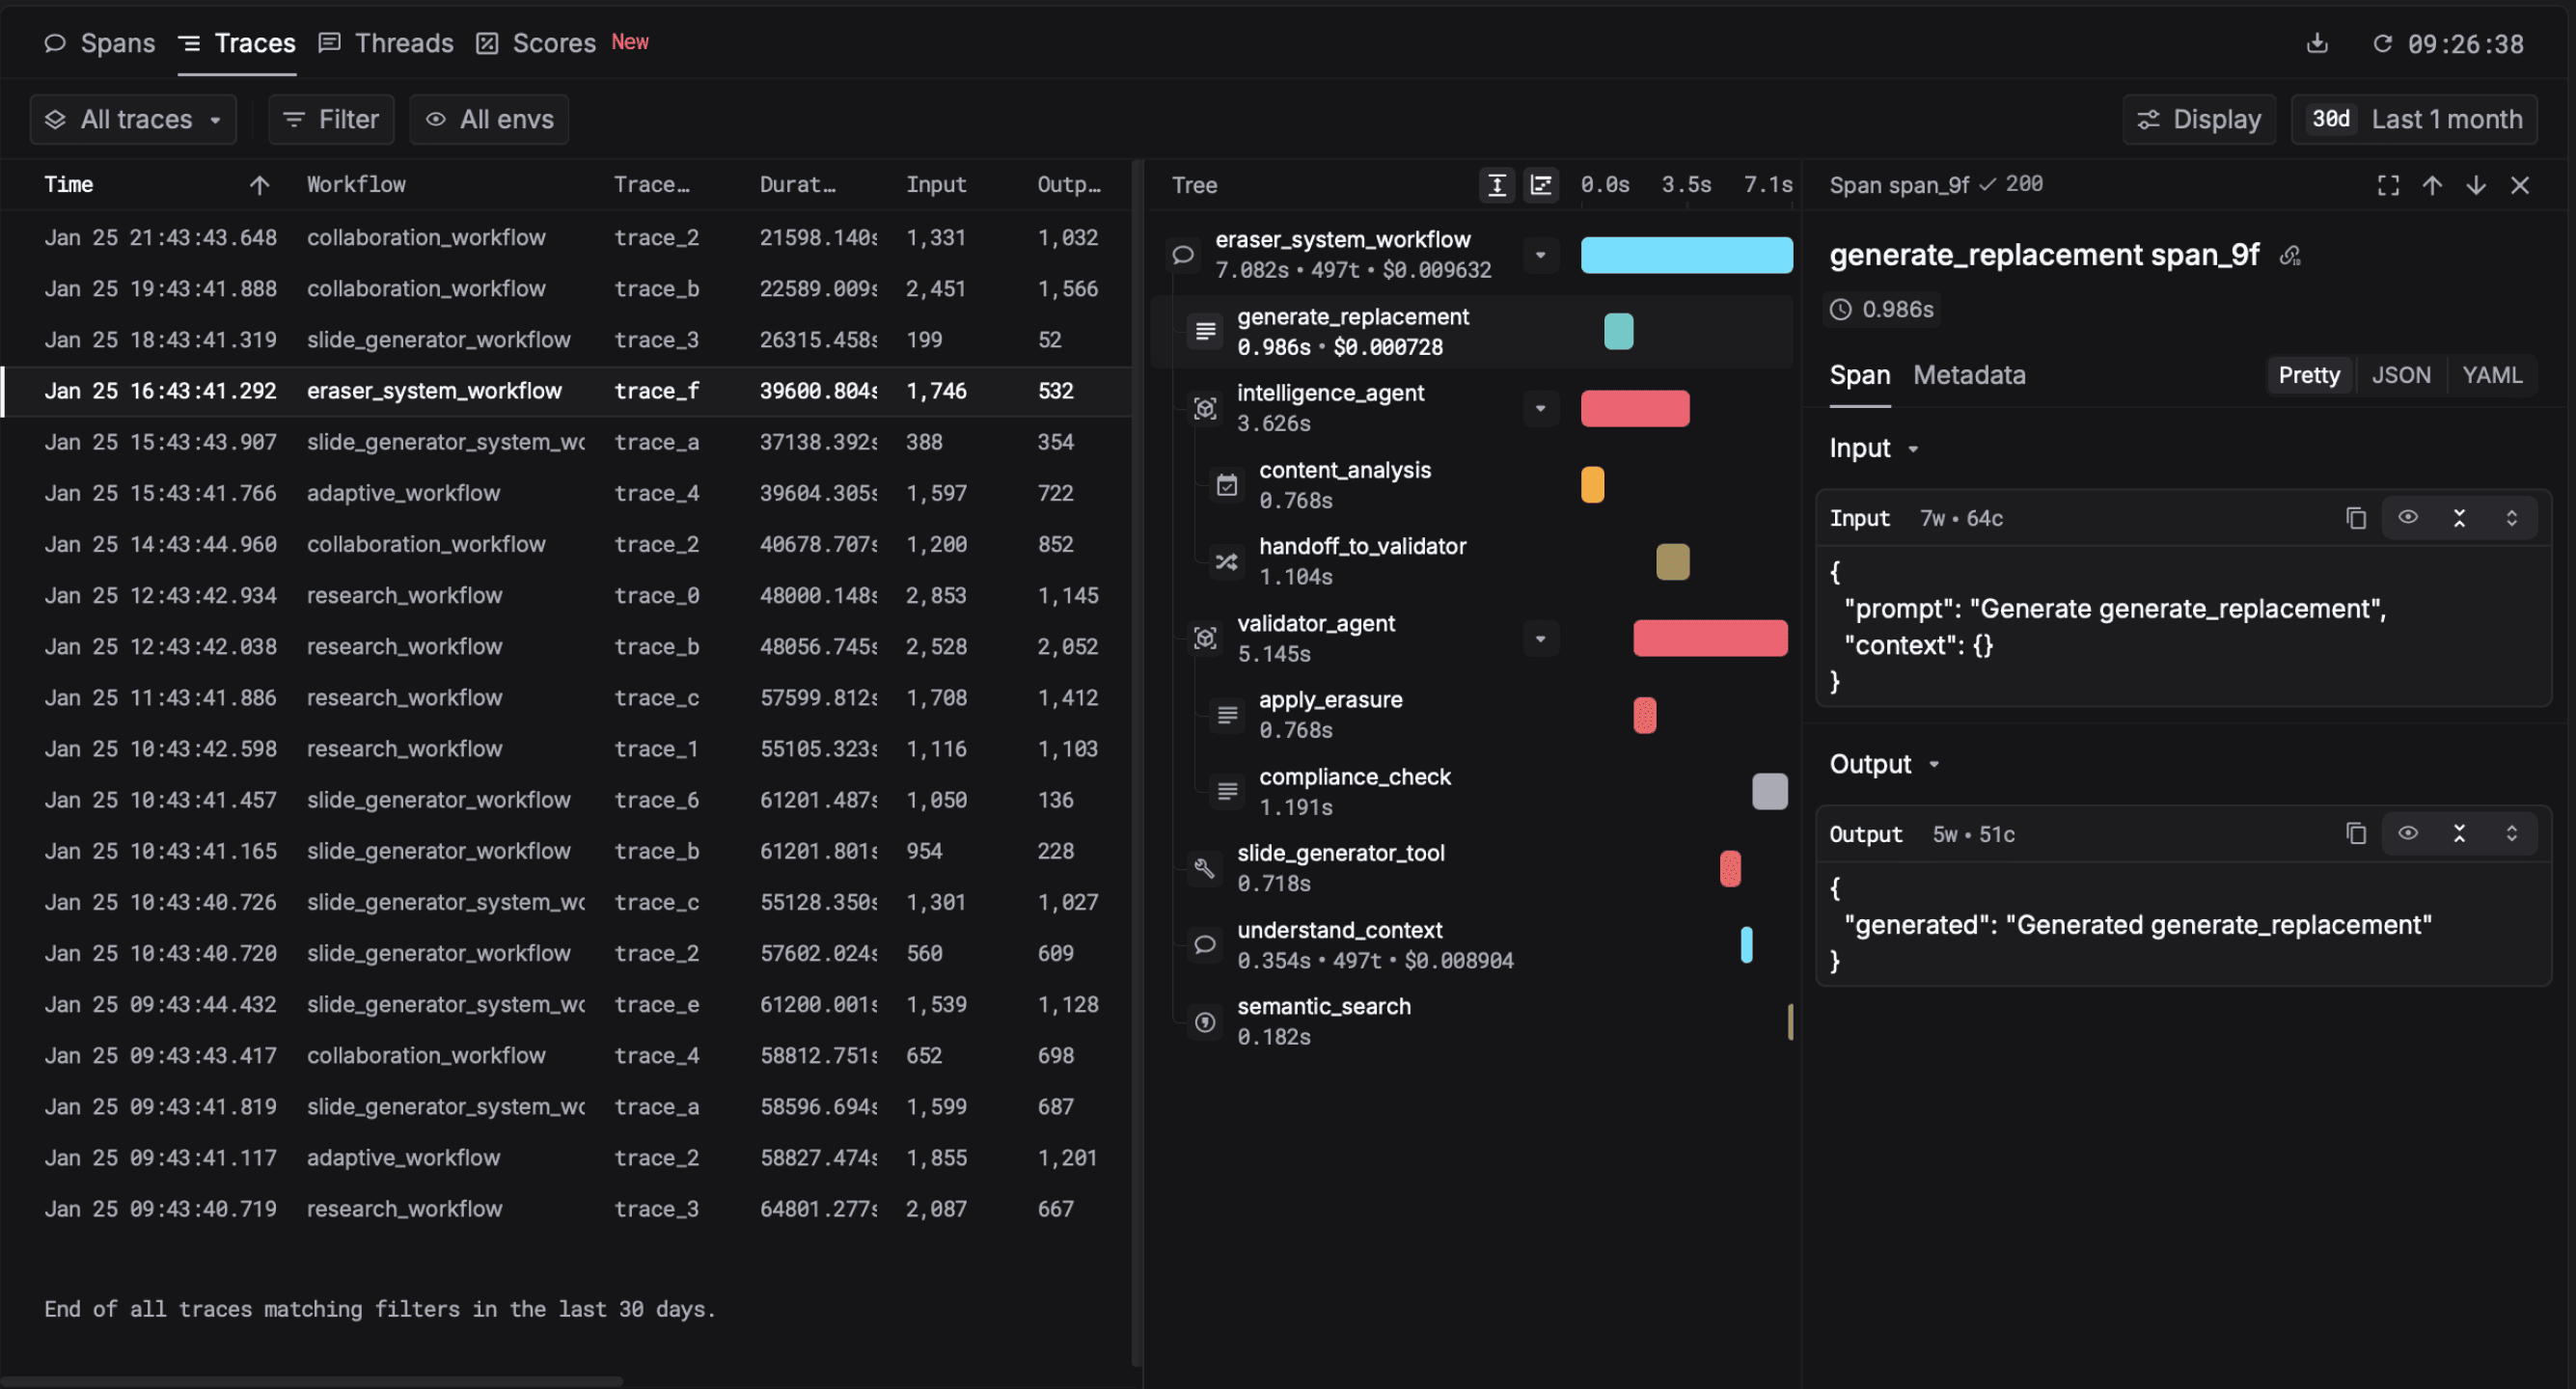
A real trace from Respan: one user request that fanned out into a retrieval span, two LLM calls, and three tool invocations, with latency and cost on each.
Modern LLM tracing is built on OpenTelemetry's GenAI semantic conventions, so traces are portable across vendors. The spec is mature enough that any new platform should be OTel-compatible from day one. Read more about how Respan handles tracing.
2. Evals
Evaluations score the quality of outputs against criteria you define. Three flavors that matter:
- Rule-based: deterministic checks like JSON validity, regex match, length bounds, profanity filters. Cheap and fast.
- LLM-as-a-judge: a separate LLM scores outputs against a rubric. Strong correlation with human judgment for criteria where reasonable people agree (see the founder's take above for caveats).
- Human review: sampled or full review by domain experts. Slow and expensive but the ground truth for high-stakes applications.

Eval scores attached to a single trace. Online evals run on every production request; offline evals run against a frozen test set.
The best teams run all three flavors and treat eval scores as a first-class metric — chartable, alertable, sliceable by feature and model. See Respan's evals for the implementation.
3. Metrics
Aggregate numbers across requests: TTFT, P50/P95/P99 generation time, tokens per request, cost per user, error rate by model, eval score over time. These are the dashboards and alerts. Critically, they need to be sliceable by feature, model, prompt version, and user — not just time.
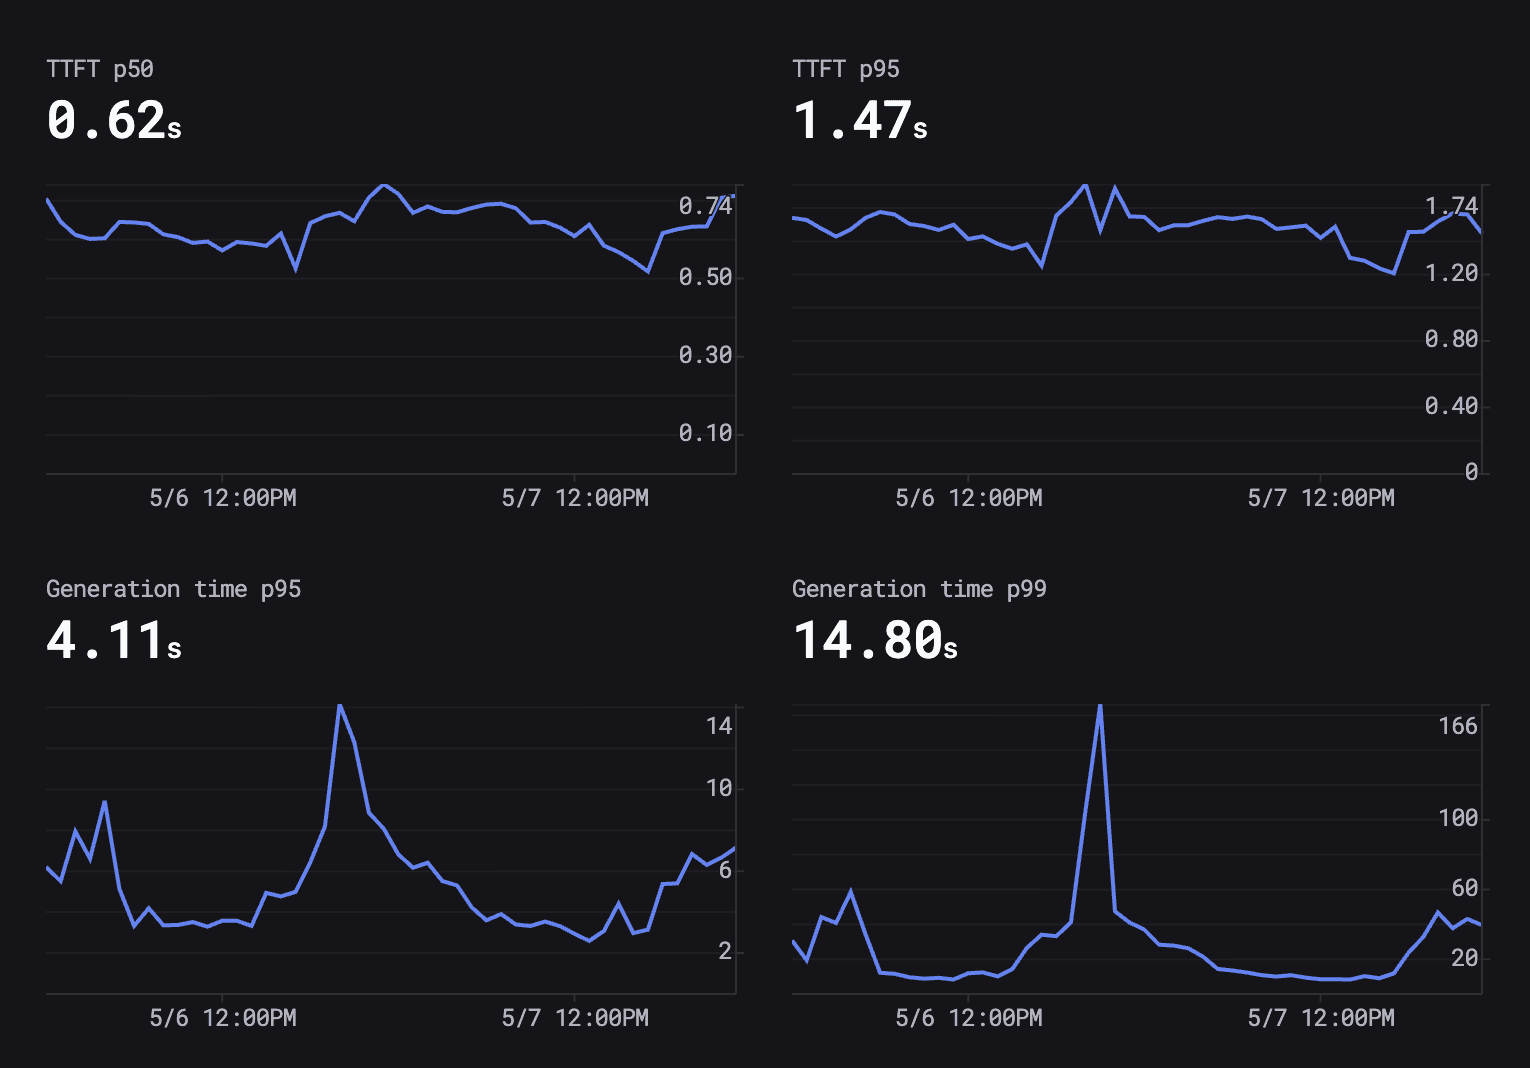
Two days of latency from one Respan customer. Note the P99 spike to ~166 seconds while P95 stayed at 4 seconds.
Read this dashboard carefully — it's the most-instructive single image on this page. TTFT (time to first token) is steady at 0.62s P50 and 1.47s P95, which is what users feel for a streaming UX. Generation P95 is 4.11s — fine. Generation P99 is 14.80s on average but spiked to 166s mid-day. That spike is invisible in traditional APM. The user who hit it experienced a 30-second hang. Multiply by a few hundred similar users a day and you have an unattributed retention problem.
The lesson: your P99 is the customer experience you don't measure. Plot the gap between P95 and P99 explicitly, alert on it widening, and resist the temptation to call P95 "good enough."
4. Prompt management
Prompts are code. They need versions, diffs, rollback, A/B testing, and deployment without redeploying the application. A change to a system prompt is as risky as a database migration — sometimes riskier — and deserves the same lifecycle.

The teams that get this right ship prompt changes daily without anxiety. The teams that don't either move slowly or break things quietly.
5. Dataset curation
Production traces are gold. The most interesting failures, edge cases, and high-quality examples should flow into evaluation datasets and fine-tuning corpora. Observability platforms that close this loop — production → dataset → eval → improved prompt → back to production — turn into compounding advantages over time.
This is the pillar most teams skip and most regret skipping. The value compounds: every month of curated data makes every future change measurably safer.
LLM observability vs traditional APM
Generic Application Performance Monitoring tools (Datadog, New Relic, Honeycomb, plus their LLM modules) capture HTTP-level spans well. They tell you the LLM call took 1.4 seconds and returned a 200. They do not tell you whether the answer was correct, whether the right context was retrieved, or whether your prompt change three days ago is now silently hallucinating 8% of the time.
Three things APM is structurally missing for LLM workloads:
- Input/output capture as first-class data. APM redacts payload bodies for privacy. LLM observability requires the full prompt and completion to debug anything.
- Quality evaluation. APM has no notion of an answer being wrong. You need evaluators built in.
- Prompt and model versioning. APM tracks code deploys. It does not track prompt versions, system messages, model swaps, or temperature changes — all of which can degrade quality without changing latency or status code.
Datadog's LLM module and similar bolt-ons help, but they don't close the structural gap. The right architecture for most teams: instrument with an LLM-native platform like Respan, and forward OTel traces to your existing APM as a secondary destination. Best of both.
How to implement LLM observability
Step 1: Instrument with the SDK
Wrap your LLM client. With Respan it is two lines:
from respan import Respan
from openai import OpenAI

respan = Respan(api_key="...")
client = respan.wrap(OpenAI())

# Every call is now traced, scored, and cost-attributed
client.chat.completions.create(
    model="gpt-4o",
    messages=[{"role": "user", "content": "..."}],
    metadata={"user_id": "u_123", "feature": "support_agent"},
)
For OpenTelemetry-native stacks, point your OTel exporter at Respan's endpoint — no code changes. We support the full GenAI semantic conventions.
Step 2: Define evaluators
Start with three to five criteria that match your product. For a customer support agent: faithfulness to retrieved docs, empathy tone, format compliance, escalation accuracy, response length. Don't try to measure ten things at once — pick the three that map to user complaints.
Step 3: Wire alerts
Page on the metrics that matter: TTFT P95 above your threshold, cost per user spiking, eval score on any criterion dropping more than 5 percentage points week-over-week, P99 generation time doubling. Do not page on raw error rate alone — most LLM regressions look fine to APM.
Step 4: Close the loop
Promote interesting traces into datasets. Use those datasets to regression-test future prompt and model changes. This is the difference between a one-time setup and a compounding system.
Common mistakes (so you can skip them)
- Sampling traces in production. Tempting for cost, but the rare failure modes are the ones you most need to capture. Sample after you've decided what to drop, not before. At Respan we capture 100% of traces by default precisely because the long tail is where the value is.
- Treating LLM-as-judge as ground truth. See the founder's take. Anchor with humans or you're just measuring consensus between two LLMs.
- Charting only request-level latency. For agents, the unit of analysis is the agent run, not the LLM call. P95 of one LLM call doesn't tell you the agent's user experience.
- Versioning code without versioning prompts. You can roll back code in a minute. Most teams take days to roll back a prompt change. Fix the asymmetry.
- One eval criterion to rule them all. A single "quality" score hides everything. Decompose into 3-5 orthogonal criteria and chart each.
- No alert on cost. A prompt accidentally switched from gpt-4o-mini to gpt-4o tripled spend overnight, and the team noticed at month-end. Alert per-feature cost-per-active-user, not just total spend.
LLM observability tools compared
Six platforms cover most of the market. The matrix below is our best read of each as of May 2026 — corrections via hello@respan.ai very welcome.
| Tool | Instrumentation | Tracing | Online evals | LLM-as-judge | Self-host | Prompt versioning | Gateway | Free tier | OTel-native |
|---|---|---|---|---|---|---|---|---|---|
| Respan | SDK + OTel + Proxy | Yes | Yes | Yes | Yes (Enterprise) | Yes | Built-in (500+ models) | Yes | Yes |
| Langfuse | SDK + OTel | Yes | Yes | Yes | Yes (OSS) | Yes | No | Yes | Partial |
| LangSmith | SDK (LangChain) | Yes | Yes | Yes | Enterprise only | Partial | No | Yes | Partial |
| Helicone | Proxy | Partial | Partial | Partial | Yes (OSS) | No | Proxy gateway | Yes | No |
| Braintrust | SDK + OTel | Yes | Yes | Yes | Enterprise only | Yes | AI proxy | Yes | Yes |
| Datadog LLM | SDK + OTel | Yes | Partial | No | No | No | No | Trial only | No |
Read the long-form comparisons: Langfuse alternatives, LangSmith alternatives, Helicone alternatives, Braintrust alternatives.
Beyond observability: gateway, evals, prompt ops
Observability is the foundation. Three adjacent disciplines build on top of it:
- LLM gateway — a unified proxy across providers with fallback, caching, and budget controls. Lets you swap models without changing application code.
- LLM evals — offline and online evaluation pipelines that turn quality from a feeling into a number you can ship against.
- Prompt management and optimization — versioned prompts, automated experiments, and rollback without redeploys.
A complete LLM engineering platform unifies all four. See how Respan does it or read the docs at respan.ai/docs.
Frequently asked questions

Head of DevRel at Respan (YC W24). Working alongside the team running the infrastructure that handles 80M+ LLM requests a day.
Connect on LinkedIn →Add observability to your LLM app in two lines
Free tier with generous limits. SDK, OTel, and gateway support out of the box. No credit card required.