TL;DR
LLM tracing is the foundation of agent observability — capturing every LLM call, tool invocation, and intermediate step as a hierarchical span tree. Use OpenTelemetry GenAI semantic conventions by default, capture 100% of traces (don't sample early), and treat the trace (not the LLM call) as the unit of analysis. The teams that get this right debug agent regressions in minutes; teams that don't take days.
What is LLM tracing?
An LLM trace captures one logical operation end-to-end as a tree of spans. The root span is the user request. Each step — retrieval, LLM call, tool invocation, agent decision, sub-agent call — becomes a child span with timing, inputs, outputs, attributes, and a parent reference. The result is a structured object that lets you reconstruct exactly what happened, in what order, and with what cost.
One support agent run, six spans. The tool calls are children of the LLM call that requested them. Without this hierarchy, you get six separate log lines and no way to know they belong to the same user action.
For a single-call LLM endpoint (chatbot reply, completion API), tracing looks a lot like enriched logging. The discipline becomes essential the moment you're running multi-step agents: an agent that makes ten LLM calls and twenty tool calls per user action is impossible to debug from logs. The agent runs we see typically touch a handful of spans on the median path; the long tail of complex agent runs reaches into the dozens.
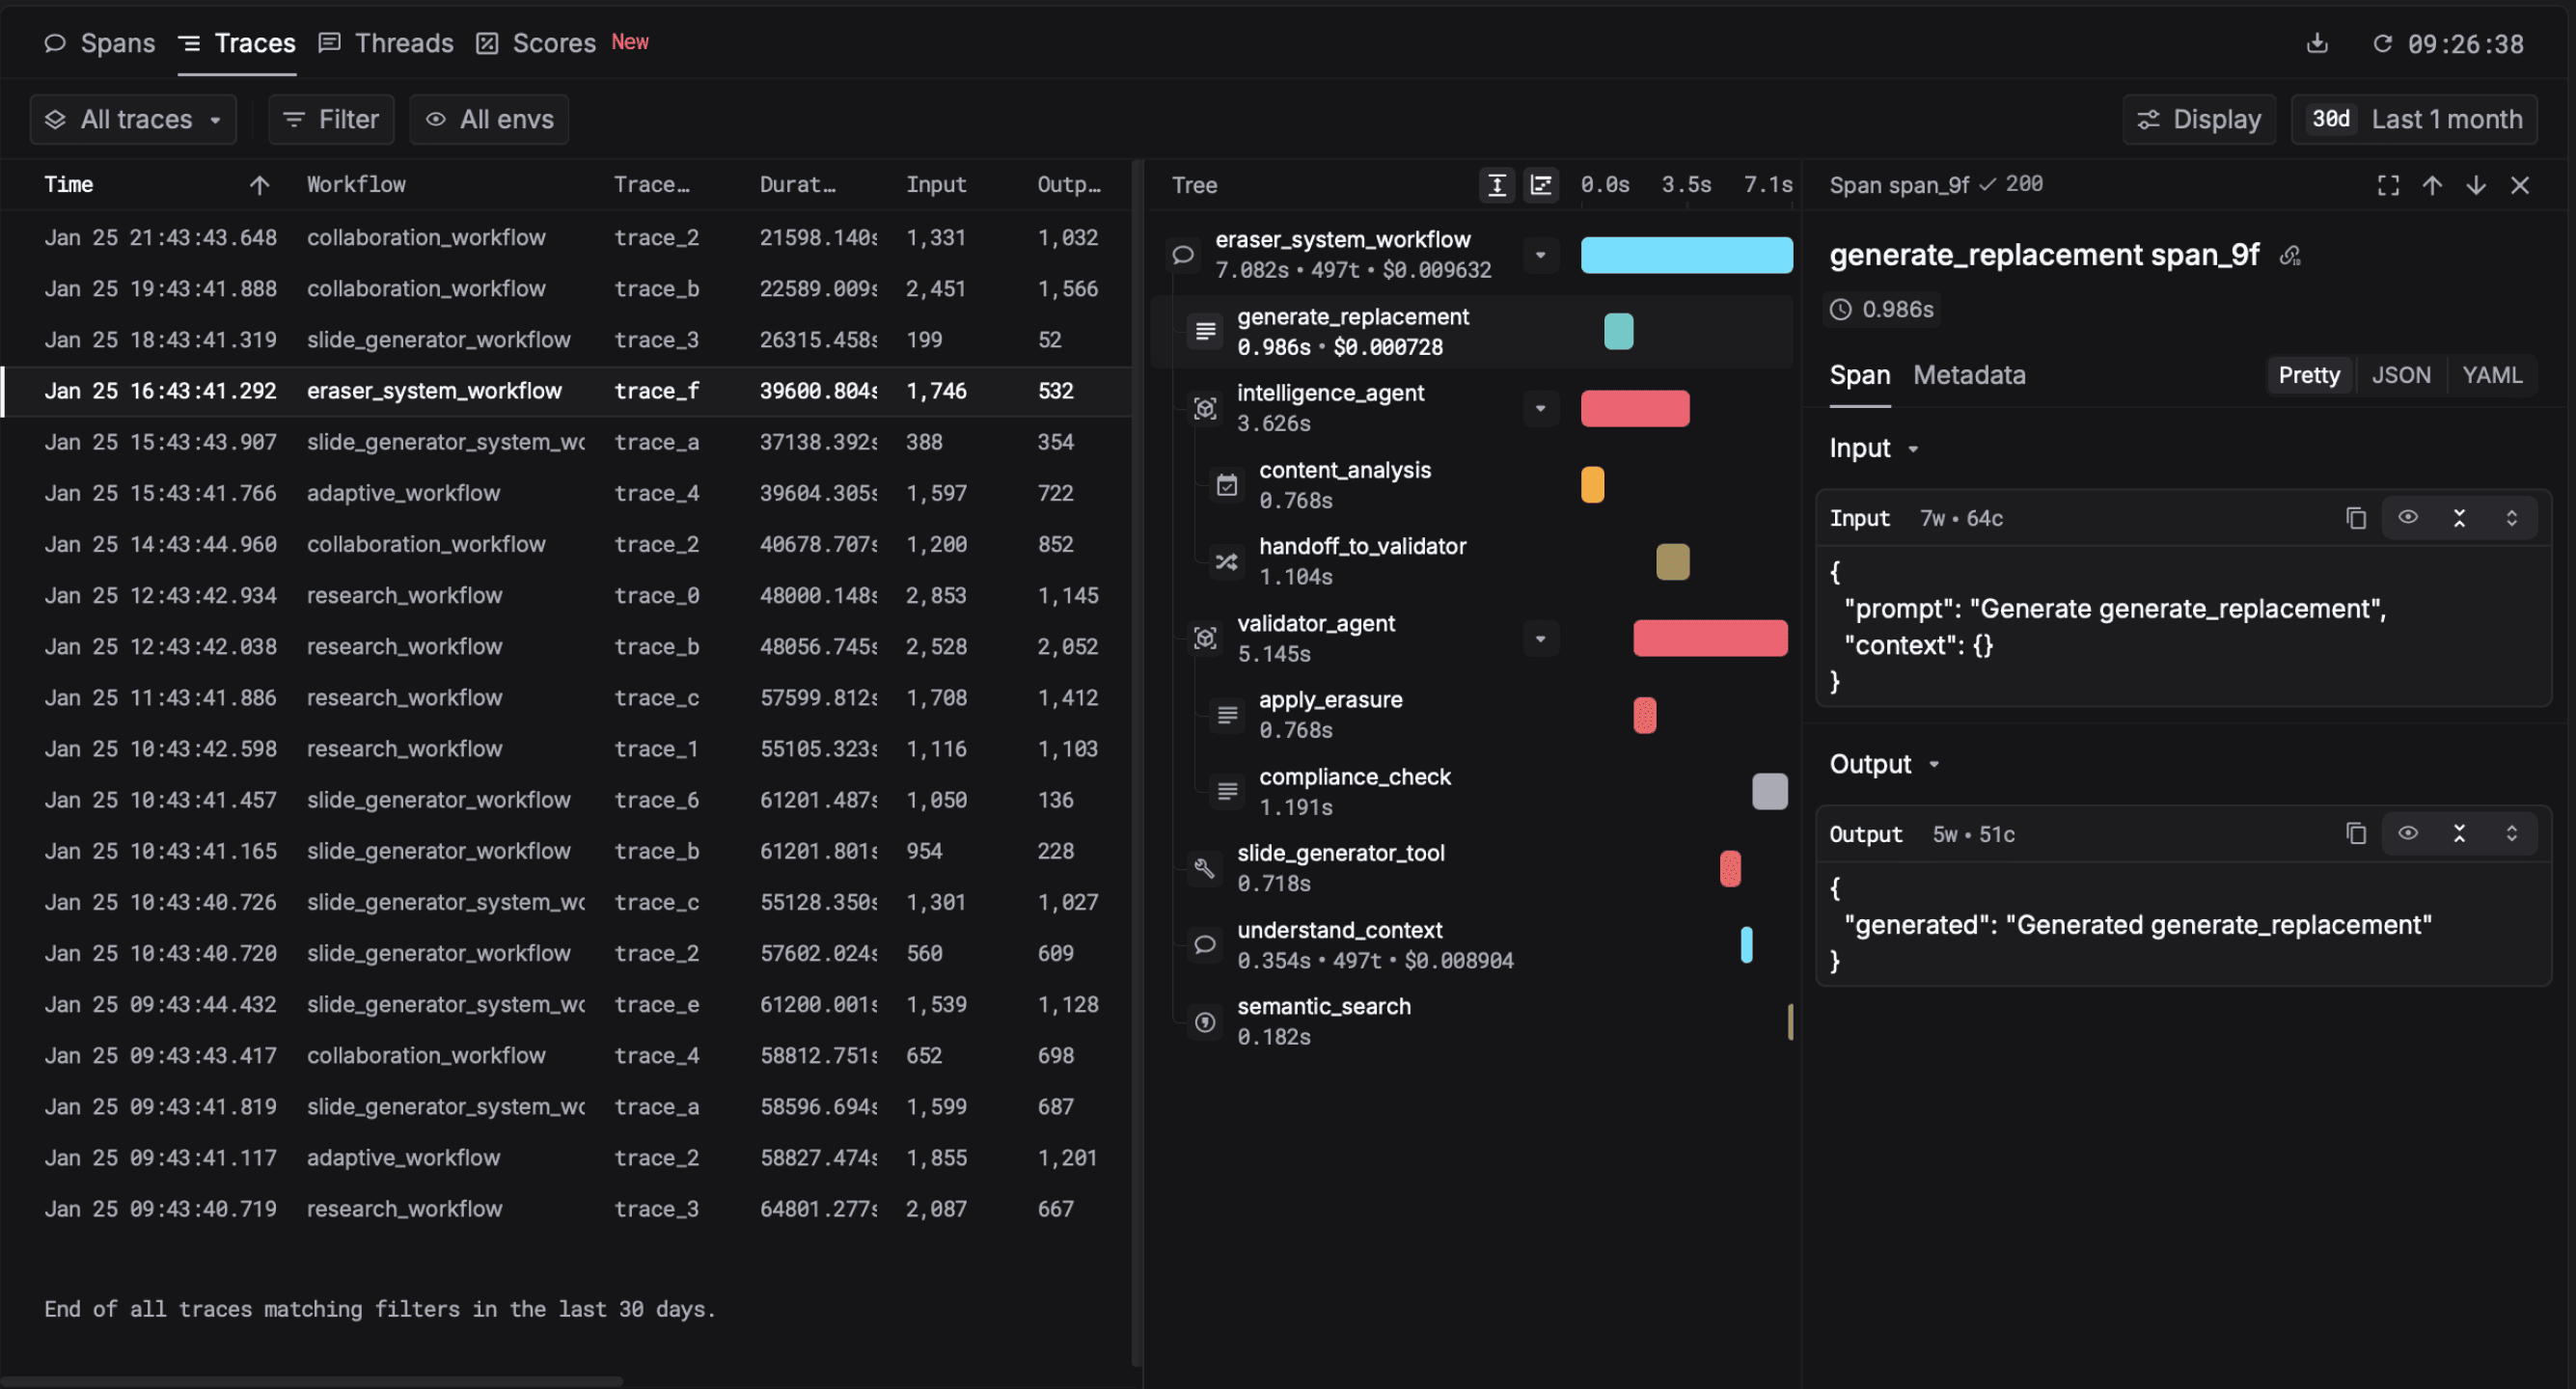
A real trace from Respan: one user request fanned into a retrieval span, two LLM calls, and three tool invocations.
Why tracing is the foundation
Of the five pillars of LLM observability, tracing is the one the others rest on. Evals score traces. Metrics aggregate over traces. Prompt management uses trace data to A/B test. Dataset curation harvests traces. Without tracing, the rest is impossible.
Three concrete consequences of skipping tracing:
- Agent regressions take days to bisect. A user reports a bad output. Without a trace, you have no record of what tools were called, in what order, with what arguments, or what the intermediate LLM decisions were. You're reverse-engineering from log lines.
- Per-feature cost attribution is impossible. If you only have flat LLM call logs, you can total your bill by model — but not by feature, customer, or agent flow. You spend without knowing where.
- Quality regressions surface in support tickets. Without traces tied to eval scores, a degraded prompt slips through staging and shows up as customer complaints, not a chart.

Sampling LLM traces in production is the single most common mistake I see. Teams default to 1% or 10% to "save cost," and then six months later they hit a customer-reported hallucination they can't reproduce because the relevant trace was sampled out. The rare failure modes are precisely what you need to capture — they're long-tail by definition.
Capture 100% from day one. Storage is cheaper than missed bugs, and a trace is one row in a columnar store, not a megabyte. If you can't afford to capture every trace, you probably can't afford to ship the agent.
Teams using Respan tracing in production
Anatomy of an LLM span
The OpenTelemetry GenAI semantic conventions define a stable schema for LLM spans. Every conformant tracing platform should produce these attributes:
gen_ai.system— provider name (openai, anthropic, etc.)gen_ai.request.model— the model called (gpt-4o, claude-3-5-sonnet)gen_ai.request.temperature,gen_ai.request.max_tokens, etc.gen_ai.usage.input_tokens,gen_ai.usage.output_tokensgen_ai.response.finish_reasonsgen_ai.response.id— provider's response ID for cross-referencing
On top of the standard, add a custom set:
prompt.template_id+prompt.version— which prompt was usedeval.scoreper evaluator — quality scores attached after the factuser.id+feature.id— for slicing metrics by user and featurecost.usd— pre-computed cost so dashboards don't recompute
The custom set is what turns a trace from a debugging artifact into an analytics primitive. It's also what most teams forget to add in v1.
Should you sample?
Default answer: no. Capture 100% of traces in production. The objections to this default are usually wrong:
- "It's too expensive." A trace is hundreds of bytes to a few kilobytes in columnar storage. At Respan scale (80M requests/day), full-fidelity capture costs cents per million traces. The model bill is 1000× larger.
- "We have too much volume." Volume is what you instrument for. The whole point of observability is finding signal in volume.
- "We only care about errors." Most LLM failures are HTTP 200 — the response is technically successful but functionally wrong. You can't filter on HTTP status to find them.
When sampling is genuinely required (regulatory, vendor cost limits), prefer tail-based sampling: capture all errors, all slow traces, all traces that hit eval thresholds, plus a random sample of the rest. Never head-sample on input alone.
How to instrument
Path 1: SDK (fastest)
from respan import Respan
from openai import OpenAI

respan = Respan(api_key="...")
client = respan.wrap(OpenAI())

# Every call is now a span with full GenAI attributes
client.chat.completions.create(
    model="gpt-4o",
    messages=[{"role": "user", "content": "..."}],
    metadata={
        "user_id": "u_123",
        "feature": "support_agent",
        "prompt_template_id": "support.v3",
    },
)
Path 2: OpenTelemetry-native
If you're already on OTel, point your existing exporter at Respan's OTLP endpoint. No code changes, full GenAI conventions support.
# Standard OTel SDK config — Respan accepts OTLP
OTEL_EXPORTER_OTLP_ENDPOINT=https://api.respan.ai/v1/otlp
OTEL_EXPORTER_OTLP_HEADERS=authorization=Bearer${RESPAN_API_KEY}
Wrapping agent and tool spans
For multi-step agents, manually wrap each step so the trace tree mirrors your logical operation:
with respan.span("support_agent.run") as run:
    run.set_attributes({"feature.id": "support", "ticket.id": ticket.id})

    with respan.span("retrieve") as retrieval:
        chunks = vector_db.search(ticket.text)
        retrieval.set_attribute("retrieved.count", len(chunks))

    with respan.span("draft_reply"):
        reply = client.chat.completions.create(...)

    with respan.span("send_email"):
        email_service.send(reply)
The trace now has four spans under support_agent.run and you can debug each step independently.
A real debugging story
One Respan customer shipped a prompt tweak on a Friday. Their support agent had been running smoothly — TTFT under 1.5s, eval scores stable. By Monday morning, one customer (out of thousands) reported that replies had gone "robotic and confused." Their PagerDuty was silent. Their Datadog dashboard was green. Cost looked fine.
They opened the trace for the complaining customer's last interaction. The trace tree showed something the dashboards couldn't: a tool call that had previously been a leaf was now being followed by a second LLM call to "interpret" the tool result, and the interpretation was sometimes hallucinating. The new prompt had subtly encouraged tool-result reflection that the agent didn't need.
Without traces, this would have been three days of bisecting prompts. With traces, it was 8 minutes. The fix was a one-line revert. The lesson is the lesson of the whole pillar: aggregate metrics tell you something is wrong; traces tell you what.
Common tracing mistakes
- Sampling early to "save cost." See above. Don't.
- Forgetting to instrument tools. Half the trace is missing if tool calls aren't spans. Tools fail more than LLMs do.
- Trace IDs not propagated across services. If your retrieval service runs in a different process, you need to pass the trace context (W3C traceparent) so spans connect. Otherwise you have two disconnected traces.
- Capturing PII without thinking. Decide upfront what to redact: emails, names, account numbers. Most platforms (including Respan) support redaction at ingest.
- One trace per LLM call. If the user-facing operation is "draft a reply," that's the trace. The two LLM calls inside are spans. Conflating them flattens the tree.
Tracing tools compared
Most LLM observability platforms include tracing as core. The differentiators: instrumentation model (SDK vs OTel vs proxy), depth of GenAI semantic conventions support, and whether tracing is paired with evals + prompt management. Full feature comparison on the LLM observability pillar.
- Respan: SDK + OTel + Proxy. 100% capture default. GenAI conventions native. Paired with evals, gateway, prompt mgmt in one platform.
- Langfuse: SDK + OTel. Open source. Strong tracing UI. No gateway.
- LangSmith: SDK-first, LangChain-native. Less general OTel support.
- Helicone: Proxy-based. Easiest one-line install. Less depth on agent tracing.
- Braintrust: Eval-first product, tracing is solid but secondary.
- Datadog LLM: Bolted onto APM. Good if you already use Datadog.
Frequently asked questions

Head of DevRel at Respan (YC W24). Working alongside the team running the infrastructure that handles 80M+ LLM requests a day.
Connect on LinkedIn →Add tracing to your LLM app in two lines
100% trace capture by default. SDK or OTel. Pairs with evals, gateway, and prompt management.
Related guides: LLM observability · Tracing in Respan · 5 pillars of LLM observability