AI Tracing for
Production Agents
Capture agent and LLM spans with the Respan SDK or OTLP. Debug waterfalls, roll up cost by feature, and score evals on the trace tree.
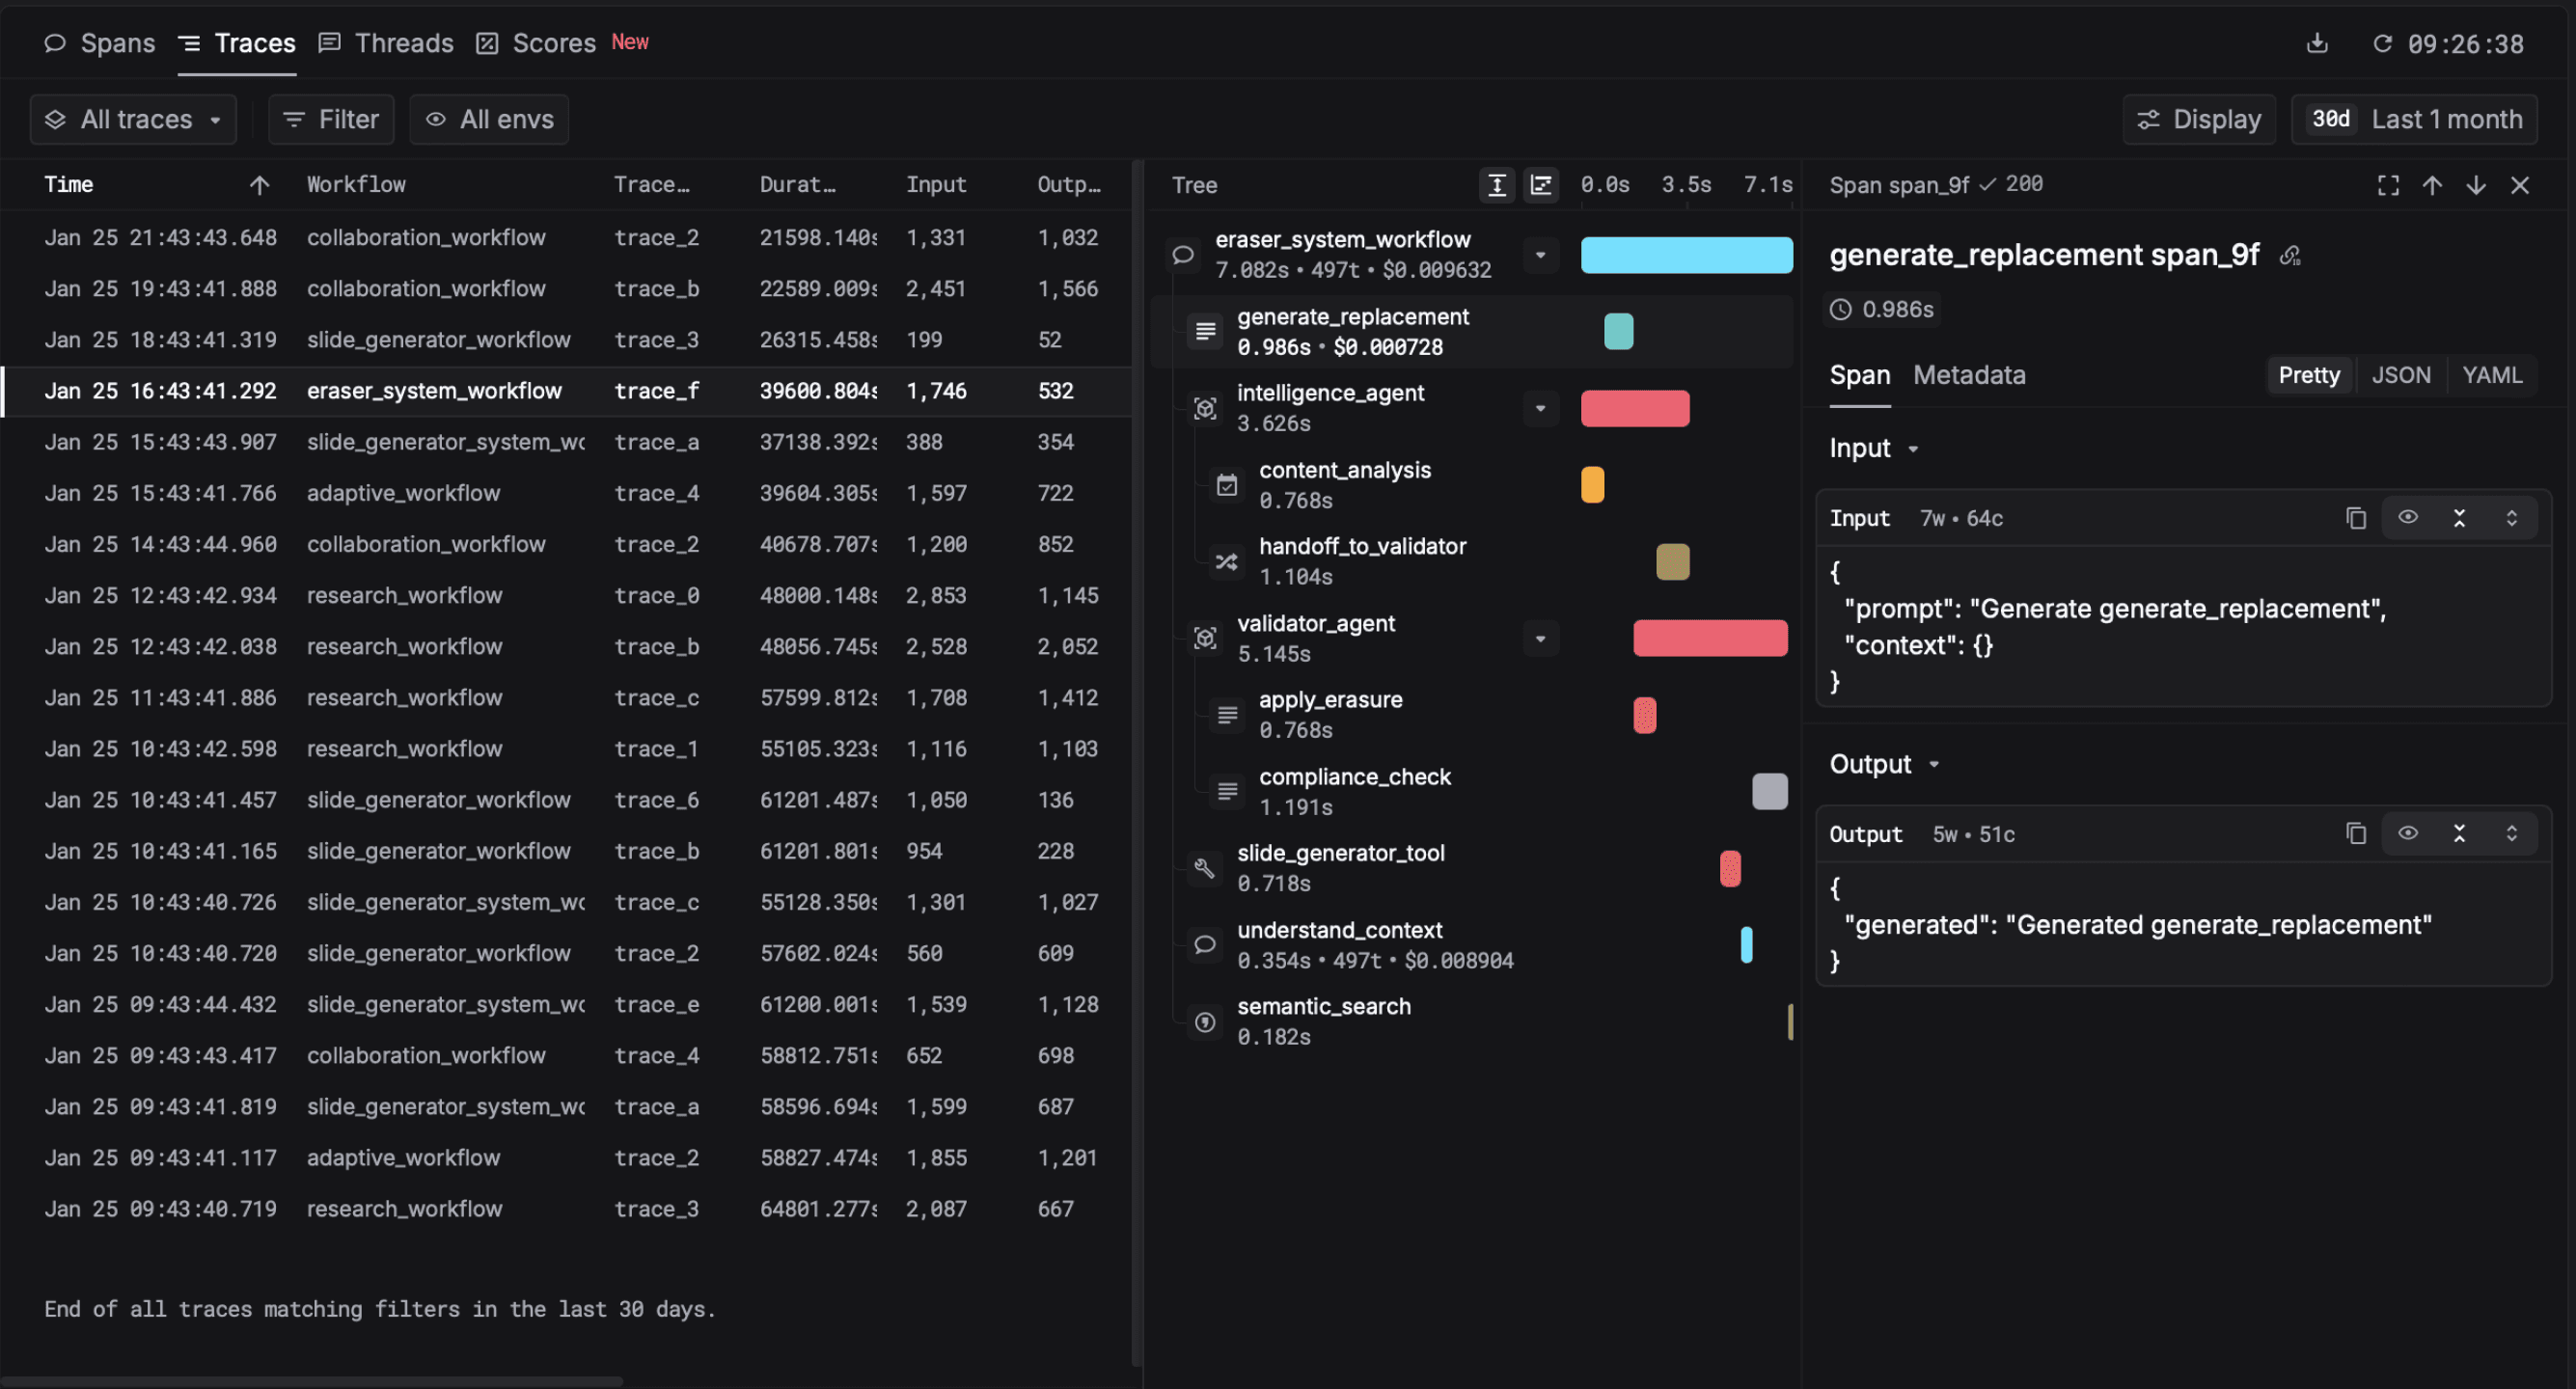
Production agent tracing on Respan
Every LLM call, tool, and agent step is a span in trace waterfalls and threads. Full capture by default. Debug regressions, cost, and eval scores on the same run.
See the full agent run
Every LLM call and tool step appears in one connected trace tree so you can debug multi-step agent workflows step by step, not scattered flat logs.
Follow the conversation
Group related messages into a single thread view while still seeing how each turn connects to spans in the underlying trace.
Tag cost and context on every span
Attach customer, feature, and custom metadata to every span so you can filter spend, latency, and behavior by team or use case.
Eval scores and production alerts on traces
Evaluators attach to the same trace_unique_id you use to debug. Score sampled traffic, promote failures to datasets, and alert when thresholds breach.
Eval scores on traces
Each score attaches to the span for that request; filter traces by evaluator results on the same log_id.
Online evals on production traffic
Run the same evaluators on sampled logs so scores hit production spans, not only offline tests.
Alerts when production scores drop
Wire automations to evaluator scores on live traffic; alert when thresholds slip, not when tickets arrive.
What breaks production agent traces
Six common gaps in homegrown tracing setups and how Respan capture, span hierarchy, redaction, and eval-linked traces address each.
Sampling early to save cost.
Head-sampling drops LLM failures that return HTTP 200. Default to full capture and sample only after you know what you can drop.
Forgetting to instrument tools.
Use @tool or an agent instrumentor so every tool execution is a child span under the same trace_unique_id as the LLM steps.
Spans not linked in the tree.
Set trace_unique_id and span_parent_id on each step, or use @workflow and @task so Respan builds the parent-child waterfall automatically.
Capturing PII without a plan.
Configure redaction at ingest in Respan before go-live, and tag spans with customer_identifier and metadata you intend to filter on.
One trace per LLM call.
Wrap the user-facing workflow in @workflow or @agent; each LLM and tool call should be a child span, not a separate root trace.
Eval scores not tied to traces.
Wire evaluators on production spans so faithfulness and format scores filter on trace_unique_id in the same tree you use to debug.
How to instrument
Call Respan() for auto-traced LLM calls, or use decorators for multi-step agent workflows.
Initialize Respan
Set RESPAN_API_KEY and call Respan() — supported LLM SDKs auto-trace every call.
Structure agent workflows
Use @workflow and @task so steps share one trace tree.
View traces in Respan
Open waterfalls and threads; filter by customer, metadata, or eval score.
import os
from openai import OpenAI
from respan import Respan

os.environ["RESPAN_API_KEY"] = "your-api-key"
Respan()

client = OpenAI()
response = client.chat.completions.create(
    model="gpt-4o",
    messages=[{"role": "user", "content": "..."}],
)
# OpenAI, Anthropic, Gemini, Bedrock, and more, auto-traced
import os
from openai import OpenAI
from respan import Respan
os.environ["RESPAN_API_KEY"] = "your-api-key"
Respan()
client = OpenAI()
response = client.chat.completions.create(
model="gpt-4o",
messages=[{"role": "user", "content": "..."}],
)
# OpenAI, Anthropic, Gemini, Bedrock, and more, auto-tracedFailure modes you should plan for
Disconnected traces, accidental PII capture, and storage growth: what enterprise teams address before scale, not after an incident.
Disconnected traces across services
Retrieval in Python, orchestration in Node; if W3C traceparent fails across HTTP boundaries, traces disconnect. Pass it on every service-to-service call; verify spans connect end-to-end.
PII captured into spans by accident
Default instrumentation captures payloads verbatim, emails, names, account numbers. Decide what to redact; configure ingest. Respan uses regex and LLM detection at the boundary.
Head-sampling drops the traces you need
Upfront sampling hides long-tail agent failures at volume. If you must sample, use tail-based retention on errors, slow traces, and eval-threshold hits.
Respan is committed to maintaining compliance with the most rigorous international safety and security standards.
ISO 27001
Respan is fully compliant with ISO 27001, the internationally recognized standard for information security management.
SOC 2
We meet SOC 2 requirements to ensure secure and compliant management of data across all our systems.
GDPR
With operations designed for global compliance, we operate under GDPR - the world's strictest standard for data privacy.
HIPAA
Respan is HIPAA compliant with a Business Associate Agreement available for healthcare organizations.
Works with your entire stack
Use Respan with your favorite frameworks and tools.