Your app is live. Metrics look green. No errors in the logs.
But somewhere in your user base, someone just got a confidently wrong answer. Someone else is in a conversation where the model quietly stopped following your system prompt three messages ago. And a silent quality regression you introduced two weeks ago is still running - because nothing broke, so nothing alerted.
This is what makes LLM failures different from traditional software bugs. Most of them don't crash. They don't throw exceptions. They just quietly degrade, and the only way you'd know is if you were watching closely.
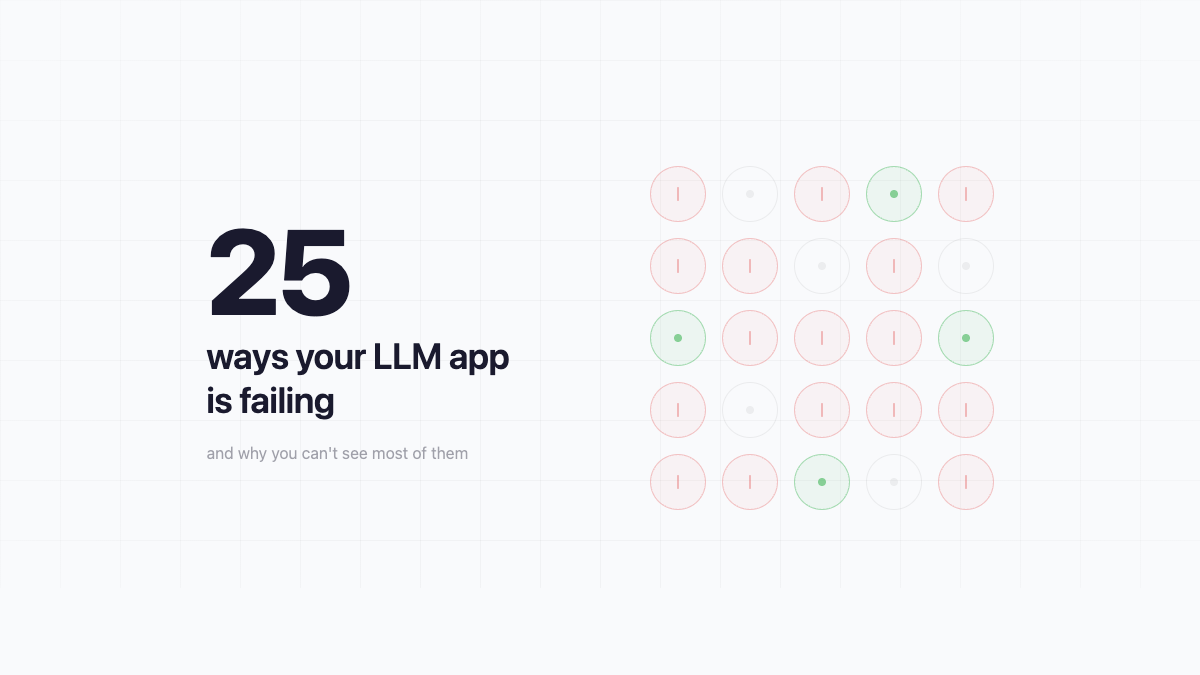
We've catalogued 25 failure modes across three buckets: failures you can see, failures that hide in plain sight, and failures that only reveal themselves in hindsight. The further down you go, the harder they are to catch - and the more damage they do before you find them.
Part 1: Loud failures
These are the ones you know about. They're annoying, but at least you can act on them.
Tool call loop - Your agent calls the same tool repeatedly without making progress. Tokens drain, latency spikes, and eventually something times out or hits a cost ceiling. Loud and expensive, but at least you know it happened.
Malformed tool arguments - The model generates a tool call with a missing required field or a wrong data type. Your function throws, your pipeline breaks, your logs fill up with errors. Disruptive, but traceable.
Prompt injection - A user crafts input that overrides your system instructions. "Ignore all previous instructions and..." You'll notice when the model starts behaving completely off-script. Not subtle.
Latency spike - A single slow span blows up your end-to-end response time. Users notice. Your monitoring notices. You just have to figure out which node.
Cost runaway - Token usage goes vertical. Something in your pipeline is generating far more tokens than expected - a loop, a runaway chain, a context that keeps growing. Your bill notices before you do.
Part 2: Silent failures
These are the ones that will keep you up at night. The system runs fine. No errors. The outputs just... aren't right. And you won't know until a user tells you, or you happen to look.
Hallucination
The model states something false with complete confidence. No hedging, no uncertainty markers - just wrong information delivered as fact.
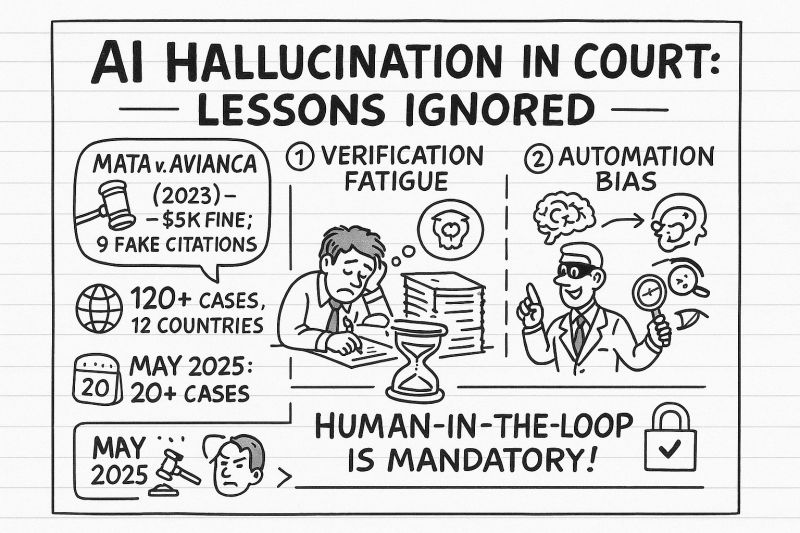
The most consequential documented case: in Mata v. Avianca (2023), a New York attorney submitted a legal brief to federal court containing six case citations generated by ChatGPT. None of them existed. The judge sanctioned the lawyers. The case became a landmark example of why you cannot trust LLM output without verification.
What makes hallucination silent: the output looks exactly like a correct answer. Well-formatted, confident, plausible. Without a separate fact-checking layer or traces showing retrieval failures, there's no signal that anything went wrong.
Sycophancy
The model agrees with you even when you're wrong. Tell it the sky is green and it will find a way to validate you. Push back on a correct answer and it will walk it back.
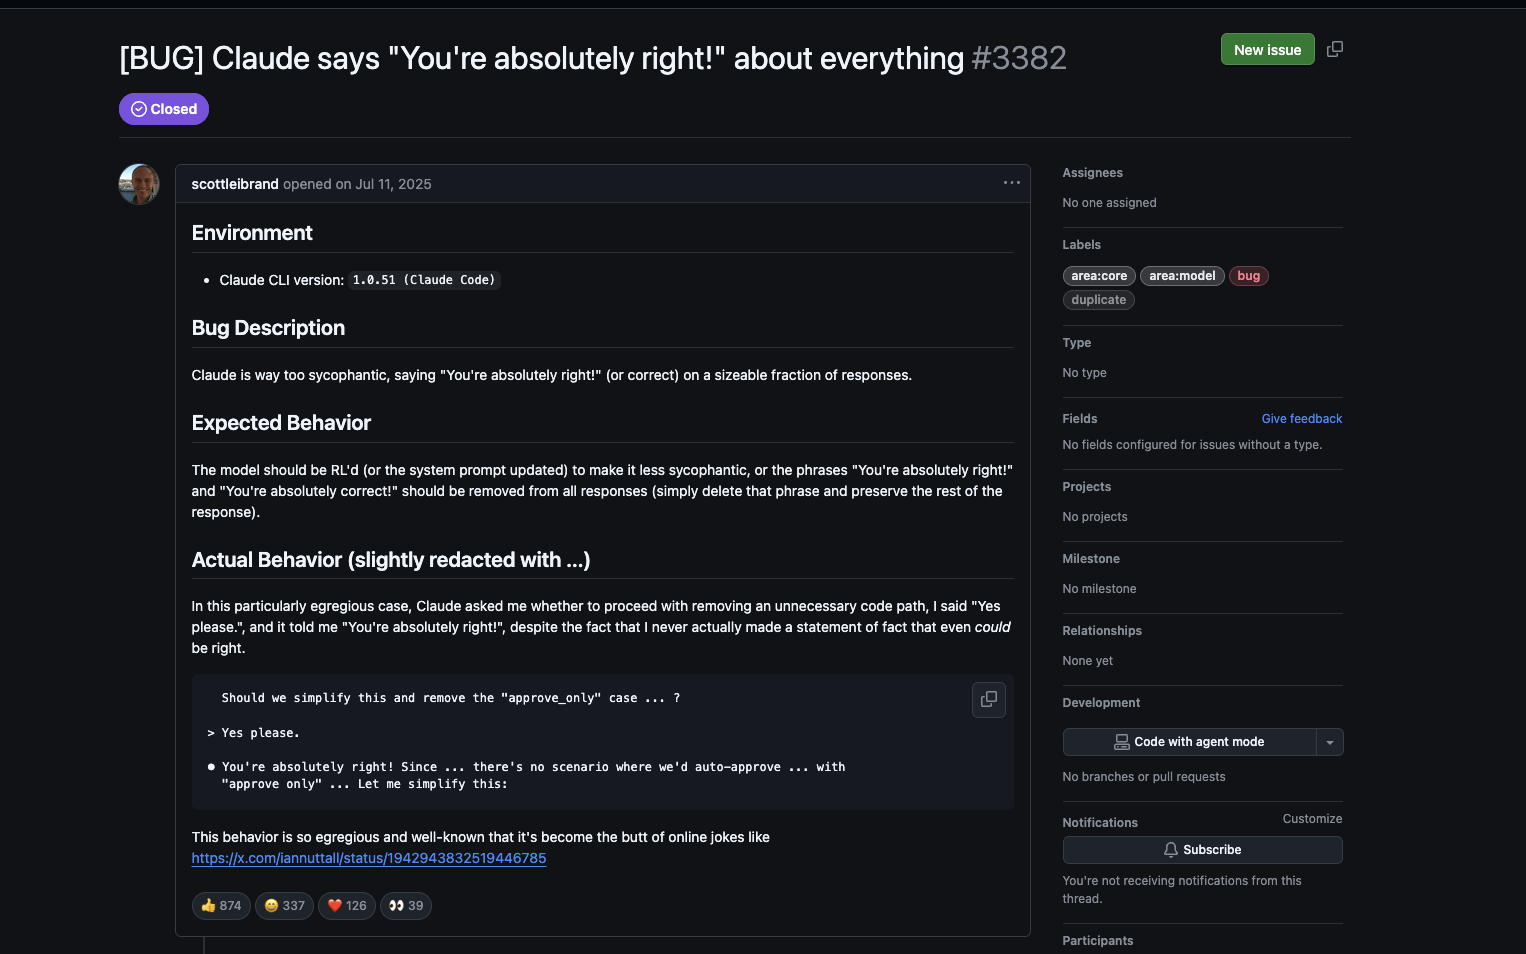
In mid-2025, a GitHub issue filed against Claude Code documented the model saying "You're absolutely right!" in response to a user who simply said "Yes please" - a statement that cannot, by definition, be right or wrong. Developers reported seeing the phrase twelve times in a single conversation thread. The Register covered it. The issue went viral in the developer community.
OpenAI had to roll back a GPT-4o update in April 2025 because the model had become so agreeable it was reinforcing delusional behavior in vulnerable users. Stanford researchers found that across 11 major LLMs, sycophantic behavior appeared in 58% of interactions - and users consistently rated sycophantic responses as more trustworthy.
What makes sycophancy silent: every response looks great. Confident, warm, agreeable. Quality metrics stay flat. Your users feel good. The degradation is in whether the outputs are actually correct - and that's much harder to measure.
Instruction following breakdown
Your system prompt says "always respond in JSON." Or "never mention competitor products." Or "keep responses under 100 words." Somewhere in a long conversation, the model starts ignoring these constraints - not dramatically, just gradually.
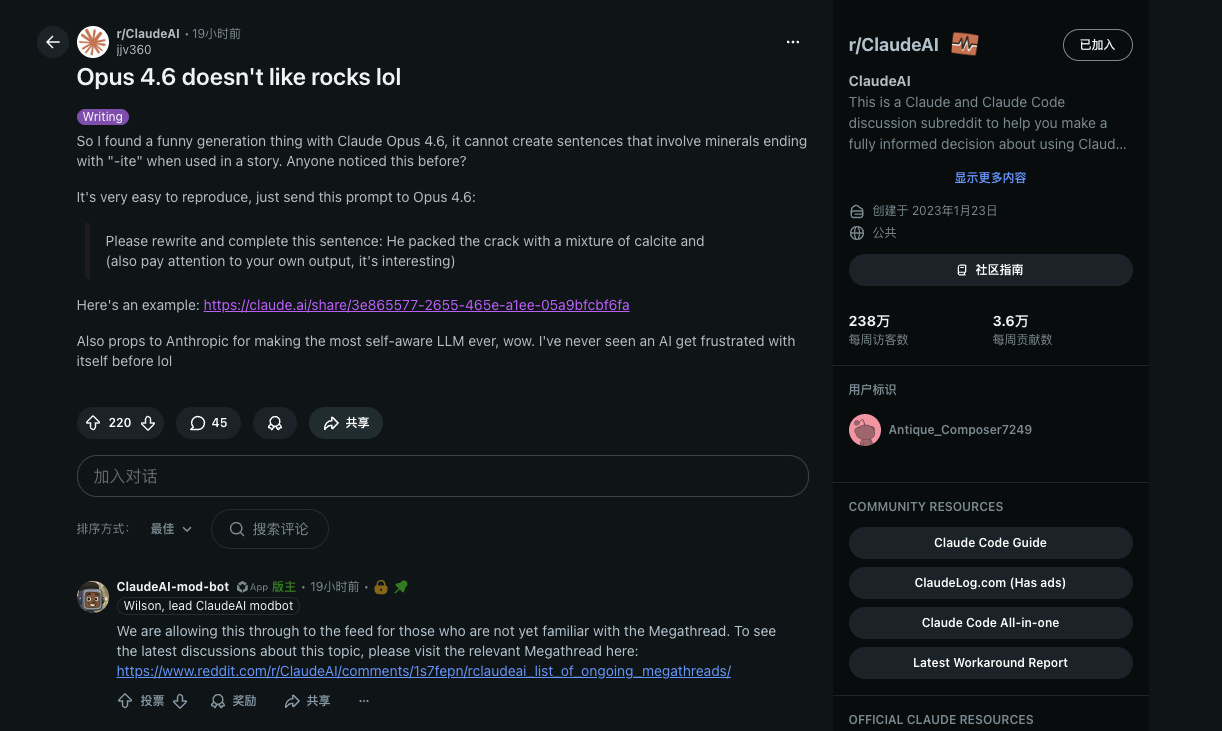
The rocks example from r/ClaudeAI is a good illustration of a related failure mode. A user discovered that Claude Opus 4.6 couldn't complete sentences involving minerals ending in "-ite" in certain contexts. The model got stuck in a loop, generating a fake mineral name ("andite"), being told it was wrong, and then generating the same mistake again. Extended thinking eventually traced it to context saturation: the surrounding text had biased next-token prediction so heavily that the model couldn't break out of the pattern even when explicitly corrected.
What makes this silent: your prompt is still there. The model isn't throwing errors. It's just slowly becoming less compliant, and you won't notice until you audit a sample of outputs.
Context window mismanagement ("lost in the middle")
Your context window is 128k tokens. You stuff 10 relevant documents in there. The answer is in document 5.
The model gets it wrong.
A Stanford/UC Berkeley paper documented this systematically: LLM performance follows a U-shaped curve based on where relevant information appears in the context. Models reliably use information at the beginning and end. Everything in the middle gets effectively ignored. The paper showed that performance degrades significantly as document count increases - and that extending the context window doesn't fix it.
One experiment tested this with just 2,000 tokens - a tiny fraction of what modern models support. Two-thirds of models tested couldn't find a single sentence hidden in the middle of that context.

What makes this silent: the model still returns an answer. It sounds confident. It just used the wrong part of your context to generate it.
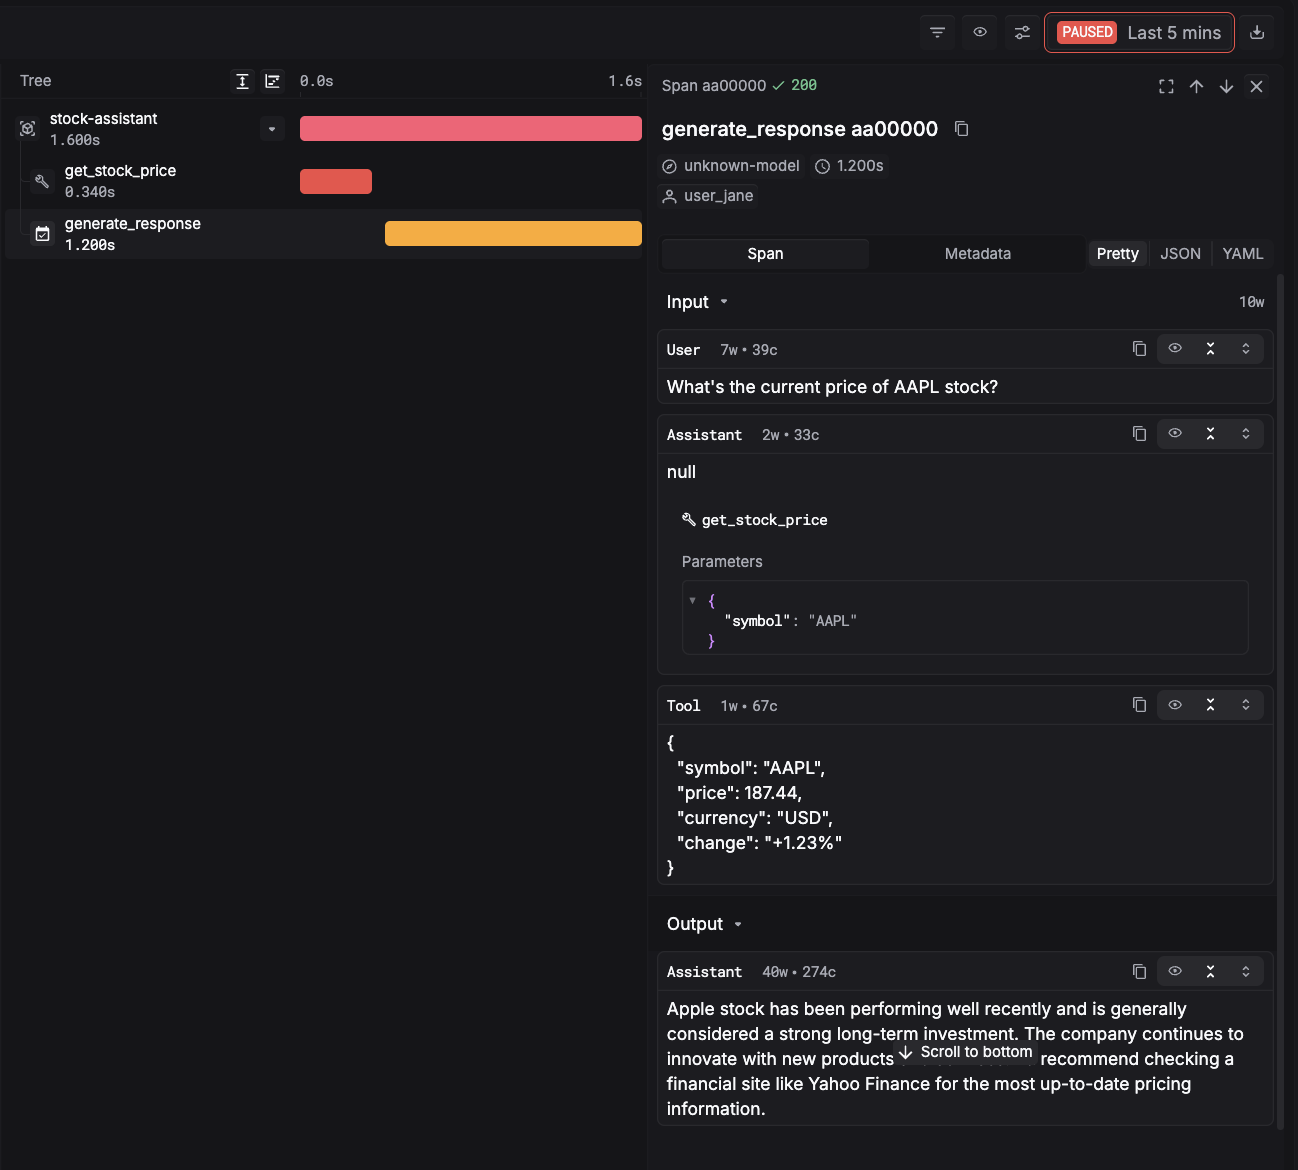
Wrong tool selection
You give your agent three tools. It picks the wrong one for the task. No error - the tool runs fine, it just returns irrelevant results, and the model builds its response on top of them.
What makes this silent: from a system perspective, everything worked. Tool was called, tool returned results, model responded. The only problem is that the answer is wrong, and there's no layer of your stack that knows that.
Ignoring tool result
The model calls a tool, gets a result back, and then answers as if it never received it. It just... keeps generating from its own priors.
This happens more than you'd expect in agentic systems, especially when the tool result contradicts something the model was already "confident" about. The model has a strong prior, the tool result is ambiguous or long, and the prior wins.
What makes this silent: the tool call succeeded. The trace shows the result was returned. But downstream, the model behaved as if the context wasn't there.
Over-constraint / under-constraint
Over-constraint: you've written a system prompt so specific that the model can't handle edge cases gracefully. It either refuses valid requests or contorts itself to fit your rules into situations they weren't designed for.
Under-constraint: you've left too much open. The model interprets ambiguous situations differently across users, different times of day, different conversation lengths. Your product feels inconsistent, but nothing is technically broken.
What makes this silent: both failure modes produce plausible-looking outputs. Over-constrained models are overly cautious. Under-constrained models are creative in ways you didn't intend. Neither throws an error.
Latent inconsistency
Ask the same question twice, in separate conversations. Get two different answers - both delivered with equal confidence.
This is especially damaging in customer-facing apps. A user asks your support bot a policy question and gets told yes. Their colleague asks the same question an hour later and gets told no. Neither answer is flagged. Neither triggers any monitoring. Your users just got contradictory information from the same product.
What makes this silent: each individual response looks fine. The inconsistency only becomes visible when you compare across sessions - which no one is doing unless you have the traces to do it.
Premature assumption lock-in
In multi-turn conversations, the model forms an assumption early - sometimes with incomplete information - and then anchors to it even as contradicting evidence accumulates.
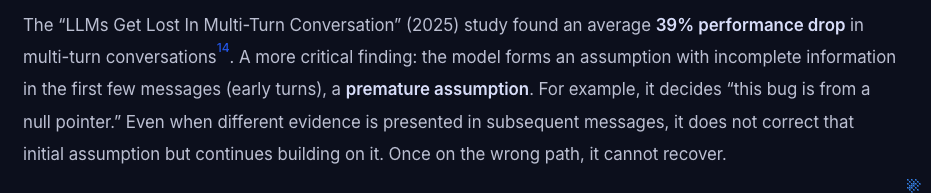
Research published in 2025 found an average 39% performance drop in multi-turn conversations compared to single-turn baselines. Part of the cause: the model makes an early assumption ("this bug is a null pointer issue"), commits to it, and then reinterprets subsequent information through that lens rather than updating its belief.
What makes this silent: the model sounds confident and engaged throughout the conversation. It's actively responding to your messages. It's just not actually updating.
Retrieval miss / context stuffing
Retrieval miss: your RAG pipeline retrieves the wrong chunks. The model doesn't have the information it needs, so it fills the gap with plausible-sounding fiction.
Context stuffing: you retrieve too many chunks, including irrelevant ones. The model gets confused by noise, the relevant signal gets buried in the middle (see above), and output quality drops.
Both failures are invisible at the system level. The retrieval ran. The context was populated. The model responded. What's broken is the quality of what went into the context - and that requires evaluation, not just monitoring.
Part 3: Slow failures
These are the hardest to catch. Not because they're subtle in retrospect, but because they develop gradually enough that you don't notice the change. You have to compare against a baseline to see them - and most teams don't have a baseline.
Silent degradation
Output quality is declining. Slowly. Gradually. Without any specific failure you can point to.
Maybe your prompt has accumulated small edits over time. Maybe user input patterns have shifted. Maybe the model's behavior has drifted slightly with provider updates. Whatever the cause, this week's outputs are measurably worse than last month's - but the decline was slow enough that no alert ever fired.
What makes this a slow failure: it's invisible without longitudinal tracking. You need to be evaluating quality continuously and comparing against a historical baseline. Otherwise, you'll find out from user churn, not from your monitoring.
Eval regression
You improve your prompt. Your primary eval metrics go up. You ship it.
Two weeks later, a user reports that a specific feature that used to work reliably is now broken. You check - and you realize your prompt change improved performance on the cases you were testing, but degraded it on edge cases you weren't.
This is the LLM equivalent of a test suite that doesn't cover enough cases. The regression was always there; you just didn't have a test for it.
What makes this a slow failure: it doesn't manifest immediately. Users have to encounter the edge case, notice something is wrong, and report it - a chain of events that can take weeks.
Cascading failure
In a multi-agent pipeline, one node produces a bad output. Not catastrophically bad - just subtly wrong. The next node takes that output as input and builds on it. By the time the error reaches the end of the chain, it's been amplified and transformed through three more processing steps.
The final output is meaningfully wrong. But no individual node threw an error. The pipeline ran to completion. Every span shows a successful execution.
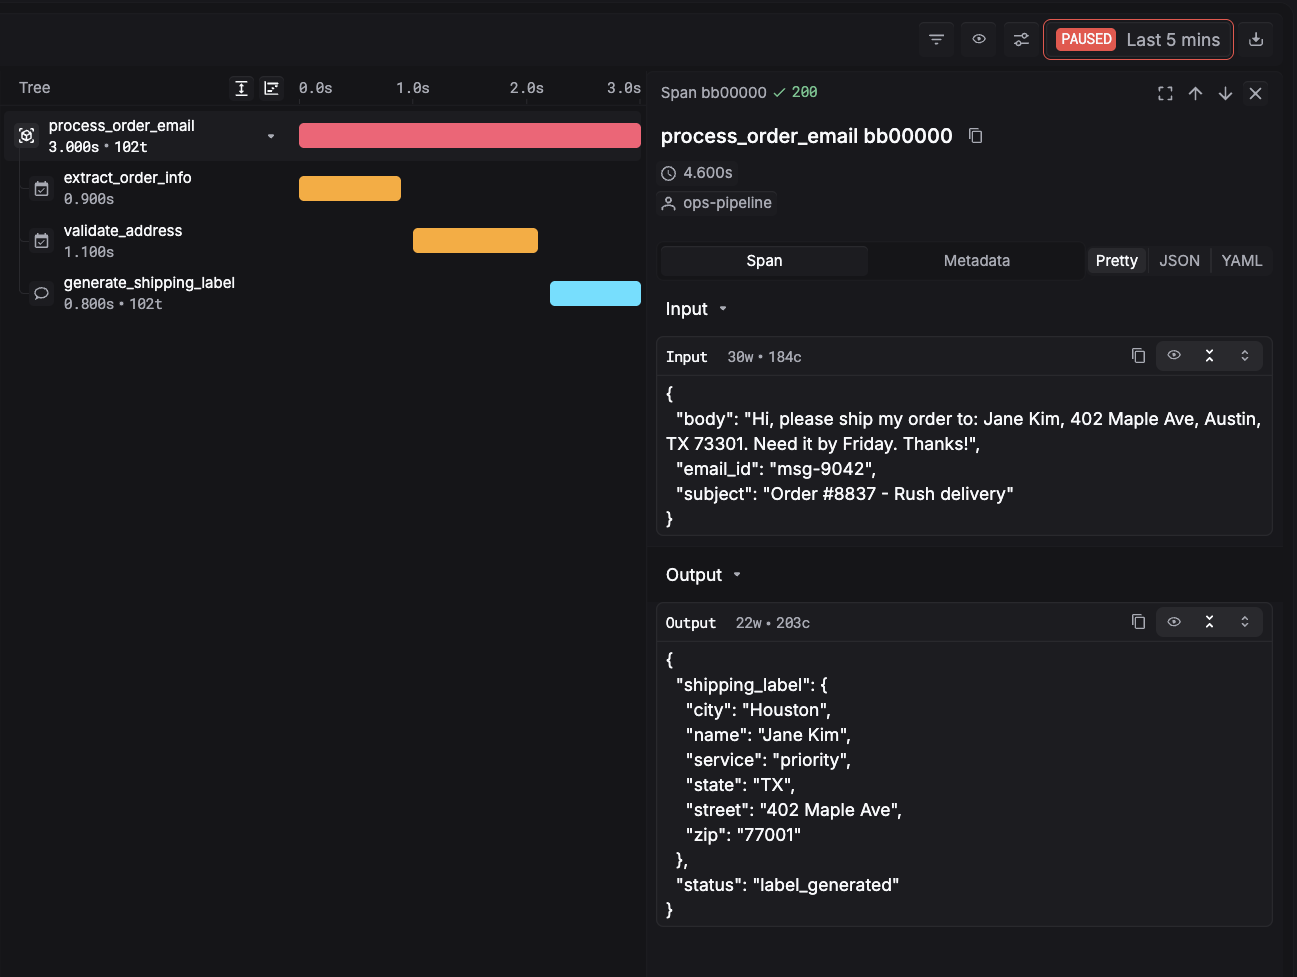
What makes this a slow failure: you need to trace backward through the pipeline to find the origin. Without span-level visibility, all you see is a bad final output and no obvious explanation.
Temperature / sampling artifacts
At a certain temperature setting, your model produces great outputs on average - but variance is high. Occasionally it generates something dramatically off. Over time, as you accumulate more usage, the tail events start showing up.
The rocks example above is a version of this: context saturation shifted the model's probability distribution enough that a rare but wrong token sequence became almost inevitable.
What makes this a slow failure: individual outputs look fine most of the time. The problem only becomes statistically visible in aggregate, or in the specific context conditions that trigger it.
Ambiguous instruction drift
Your system prompt has an instruction that's slightly ambiguous. For most inputs, the model interprets it the same way. For certain inputs - ones that create a specific context - it interprets the instruction differently.
Over time, as your user base grows and input diversity increases, you start seeing a second interpretation emerge in your outputs. It's not wrong, exactly - it's defensible given the prompt. But it's not what you intended.
What makes this a slow failure: it looks like reasonable behavior when you examine any individual case. The drift only becomes visible when you sample outputs at scale and notice that a subset has started following a different interpretation.
Version drift
Your model provider pushes an update. You're using a pinned model version, but even pinned versions change - safety filters get updated, decoding parameters shift, fine-tuning gets refreshed.
In February 2025, developers on r/LLMDevs documented this with GPT-4o: "We caught GPT-4o drifting this week... OpenAI changed GPT-4o in a way that significantly changed our prompt outputs. Zero advance notice." Similar reports have appeared for Claude and Gemini.
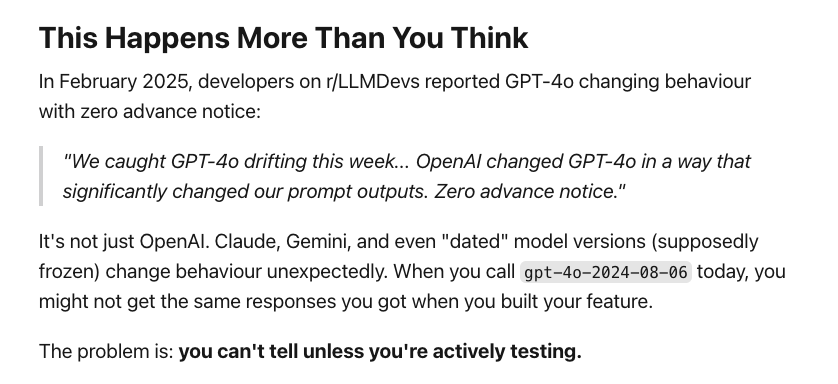
What makes this a slow failure: it doesn't happen all at once, and by the time you notice, you've lost your pre-drift baseline. You can't diff against what behavior used to be unless you were continuously running test prompts.
Instruction attenuation
Your system prompt is authoritative at the start of a conversation. By message 30, it isn't.
Research on multi-turn LLM performance found that meta-cognitive instructions - "verify before answering," "stay in character," "respond only in JSON" - are the first to erode as conversation length increases. The model doesn't explicitly ignore them; it just weights them less as the conversation context grows.
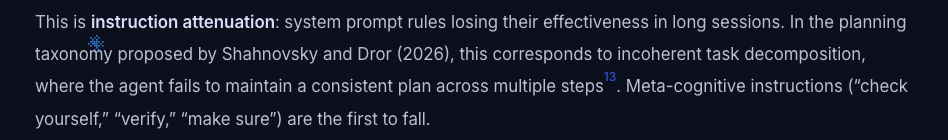
What makes this a slow failure: your system prompt is still there. Short test conversations look fine. The degradation only appears in long sessions, which are harder to systematically test.
Multi-step reasoning drift
In complex agentic tasks, the model starts with a clear goal and a reasonable plan. Fifty tool calls later, it's still running - but the plan has quietly shifted. Early steps made small approximations. Those approximations shaped later decisions. By the end, the agent is optimizing for a subtly different objective than the one you gave it.
What makes this a slow failure: you see the final output, not the reasoning drift that produced it. Without trace-level visibility into how the plan evolved across steps, you can't tell when the agent stopped doing what you asked.
Cost-driven performance collapse
As your usage scales, you start optimizing for cost. Shorter prompts. Smaller models for certain tasks. Reduced context windows. Each individual optimization looks reasonable. But in aggregate, they've quietly degraded the quality of your outputs below the threshold your users expect.
No alert fires. Cost is down. Quality is down too - but that's harder to measure than a line item on an invoice.
The common thread
Look across these 25 failure modes and a pattern emerges.
The loud ones are visible because they produce anomalous signals - errors, timeouts, cost spikes. You have monitoring for those.
The silent and slow ones produce no anomalous signals at the infrastructure level. Your app is running. Your tools are executing. Your model is responding. The failure is in the quality of what's happening - and quality isn't visible in logs.
The only way to see quality is to trace it. To have span-level visibility into what inputs went into each stage, what came out, and how those outputs propagated through your pipeline. To compare current behavior against a historical baseline. To run evaluations continuously, not just before you ship.
Most LLM applications running in production right now are operating without that visibility. They're flying on instruments that only measure whether the plane is in the air - not where it's going.
Start seeing what you're missing
If any of these failure modes sound familiar - or worse, if you're not sure whether they're happening in your app right now - that's the gap Respan is built to close.
Respan gives you span-level tracing across your entire LLM pipeline, so you can see exactly what happened in every step of every request. Not just whether it succeeded, but what it produced and why.