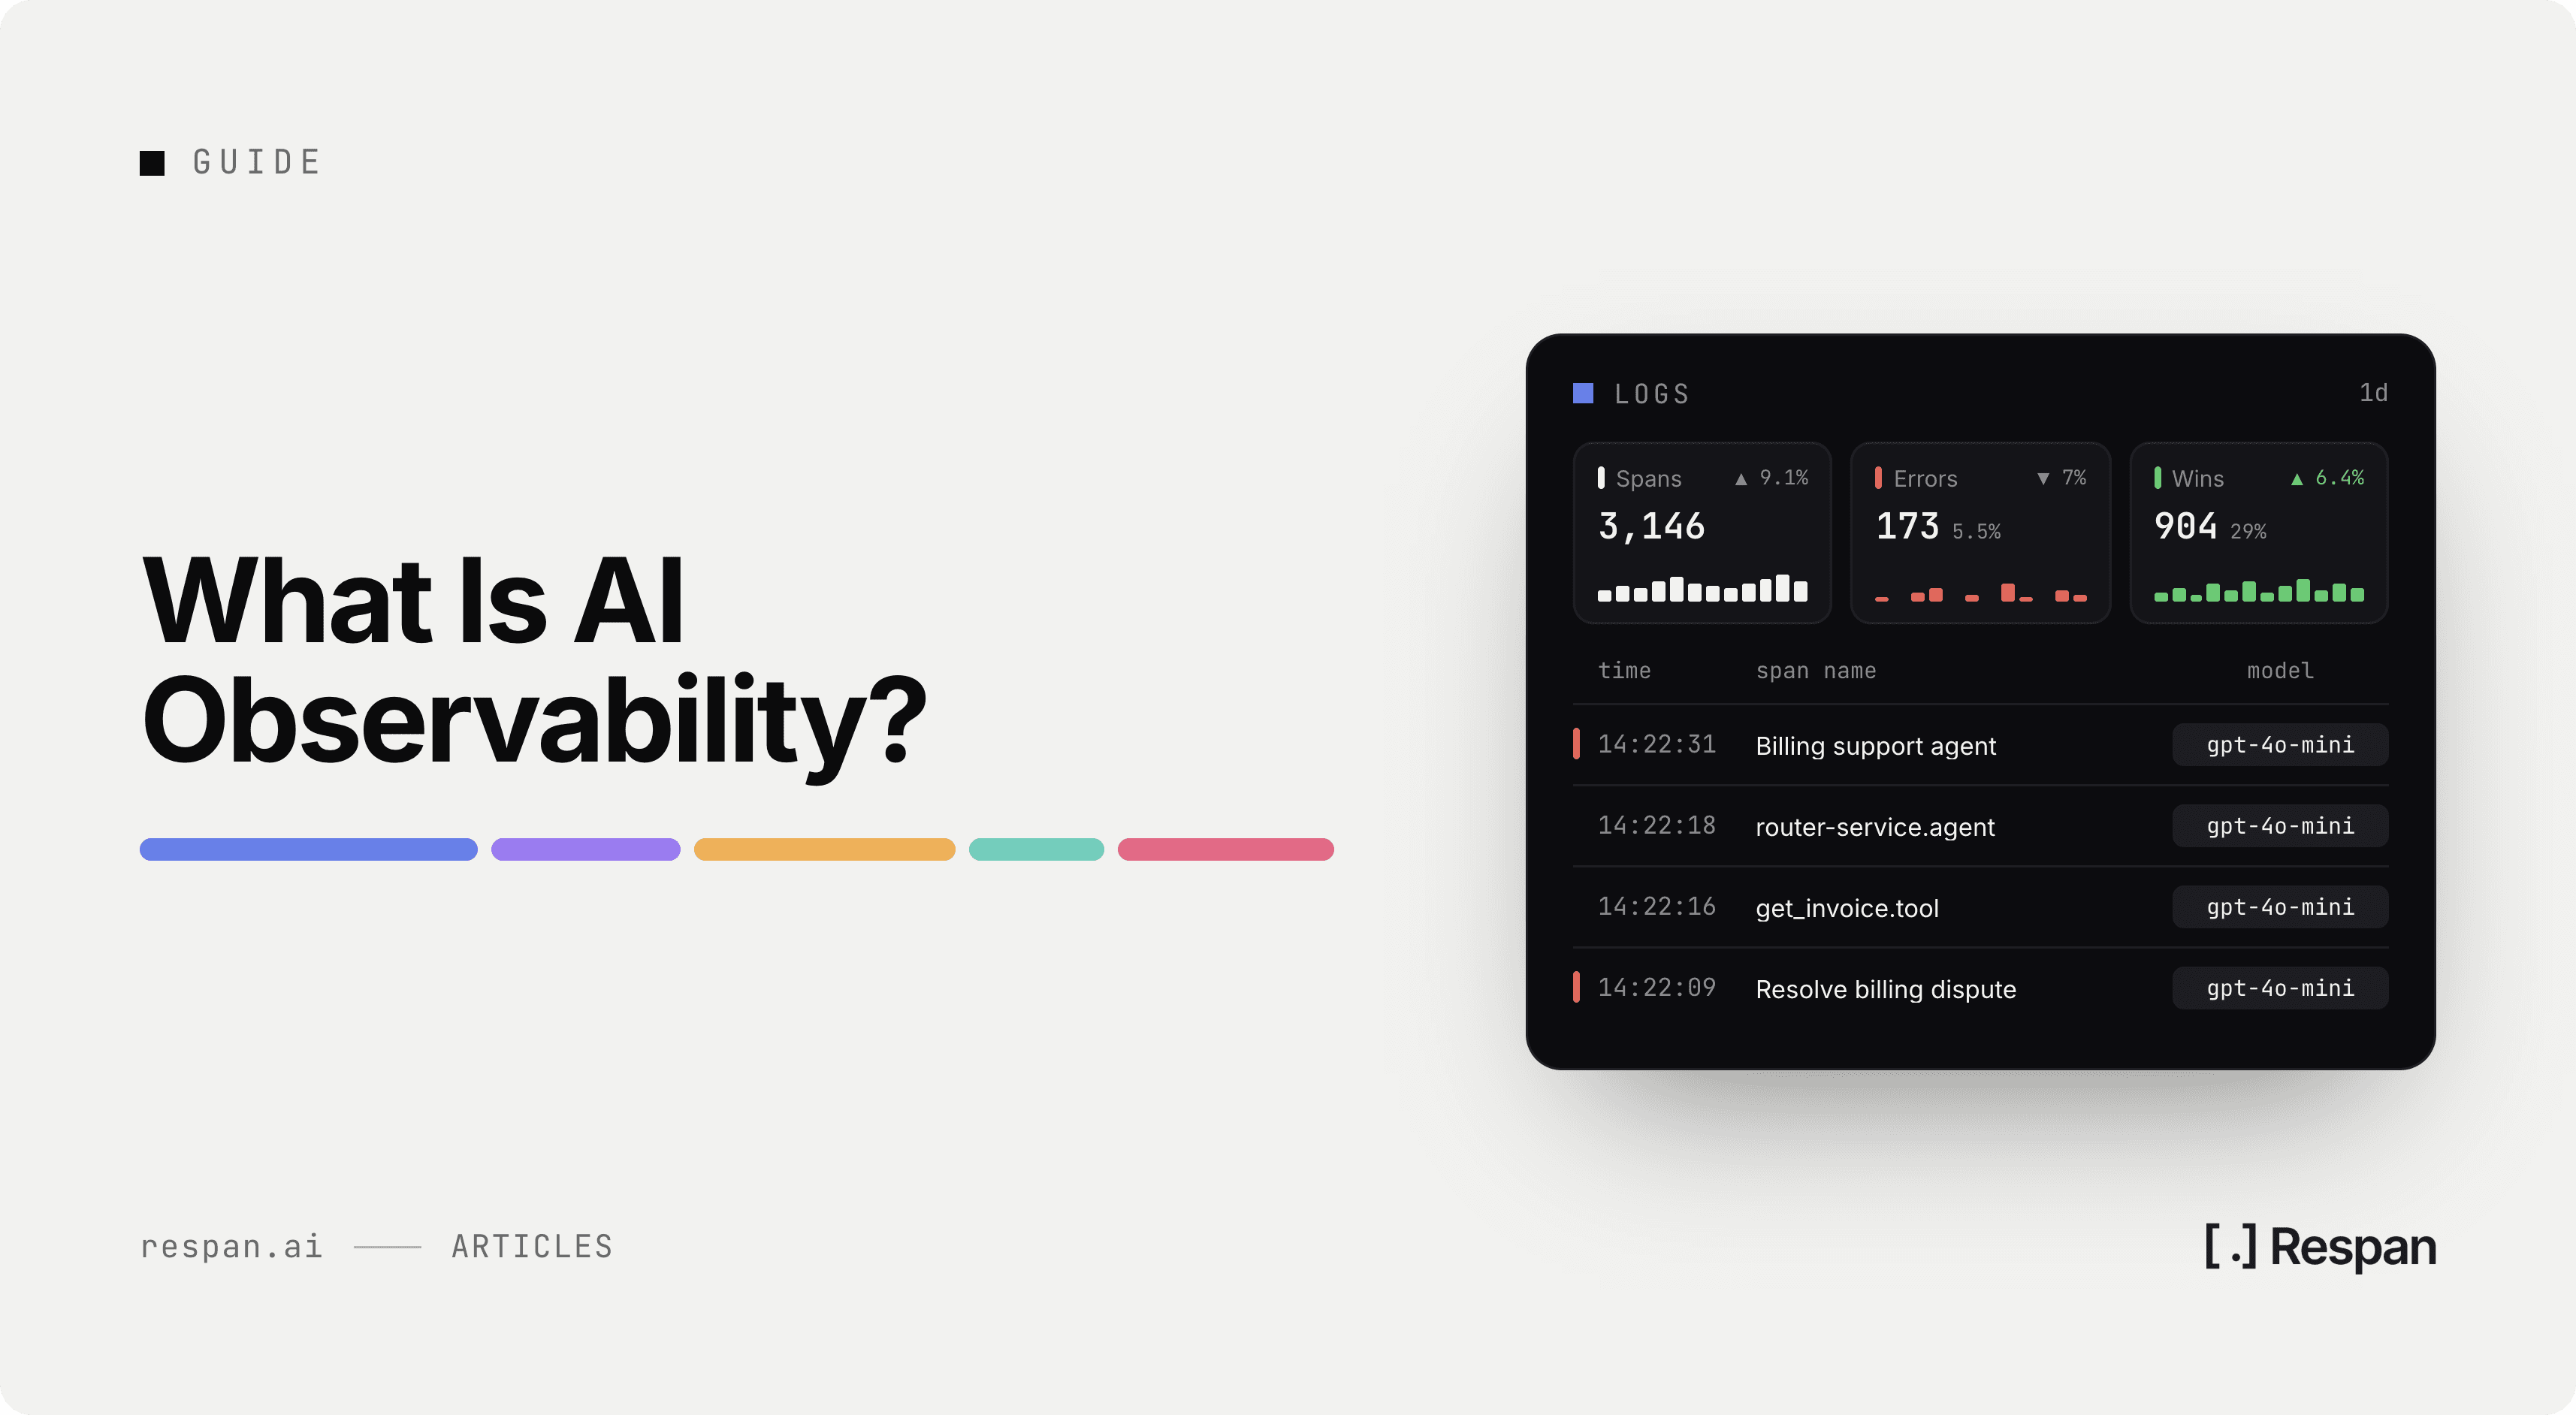
AI in production increasingly means agents rather than a single prompt behind a chat box. They plan, call tools, read the results, and loop until they think they're done, and once they meet real users, the question developers keep asking is some version of "why did the agent do that?" Traditional dashboards rarely have the answer, because the request that produced the bad result usually succeeded.
That matters because the failures that cost you users, and the ones AI observability is built to catch, are quality failures. An agent can return a 200 in 400 milliseconds, stay under budget, and still skip a required step in a refund workflow. Nothing in latency or error rate moves when that happens.
The fix is to treat output quality as a signal you capture and score, right next to the cost and latency data you already collect. The teams that get it right instrument the whole run rather than the single call, and they keep each metric and the trace behind it in the same place.
Below is what AI observability is and how to run it for agents in production.
What Is AI Observability?
AI observability is the practice of tracing and scoring what AI systems do in production, from the input a user sent through every retrieval, tool call, and model call to the output that came back. It tells you whether the system was right, not just whether it responded.
It covers the whole AI system rather than a single model call, which is the narrower scope of LLM observability: the agents and models, the data and infrastructure they run on, and the governance around what gets stored. In practice that means capturing traces, evals, user feedback, and cost together, so a quality drop can be traced back to the step that caused it.
Why AI Observability Is Different From Traditional Observability
Traditional observability was built for deterministic systems. The same input gives you the same output, and when something breaks it breaks loudly: an error, a timeout, a 500. You watch latency, error rates, and resource usage, and those catch most of what goes wrong.
AI systems break quietly. The same prompt can return a different answer every time you run it, and nothing throws when a model invents a citation or ignores half your instructions. The bad response has the same status code, latency, and shape as a good one, so the only thing wrong is the content, which is the one thing older tooling never had to look at.
A few properties make AI systems harder to observe:
- Non-deterministic outputs - You cannot reproduce a bad output by replaying the input, because temperature, model version, and context all move under you.
- No ground truth at runtime - A failed database query is simply failed. A weak model answer is a judgment call, and that judgment has to come from an eval, a human, or a downstream signal.
- A new failure axis - A traditional service is up or down. An AI system can be up, fast, and cheap while still being wrong, and quality is the dimension that loses you users.
Each of those is a reason latency and error rate can't stand in for correctness, and the problem compounds once a single call turns into a multi-step agent.
How AI Observability Works
AI observability works by capturing signals at every layer of a request and letting you query them together, since no single signal tells you the whole story. Each signal lives at a specific layer of the stack, and knowing which layer it belongs to is most of what makes instrumentation clean:
- Interface layer - The user-facing edge, where input comes in and feedback comes back.
- Orchestration layer - Prompt construction, retrieval, and routing. For RAG observability, retrieval is its own surface, since a wrong answer often traces back to the wrong document rather than the model.
- Reasoning layer - The agent's steps: planning, tool calls, and loops.
- Model layer - The raw LLM call, where tokens, cost, and latency are set.
- Infrastructure and data layer - Provider availability and rate limits if you call hosted models, GPU and memory if you serve your own, and the freshness of the documents your retrieval depends on.
Traces tie those layers into one request, and evals attach a quality judgment at any of them. The classic pillars of observability (logs, metrics, and traces) still apply, but none of them captures output quality, which is why evals and user feedback sit next to them for AI systems. Monitoring is the narrower piece that watches known thresholds and pages you, and the line between observability vs monitoring matters most when the failure is one nobody set a threshold for.
Traces and Spans
A trace is the full record of one request, and each step inside it (the retrieval, the prompt, the model call, a tool invocation) is a span. A chat completion might be a single span while an agent run can be dozens, and having them linked is what lets you open the request a user complained about and see exactly what the model saw, which is the core of how LLM tracing works.
Evals
Evals are how you put a quality judgment on an output. They run from cheap deterministic checks (did you get valid JSON, did it stay under the token budget) to LLM-as-judge scoring (was this relevant, grounded, on-instruction) to human review.
Collecting evals is only half the job. The value comes from alerting on them, diffing them across releases, and catching a regression before your users do. An eval you never act on is just an expensive log line.
User Feedback
User feedback is the ground truth traditional observability never had. Thumbs up and down are the obvious signals. The implicit ones are usually more honest. A user who edits your output, retries the same prompt, or quits the session is telling you something failed, even if they never touch a button. Capture those and real usage becomes a running eval.
Cost and Tokens
Every LLM call has a price, and unlike CPU or memory, it maps straight to a line on an invoice. Treat token counts per call, per user, and per feature as first-class signals. They show you where spend piles up, which features lose money, and the moment a prompt change quietly doubled your bill. You watch cost right next to quality, because the two are always pulling against each other.
OpenTelemetry and Instrumentation
How you capture these signals decides how hard it is to change tools later. A vendor SDK is usually the fastest way to start, while OpenTelemetry instrumentation can export the same spans to more than one backend, so switching platforms doesn't mean reinstrumenting your codebase.
For LLM and agent workloads, the OpenTelemetry GenAI semantic conventions define standard attributes for model calls, agent spans, events, metrics, and MCP. They're still an emerging standard maintained in their own repository, so expect attribute names to keep shifting, but instrumenting against them now keeps your traces portable as the spec settles.
AI Observability Metrics to Track
These are the numbers you actually watch once it is running. Group them so a dashboard answers three questions at a glance: Is it fast? Is it expensive? Is it any good?
Performance
- Latency, at p50, p95, and p99. Averages hide the slow tail, and the tail is what users feel.
- Time to first token, for anything streamed to a user.
- Error and timeout rate, split by model and provider.
Cost
- Tokens per request, input and output separately, since output usually costs more.
- Cost per request, per user, and per feature. Per-feature is what tells you which parts of the product are unprofitable.
- Cost trend over time, so a prompt change that doubles spend shows up as a line, not a surprise invoice.
Quality
- Eval pass rate, tracked per release so a regression is visible before users find it.
- Groundedness or hallucination rate, for anything doing retrieval or citing sources.
- User feedback signals: thumbs, edit rate, retry rate, abandon rate.
The first two groups your old tooling can produce. The third is the reason AI observability exists. A dashboard that shows latency and cost but nothing about quality is monitoring an AI system as if it were a web server, and that is exactly the gap that lets a green dashboard sit on top of a broken feature.
The AI Monitoring and Observability Checklist
Latency and errors are the half a good APM tool already gave you. The evals and quality signals are the half that catches what APM cannot see:
- Capture full request and response traces on every LLM call
- Log token counts and cost per call, per user, and per feature
- Track latency at the span level, not just end to end
- Run evals on outputs, not just collect them
- Alert on quality regressions, not only errors and downtime
- Capture user feedback signals: thumbs, edits, retries, abandons
- Tag traces by version (prompt, model, agent config) so you can diff releases
- Monitor tool-call success and failure rates for agents
- Sample high-volume endpoints so cost stays sane
- Retain traces long enough to debug an issue reported days later
The line runs through the middle of that list. Everything above "run evals" is table stakes your old tooling can handle. Everything from evals down is specific to AI, and it is where the real failures hide.
AI Agent Observability Best Practices
A single-call LLM app has one thing to observe. An agent has a chain. It plans, calls a tool, reads the result, decides again, calls another tool, and loops until it thinks it is finished. Every link can fail, and a broken link usually shows up as a weird output three steps later. So you observe the whole run, not just the final answer.
Trace the Full Multi-Step Run
Capture the entire agent run as one connected trace, with every planning step, tool call, and model call as a span underneath it. The value is in the sequence. A wrong final answer often traces back to a bad decision several steps earlier, and you can only find it when the steps are linked. This is the same discipline that turns agent debugging into something you can actually do instead of guess at.
Instrument Tool Calls
Tools are where agents touch the real world, and where they break most visibly. Record the arguments the agent passed, the raw response the tool returned, and whether the call succeeded. A malformed argument, or a tool error the agent silently ignored, is one of the most common reasons a run goes sideways. Designing tools that fail cleanly is half the battle, and most agent tools best practices come back to the same point: an agent can only recover from an error it can actually see.
Catch Loops and Runaway Chains
Agents loop. Sometimes they loop nearly forever, retrying the same failed step and burning tokens on every pass. Track the step count and the cost per run, and alert when either crosses a threshold. A run that took forty-seven tool calls to do a two-call job is a bug, and it stays invisible unless you are counting.
Track Handoffs Between Agents
In a multi-agent system, one agent hands work to another, and the handoff is a failure point. Context gets dropped, an instruction arrives ambiguous, two agents disagree. Watch what state crosses each boundary so you can see exactly where the chain of custody broke.
Governance and Compliance in AI Observability
Observability data is often sensitive data. Prompts and completions routinely carry names, account details, and health or financial information, and a trace that captures the full run captures all of it. Because of that, PII handling has to be decided at ingest: mask or redact identifiers before they're written, and turn logging off entirely for requests that should never be stored.
Retention and audit trails are the other half. When a reviewer asks which model and prompt version produced a given output, a trace tagged by version is the record that answers it. Common AI governance frameworks, including the EU AI Act and the NIST AI RMF, call for that kind of record along with ongoing monitoring, so set retention to cover an audit window rather than only a debugging window, and restrict who can read raw traces.
AI Observability in Production
In production, observability is metrics, saved views, and alerts running on the same logs and traces you already instrument for debugging. You watch requests, tokens, errors, latency, and cost as they move, and you get paged when something crosses a line you set. The failure mode is fragmentation: metrics in one tool, traces in another, cost in a billing export. When a chart spikes, you cannot open the runs behind it, and the number stops meaning anything.
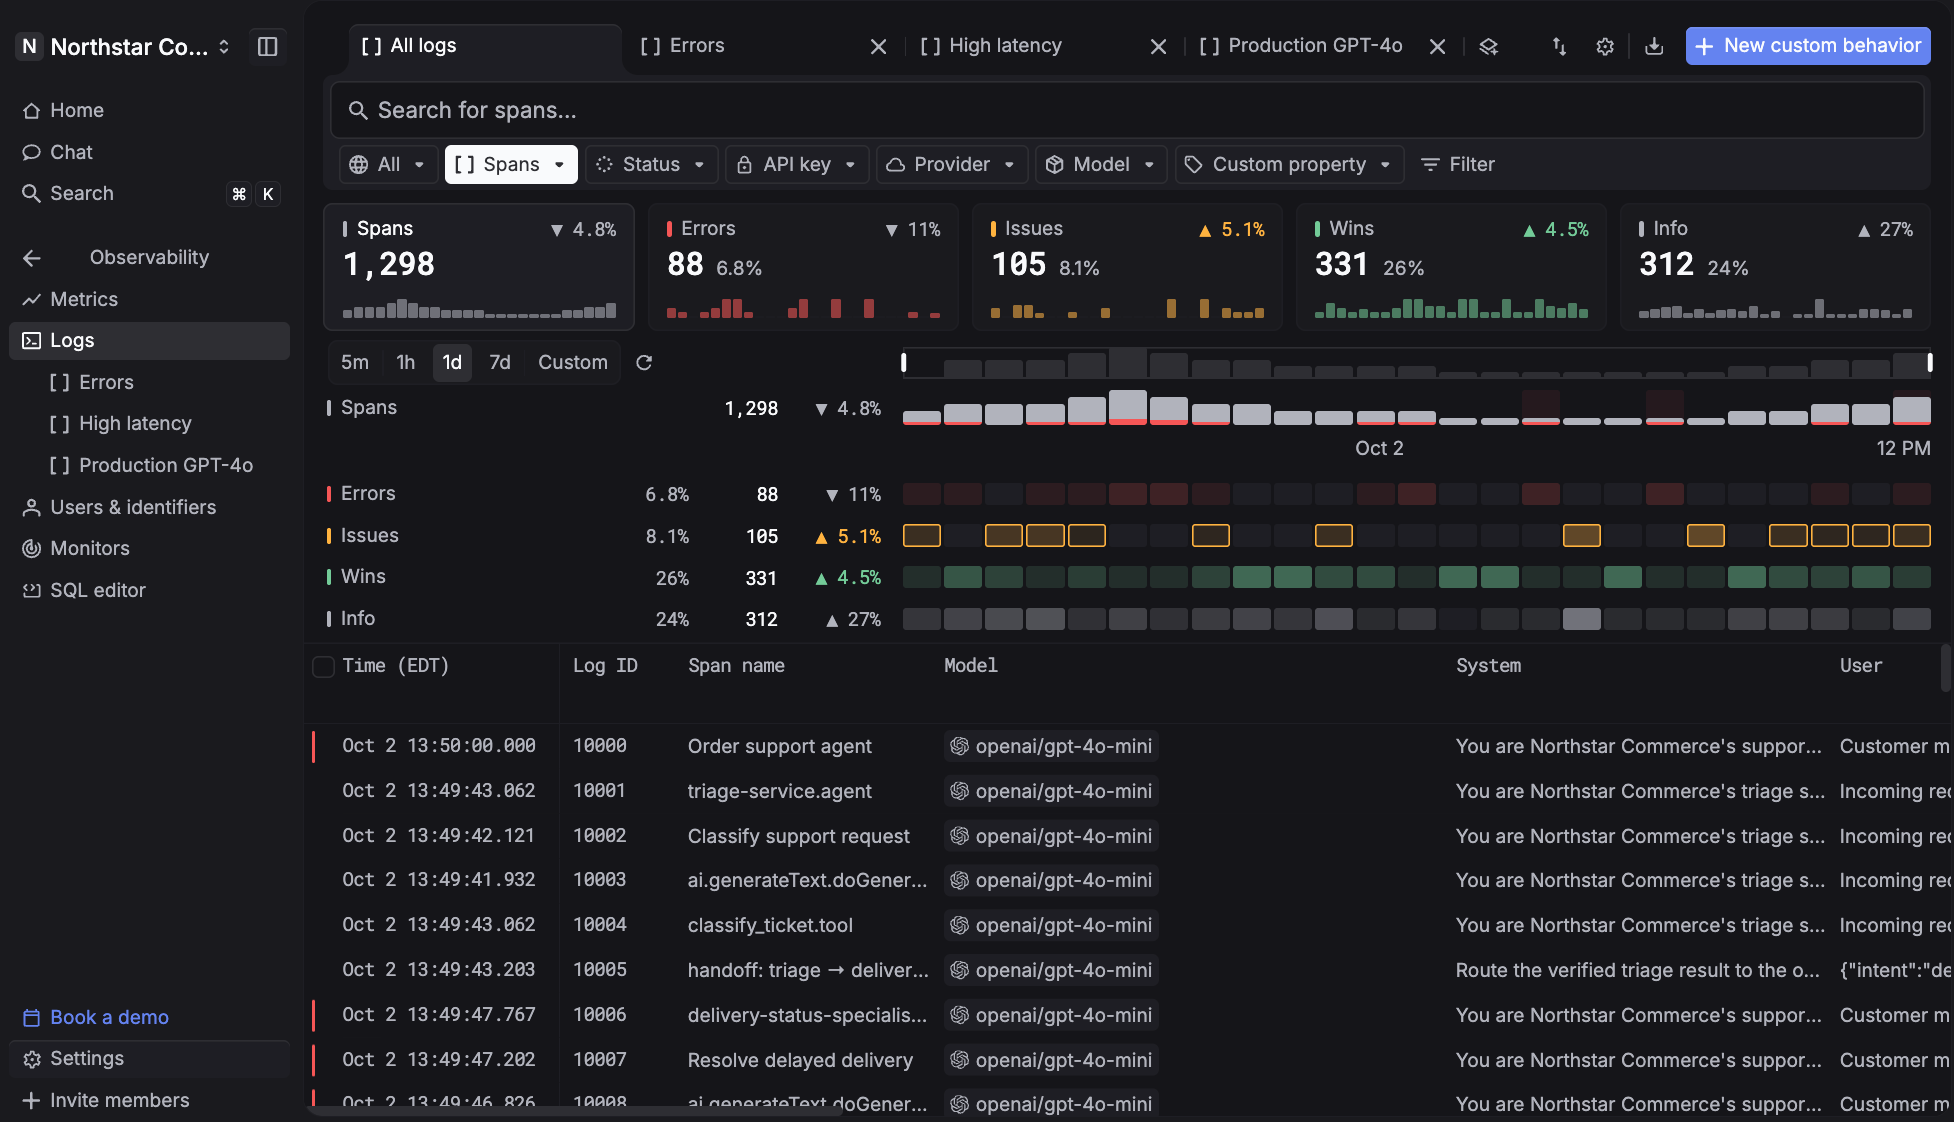
Respan keeps those together. It lets you route, observe, and evaluate every LLM call from one platform, and the observability side is built so the dashboard you chart and the traces you debug run on the same data. The payoff is simple: you know when production shifts, and you act before it spreads.
Here is how it works:
-
Ingest - Send traffic with the Respan SDK or OTLP so every request feeds metrics, logs, and traces at once. Tag requests with metadata like feature, environment, and a customer identifier so you can slice them later.
-
Aggregate - Track requests, tokens, errors, latency, and cost on the dashboard, broken down by model, user, and API key. A cost spike is a chart you can read, not a surprise on the monthly invoice.
-
Save views - Filter logs down to what you care about (production errors, high-cost requests) and save the filter as a view. Nobody rebuilds the same query during the next incident.
-
Monitor - Deploy monitors that watch error rate, cost, latency, or tokens and alert Slack, email, or a webhook on breach. You catch a cost or latency regression that returns a clean 200, which is the class of failure HTTP-only alerts miss entirely.
Because the metrics, views, and monitors all sit on the same traffic, an alert tells you more than that a threshold broke. It carries the value that crossed, the totals for the window, and the top users, API keys, and models behind it, and from the monitor you can open the spans behind each run instead of starting the search from scratch.
Instrumenting takes a few lines on top of the OpenAI SDK you're probably already using. Install the packages and set RESPAN_API_KEY alongside your OpenAI key:
pip install respan-ai respan-instrumentation-openai openaiThen initialize Respan with the OpenAI instrumentor and tag each request:
from openai import OpenAI
from respan import Respan, propagate_attributes
from respan_instrumentation_openai import OpenAIInstrumentor

respan = Respan(instrumentations=[OpenAIInstrumentor()])
client = OpenAI()

def handle_request(user_id: str, question: str) -> str:
    with propagate_attributes(
        customer_identifier=user_id,
        metadata={"feature": "report_summaries", "environment": "production"},
    ):
        response = client.chat.completions.create(
            model="gpt-4.1-nano",
            messages=[{"role": "user", "content": question}],
        )
    return response.choices[0].message.content
The customer_identifier and metadata values are what make the dashboard breakdowns and monitor conditions work. Tag by feature and environment on the way in, and you can slice cost by feature or scope an alert to production later. You can also set both once in Respan(...) as defaults for every span.
Why Teams Run Observability on Respan
Instead of reading logs after the fact, use Respan to run observability in production, know when production shifts, and act before it spreads.
- See requests, tokens, errors, latency, and cost in one place, broken down by model, user, and API key. No stitching three tools together to answer one question.
- Click any score and land on the trace behind it, then build a dataset from the failing runs and test a fix against real data.
- Tag by feature, environment, and user, then slice cost and quality by any of them to find what is actually driving spend.
- Run on SOC 2, ISO 27001, GDPR, and HIPAA with a BAA, with PII masking and omit-logs for requests that shouldn't be stored.
- Instrument through the OpenAI SDK you already use. It is a few lines, not a migration.
Frequently Asked Questions
What's the Best Tool for AI Observability?
The best tool depends on what you need to see. If your AI system is built on LLMs and agents, look for one that traces the full run, scores output on live traffic, and attributes cost by feature and customer. Respan does all of that on one platform, with the gateway that routed each request attached to its trace. Beyond that, AI observability tools range from LLM-native platforms to APM vendors that added an AI tab, and they differ most in whether they can score output at all.
Why Is Observability Critical for AI Workloads?
AI workloads fail in ways that don't register as errors. A model can return a confident wrong answer, a prompt change can double token spend, and an agent can burn dozens of tool calls on a two-step task while uptime looks normal. Observability gives you the traces and scores to catch those failures, and the cost data to see what each one is costing you.
What Is AI Agent Observability?
AI agent observability is tracing and scoring a full agent run, with every planning step, tool call, and model call recorded as one connected trace. Agent failures usually start several steps before the bad output appears, so the value is in seeing the sequence, catching loops and runaway chains, and checking what state crossed each handoff between agents.
AI Observability vs LLM Observability: What's the Difference?
AI observability covers the whole AI system: models, agents, the data and infrastructure they run on, and the governance around them. LLM observability is narrower and focuses on the individual language model call, meaning the prompt, the completion, tokens, latency, and the evals scored against that output. If you build on LLMs, you need both levels, since diagnosing a bad agent run usually comes down to inspecting the individual LLM calls inside its trace.
AI Observability vs ML Observability: What's the Difference?
ML observability grew up around classical models like classifiers and regressors, where you track prediction accuracy, feature drift, and data quality against a ground truth you eventually get back. AI observability for generative systems keeps drift monitoring but adds what classical ML never needed: traces of multi-step runs, token cost, and evals that judge free-text output with no single correct answer. If you run both, ML monitoring can stay on your predictive models while LLM-native tooling covers your agents.