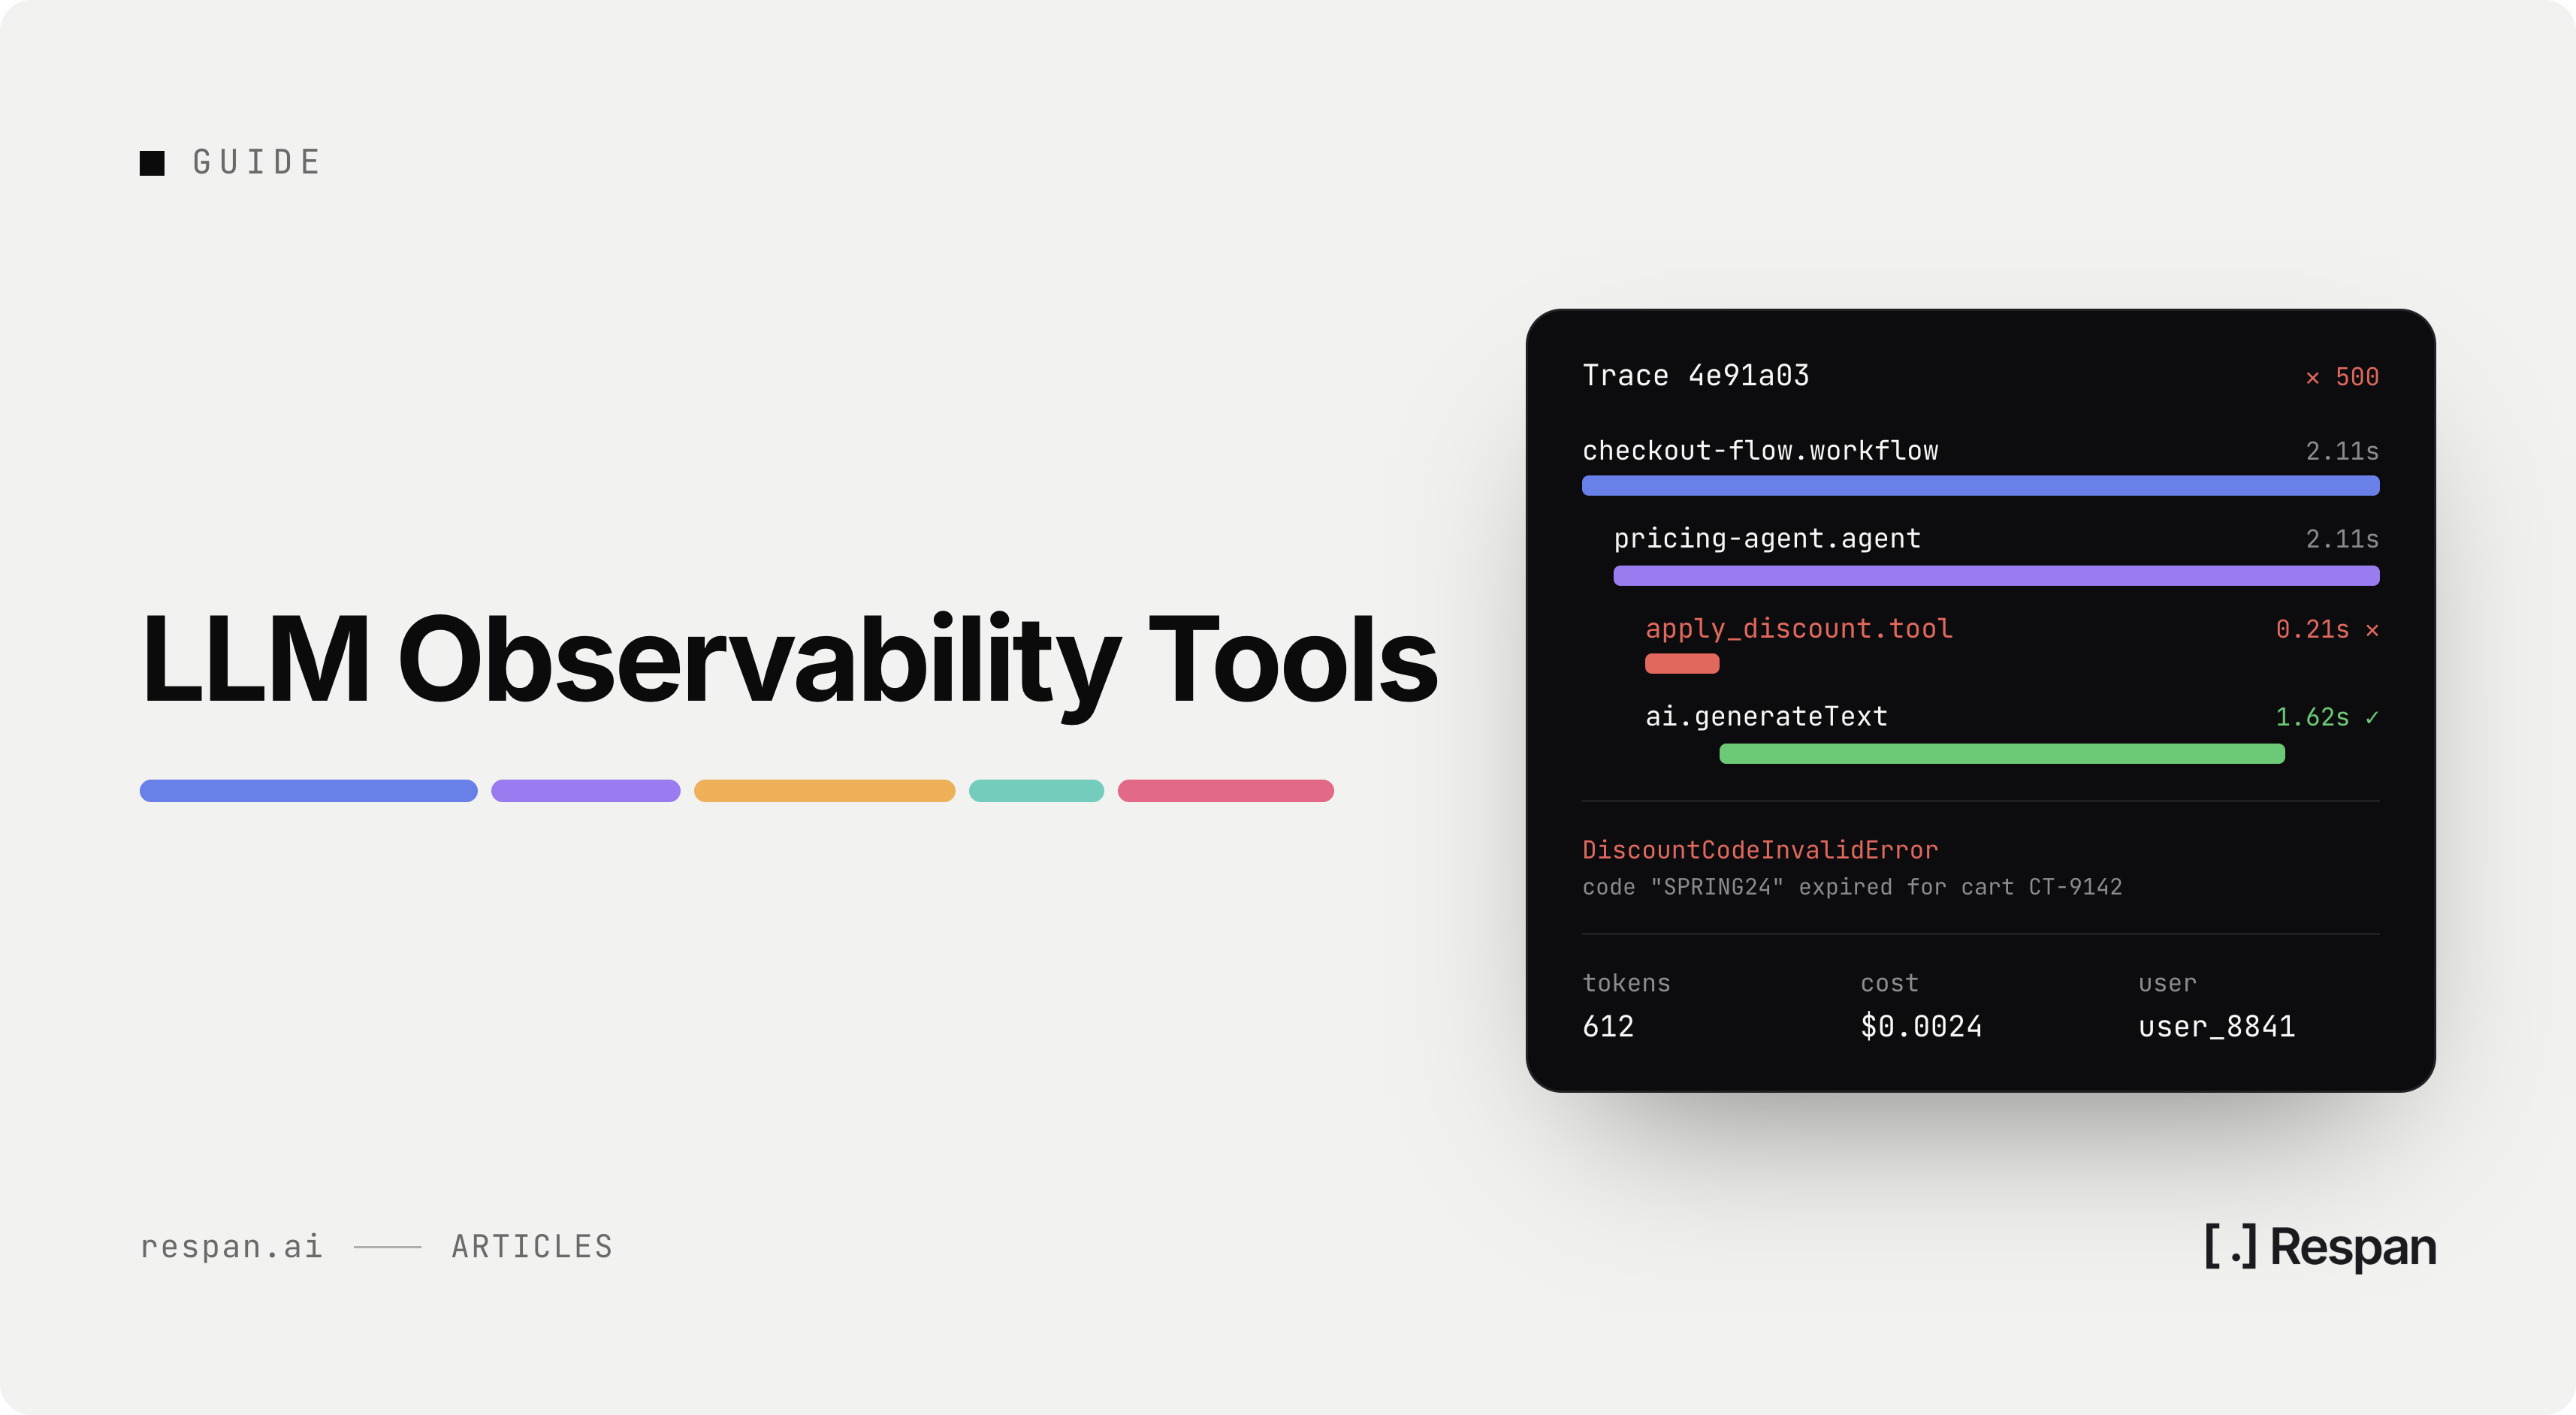
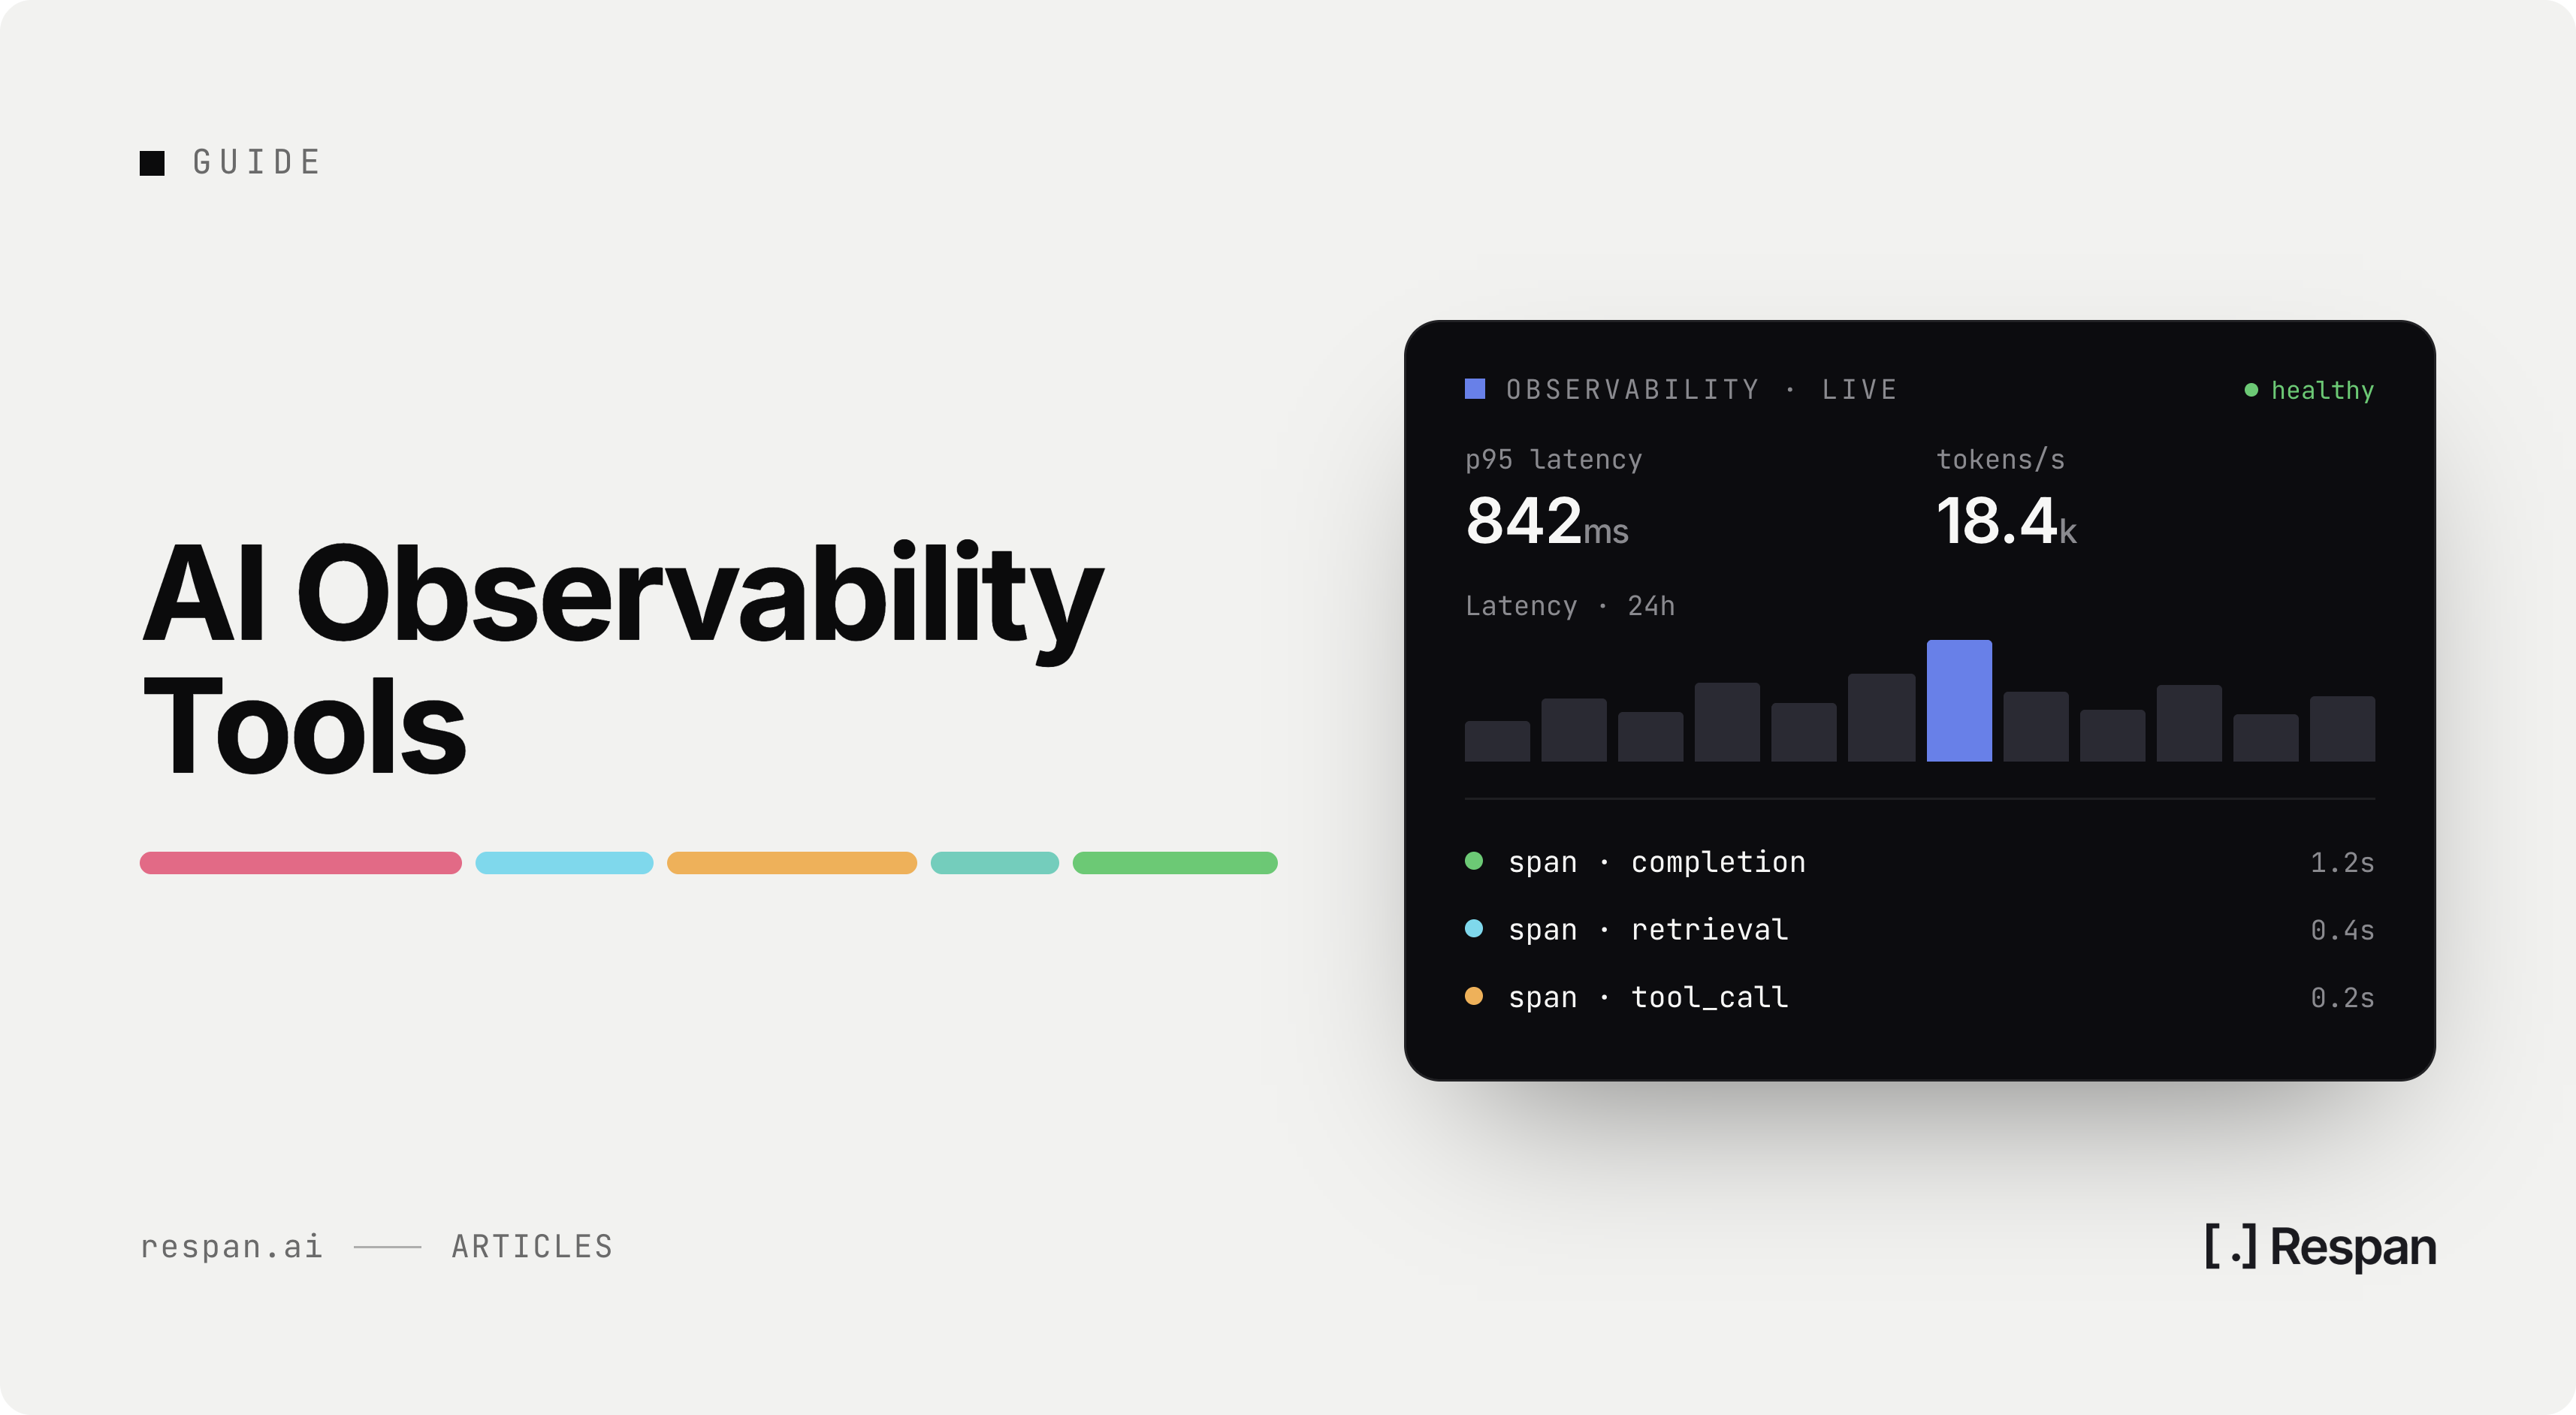
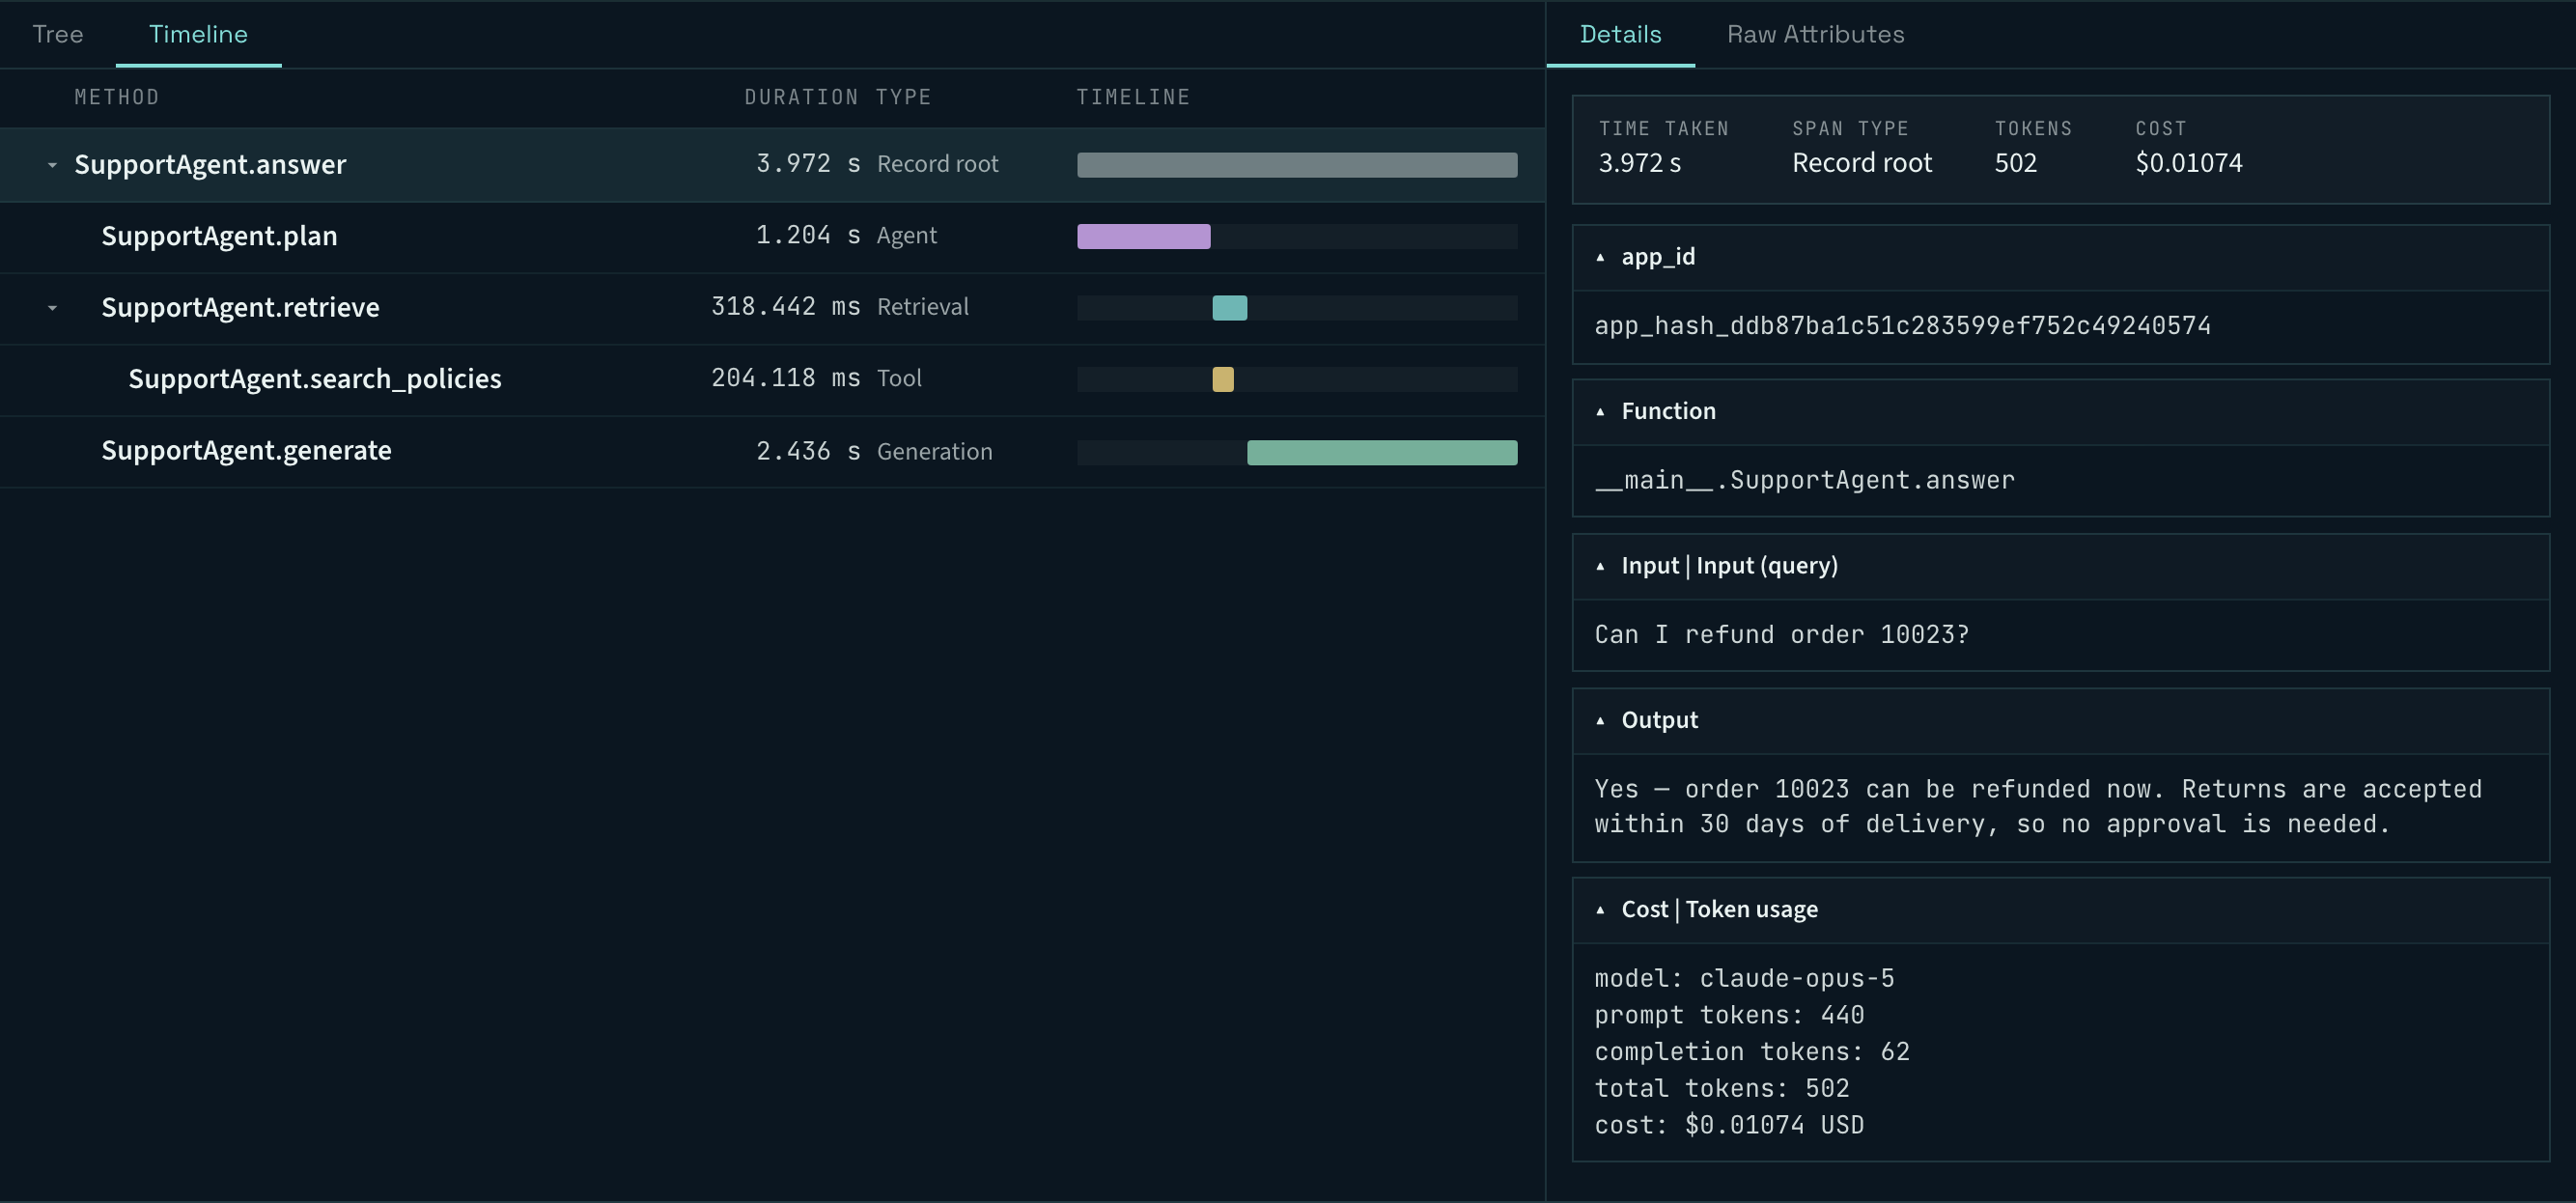
LLM observability is the practice of recording what your models and agents actually did in production, not just whether they responded. Traces of every step, scores on the outputs, and cost attached to both. The category exists because an LLM app can return a 200 and still be wrong, and nothing in a traditional monitoring stack is built to notice.
Choosing between the platforms that do this work is harder than it looks, because they do not all do the same job. Some capture a full agent run down to the tool arguments. Some see requests passing through a proxy and nothing between them. Some score output quality on live traffic, while others only run evals against datasets you assemble by hand.
Those differences are set by where the tool sits in your stack, and that position is fixed on the day you instrument, which makes it the decision worth getting right rather than the pricing page you compared first.
The 9 best LLM observability tools below are compared on how deep each one traces an agent run, what it can score, and what it costs at production volume.
Short answer:Respan is the pick for teams running agents in production. Tracing, evals, prompt versions, and routing sit on one platform, so a bad output traces to the step that caused it instead of being correlated across four tools.
What is LLM observability?
LLM observability is the ability to reconstruct what a model or agent did on any given request, from the input a user sent through every retrieval, tool call, and model call to the output that came back. It differs from traditional observability in what it has to capture, since the thing that failed is usually the content of a response rather than its status code.
What to look for in an LLM observability tool
Nearly every platform here traces, and most of them score. What separates them is how much of an agent run they can see, and that is decided by architecture rather than by feature lists.
Tracing depth for agent runs - The unit that fails in an agent system is the run, not the request. A run that calls retrieval, reasons over the result, calls a second tool, and drafts a reply produces one visible outcome and a dozen internal steps. Request-level logging shows a successful transaction that produced a bad result, and the full tree shows which step introduced the error.
Where the instrumentation sits - A proxy receives HTTP requests, so it reports tokens, latency, and cost per call and never sees the reasoning between two calls. An SDK or OpenTelemetry instrumentation runs inside the application, so it captures tool arguments and retrieved documents. This sets the ceiling on everything else, and it is fixed on the day you instrument.
Evaluation on live traffic - An LLM call can return HTTP 200 in 400ms and invent a refund policy. Latency, error rate, and token count are all fine, and the output is wrong. What matters is whether scoring runs against production spans or only against datasets somebody assembled in advance, because the second kind catches what your test set anticipated and nothing else.
Cost and token attribution - A monthly invoice from a provider gives you nothing actionable. Attribution by model, feature, customer, and prompt version identifies which change doubled spend and when, and it is the metric most likely to move without anyone noticing, since nothing breaks while it does.
OpenTelemetry support and trace portability - OpenTelemetry has GenAI semantic conventions for LLM spans, so instrumentation written once can export to more than one backend. That is the difference between switching platforms in an afternoon and reinstrumenting a codebase, and it matters more than it feels like it should, because most teams choose before they know what their production traffic looks like.
Alerting on quality, not only errors - Alerting inherited from infrastructure monitoring fires on HTTP status and latency thresholds, which are the failures LLM systems are least likely to produce. Monitors on cost, token volume, and evaluation scores matter more, and an alert that arrives with the failing runs attached starts a fix rather than an investigation.
Weight the first two above the rest. Instrumentation position determines how expensive it is to be wrong about this decision later, and tracing depth determines whether the platform can show you the failure that motivated the purchase.
The 9 best LLM observability tools
The list runs from full platforms through OpenTelemetry-native tools to focused specialists, rather than as a ranking, since a debugger and a platform are not competing for the same job.
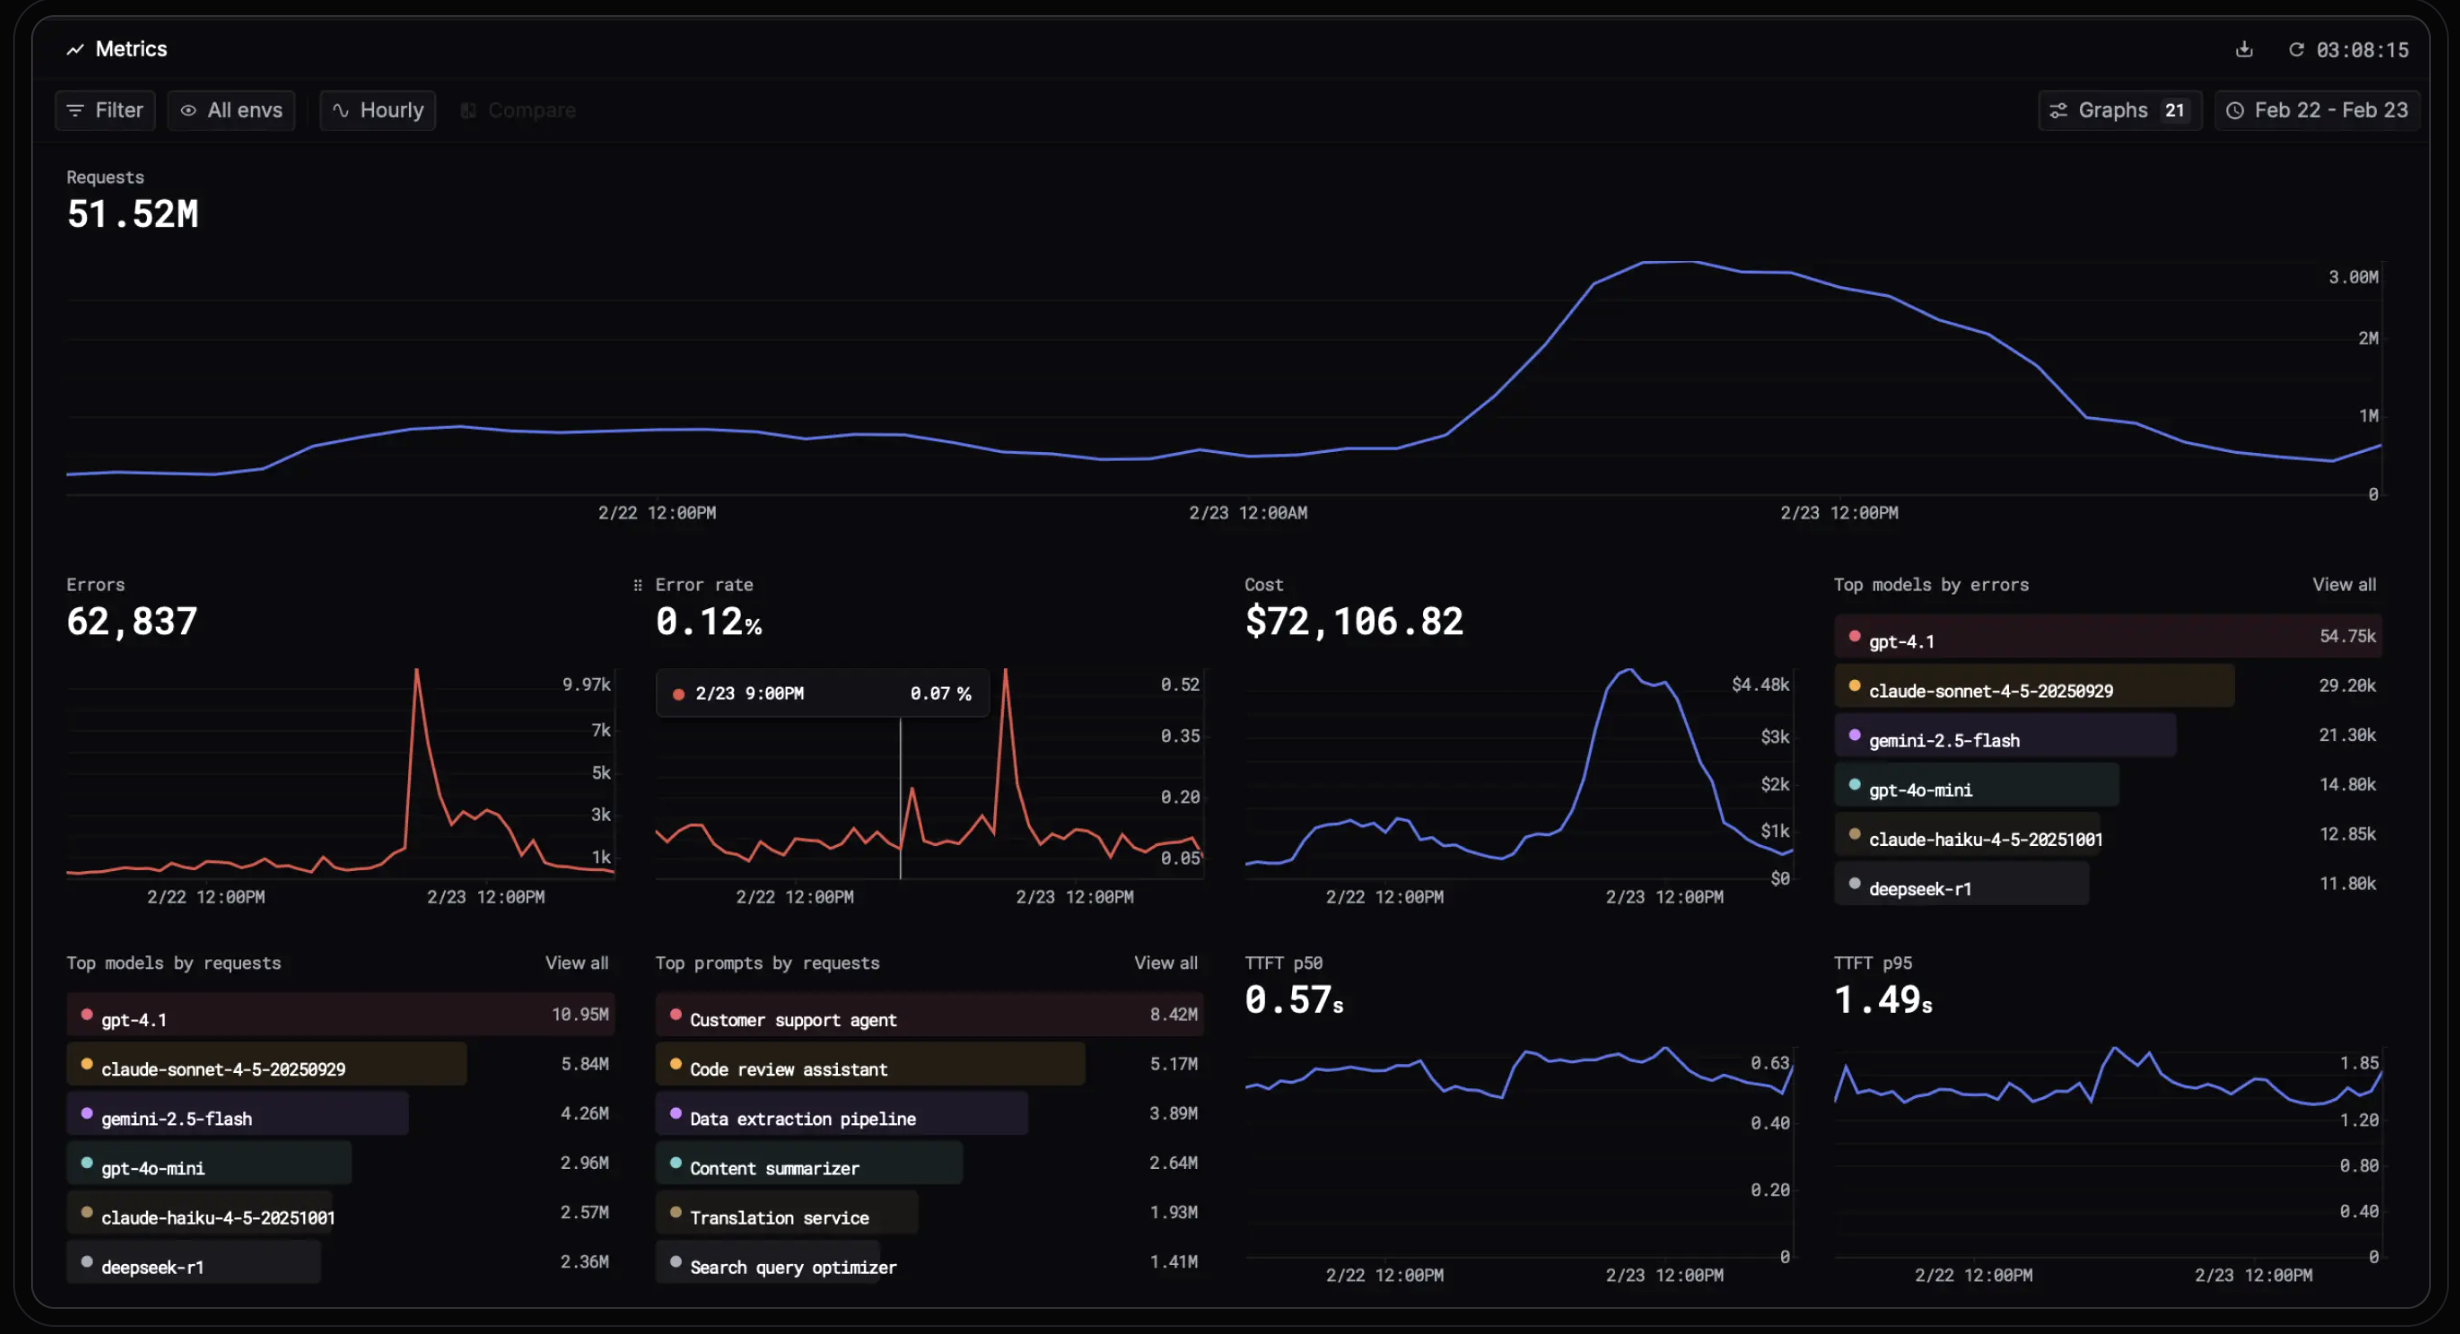
Respan runs tracing, evaluation, prompt management, and model routing on one platform. Route, observe, and evaluate every LLM call. A trace carries the prompt version that produced it and the routing decision that served it, which removes the correlation step that eats most of the time in a multi-tool setup.
What that gets you:
See the whole agent run - Every LLM call, tool run, retrieval, and agent turn becomes a span in one nested trace, each with its own input, output, latency, and cost.
Score quality on live traffic - LLM judges, deterministic code checks, and human review compose into one evaluator, running against sampled production spans filtered by status, customer, or thread.
Know where the money goes - Requests, tokens, errors, latency, and cost broken down by model, user, and API key, with soft warnings and hard caps per key.
Hear it from Respan, not a customer - Monitors watch error rate, cost, latency, or tokens and alert Slack, email, or a webhook on breach, scoped by model, project, environment, or user.
Stay up when a provider fails - The AI gateway routes to 1,000+ models with failover, response caching, and per-key spend limits.
Ship prompts without shipping code - Versioned templates deploy instantly, with the version that served each request attached to its trace.
Tracing: Full agent run as a nested span tree, with evals and routing decisions attached to the same record.
Pricing: Free covers 100k logs, 1k scores, 5 datasets, 2 evaluators, and 7-day retention with unlimited seats. Team is $199 per month billed yearly, lifting scores to 10k and making datasets, evaluators, and prompts unlimited. Enterprise adds custom retention, SAML, and a 99.99% uptime SLA.
Best fit: teams running agents in production who would rather debug one system than four.
Stop guessing why your LLM app broke
See what your agents actually did in one place. Respan traces every prompt, tool call, and response, tracks cost and latency, and runs evals so you can go from a bad output to the exact step that caused it.
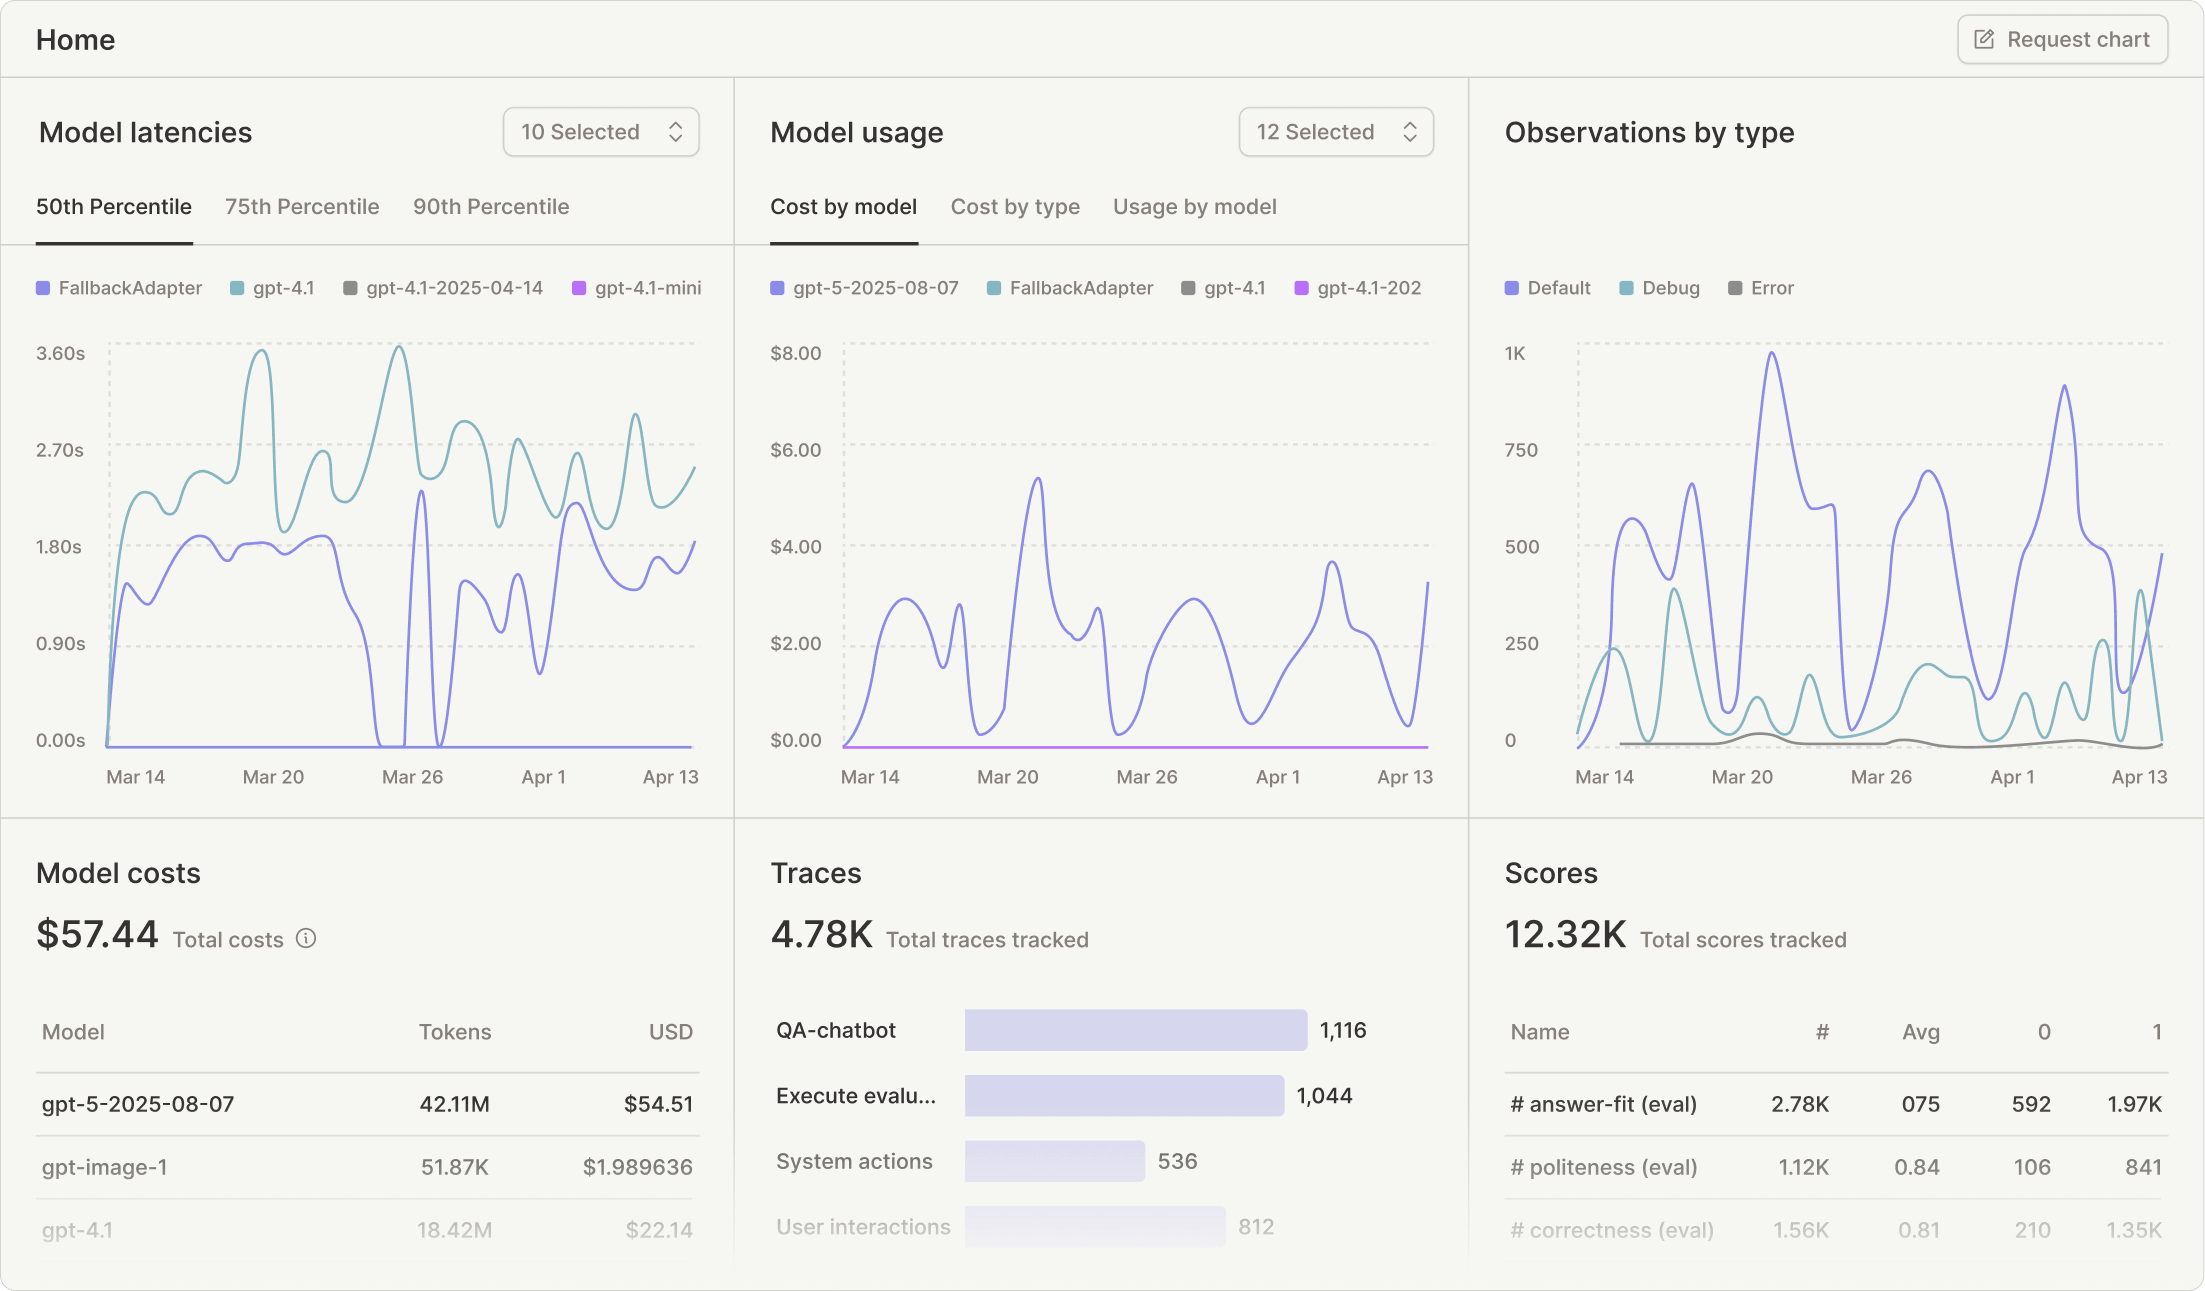
Langfuse is an open-source LLM engineering platform covering tracing, prompt management, datasets, and evaluation, with an MIT-licensed core that runs the whole product on your own infrastructure rather than a limited community build.
The trace model handles deep multi-step runs without struggling, and the meter is unusually clean: a unit is one trace, one observation, or one score, so scoring more of production costs the same as adding a retrieval step. Judges and code evaluators run online against the same observations table production writes to.
Running tools like Langfuse yourself typically means operating Postgres, ClickHouse, Redis, and object storage as separate services. That architecture is what lets it scale, and it is also more to run than a single-binary tool, so if ClickHouse is outside what your team can operate, the constraint puts you on Cloud.
Tracing: Full agent run, span-level, with OpenTelemetry ingest alongside native Python and TypeScript SDKs.
Pricing: Hobby is free with 50k units and 2 users. Core is $29 per month for 100k units and unlimited users. Pro is $199 and Enterprise $2,499, with a $300 Teams add-on carrying SSO and fine-grained RBAC. Overage is $8 per additional 100k units on every paid tier.
Best fit: teams with data residency requirements and the appetite to run the infrastructure.
3. LangSmith
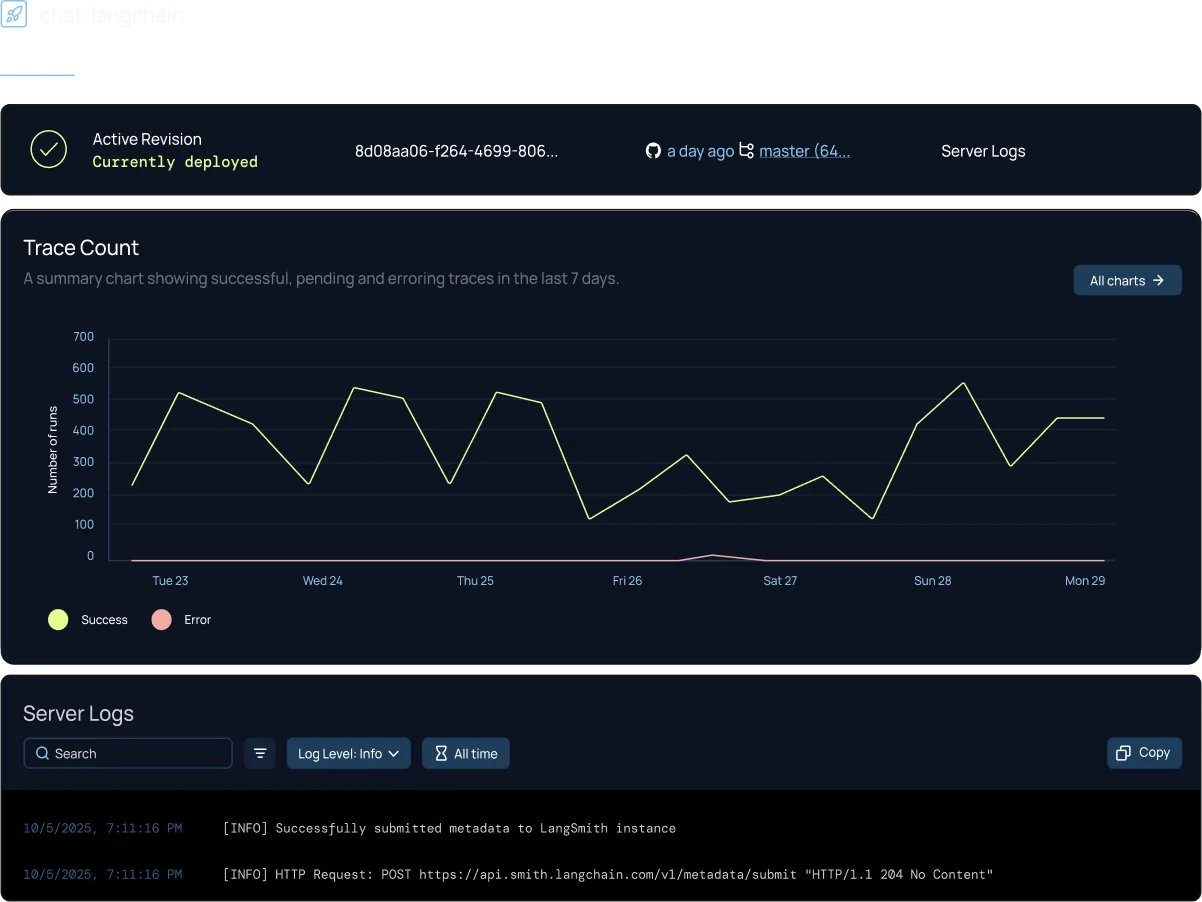
LangSmith ships from the LangChain team and covers tracing, datasets, evaluation, annotation queues, and a prompt hub. For teams on LangGraph it adds a development environment where you visualize the graph, set breakpoints, modify state mid-run, and resume from a checkpoint.
Trace fidelity is highest inside its own ecosystem. LangSmith traces any framework through a traceable wrapper and supports OpenTelemetry, though the detail outside LangChain and LangGraph is noticeably thinner, which makes adopting it a bet on a framework as much as on a platform.
Seats and traces meter separately with tools like LangSmith, so the bill tracks team size independently of usage. At $39 per seat that discourages the cross-functional access that makes annotation queues valuable in the first place, and self-hosting is Enterprise only.
Tracing: Full execution tree including tool selections, retrieved documents, and model parameters. Thinner outside LangChain and LangGraph.
Pricing: Free Developer tier with 5k base traces a month and one seat. Plus is $39 per seat per month with 10k base traces, then $2.50 per 1k, rising to $5.00 per 1k on extended retention. Enterprise is custom.
Best fit: teams whose stack is LangChain today and will still be LangChain in two years.
4. Arize Phoenix
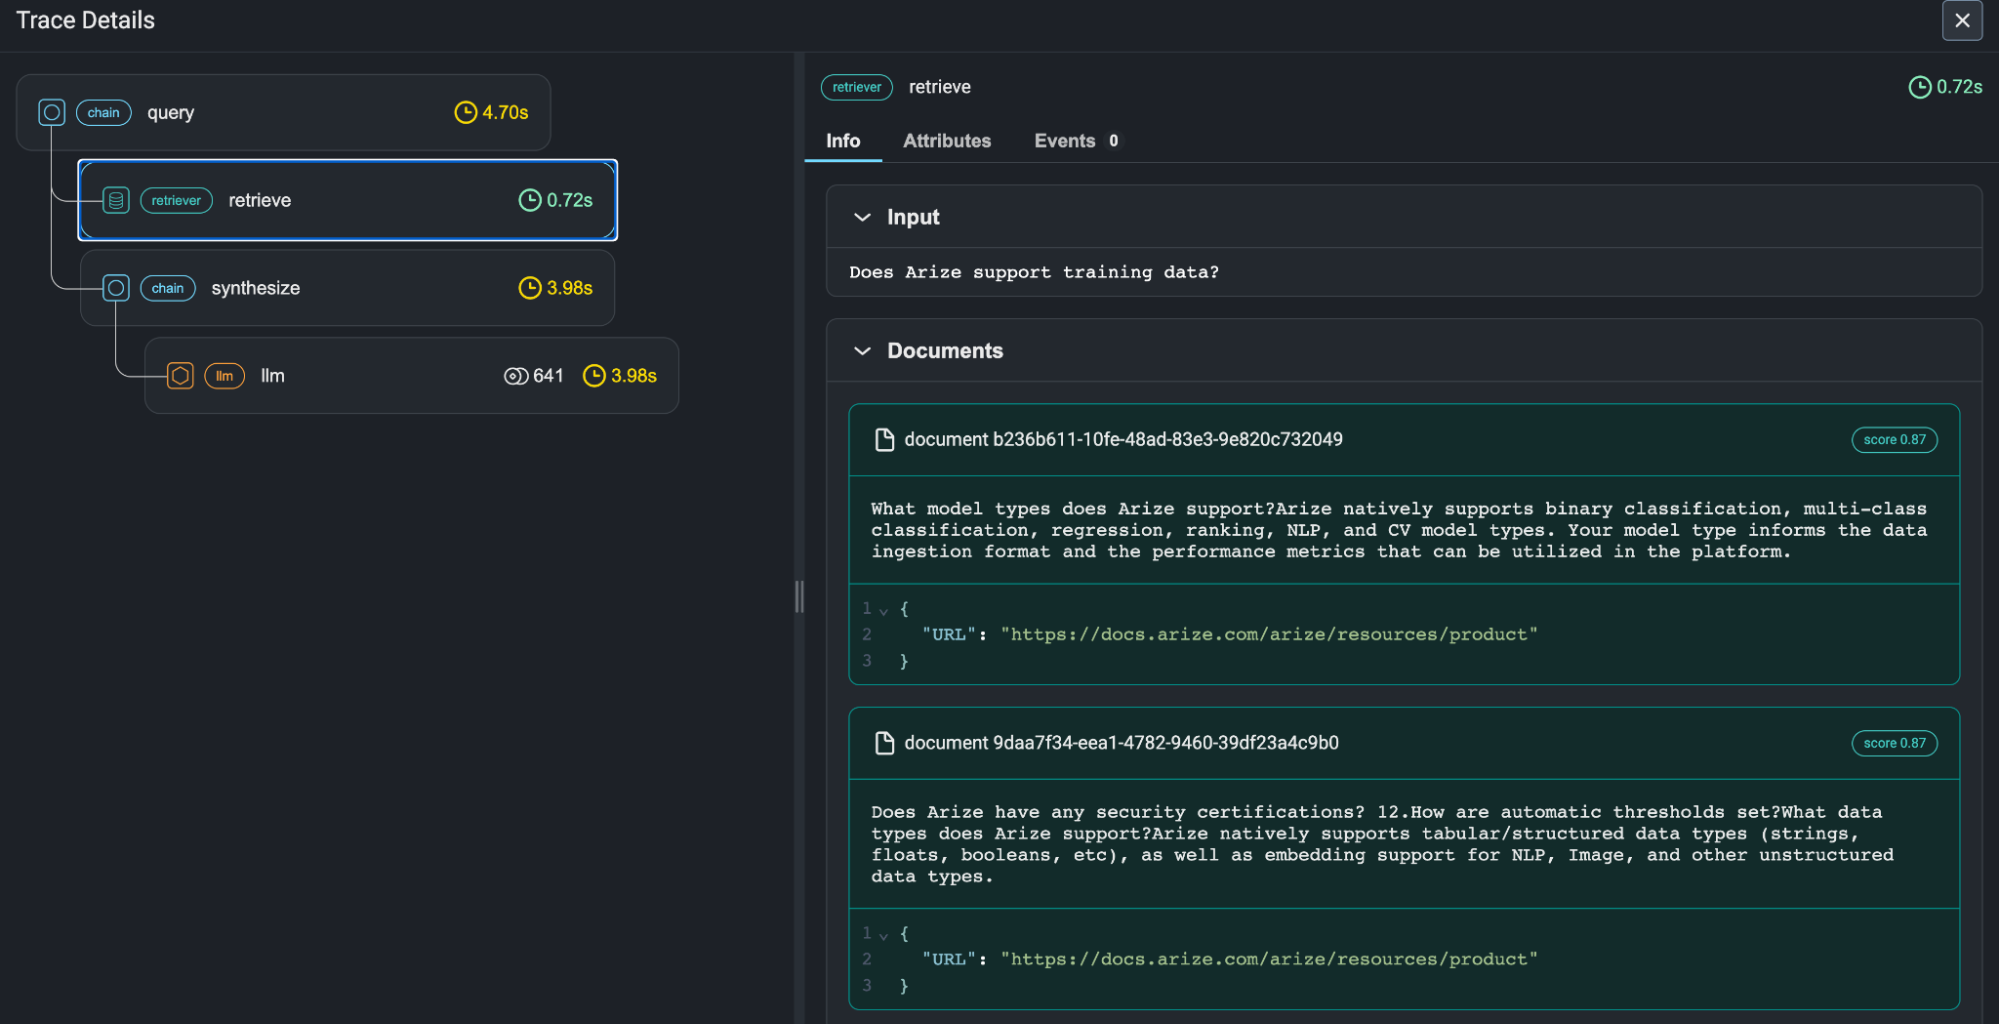
Phoenix is Arize's open-source tracing and evaluation project, built on OpenTelemetry and OpenInference rather than a proprietary trace format. It runs in a notebook, locally, or in Docker with no external dependencies, which makes it usable during development rather than only after deploy.
Because the instrumentation is a published set of OpenTelemetry semantic conventions, the same spans can be exported to another backend later. That portability is the reason to look at it even if you end up somewhere else, and agent trajectory visualization comes with it on the managed side.
The split between the two products decides what you get. Arize AX is the managed platform where production monitoring, longer retention, and orchestration of online evaluators live, and the Phoenix path leaves you downloading spans, scoring them with a pipeline you build, and writing results back yourself.
Tracing: Span-level over OpenInference, with agent trajectory views on AX. Covers LangChain, LlamaIndex, Haystack, DSPy, and others.
Pricing: Phoenix self-hosts free with no usage caps. AX Free covers 25k spans a month and 15-day retention. AX Pro is $50 per month for 50k spans and 10 GB, then $10 per million spans and $3 per GB. Enterprise is custom.
Best fit: teams for whom OpenTelemetry portability is the deciding constraint, or organizations running classical ML alongside LLM workloads.
5. Traceloop
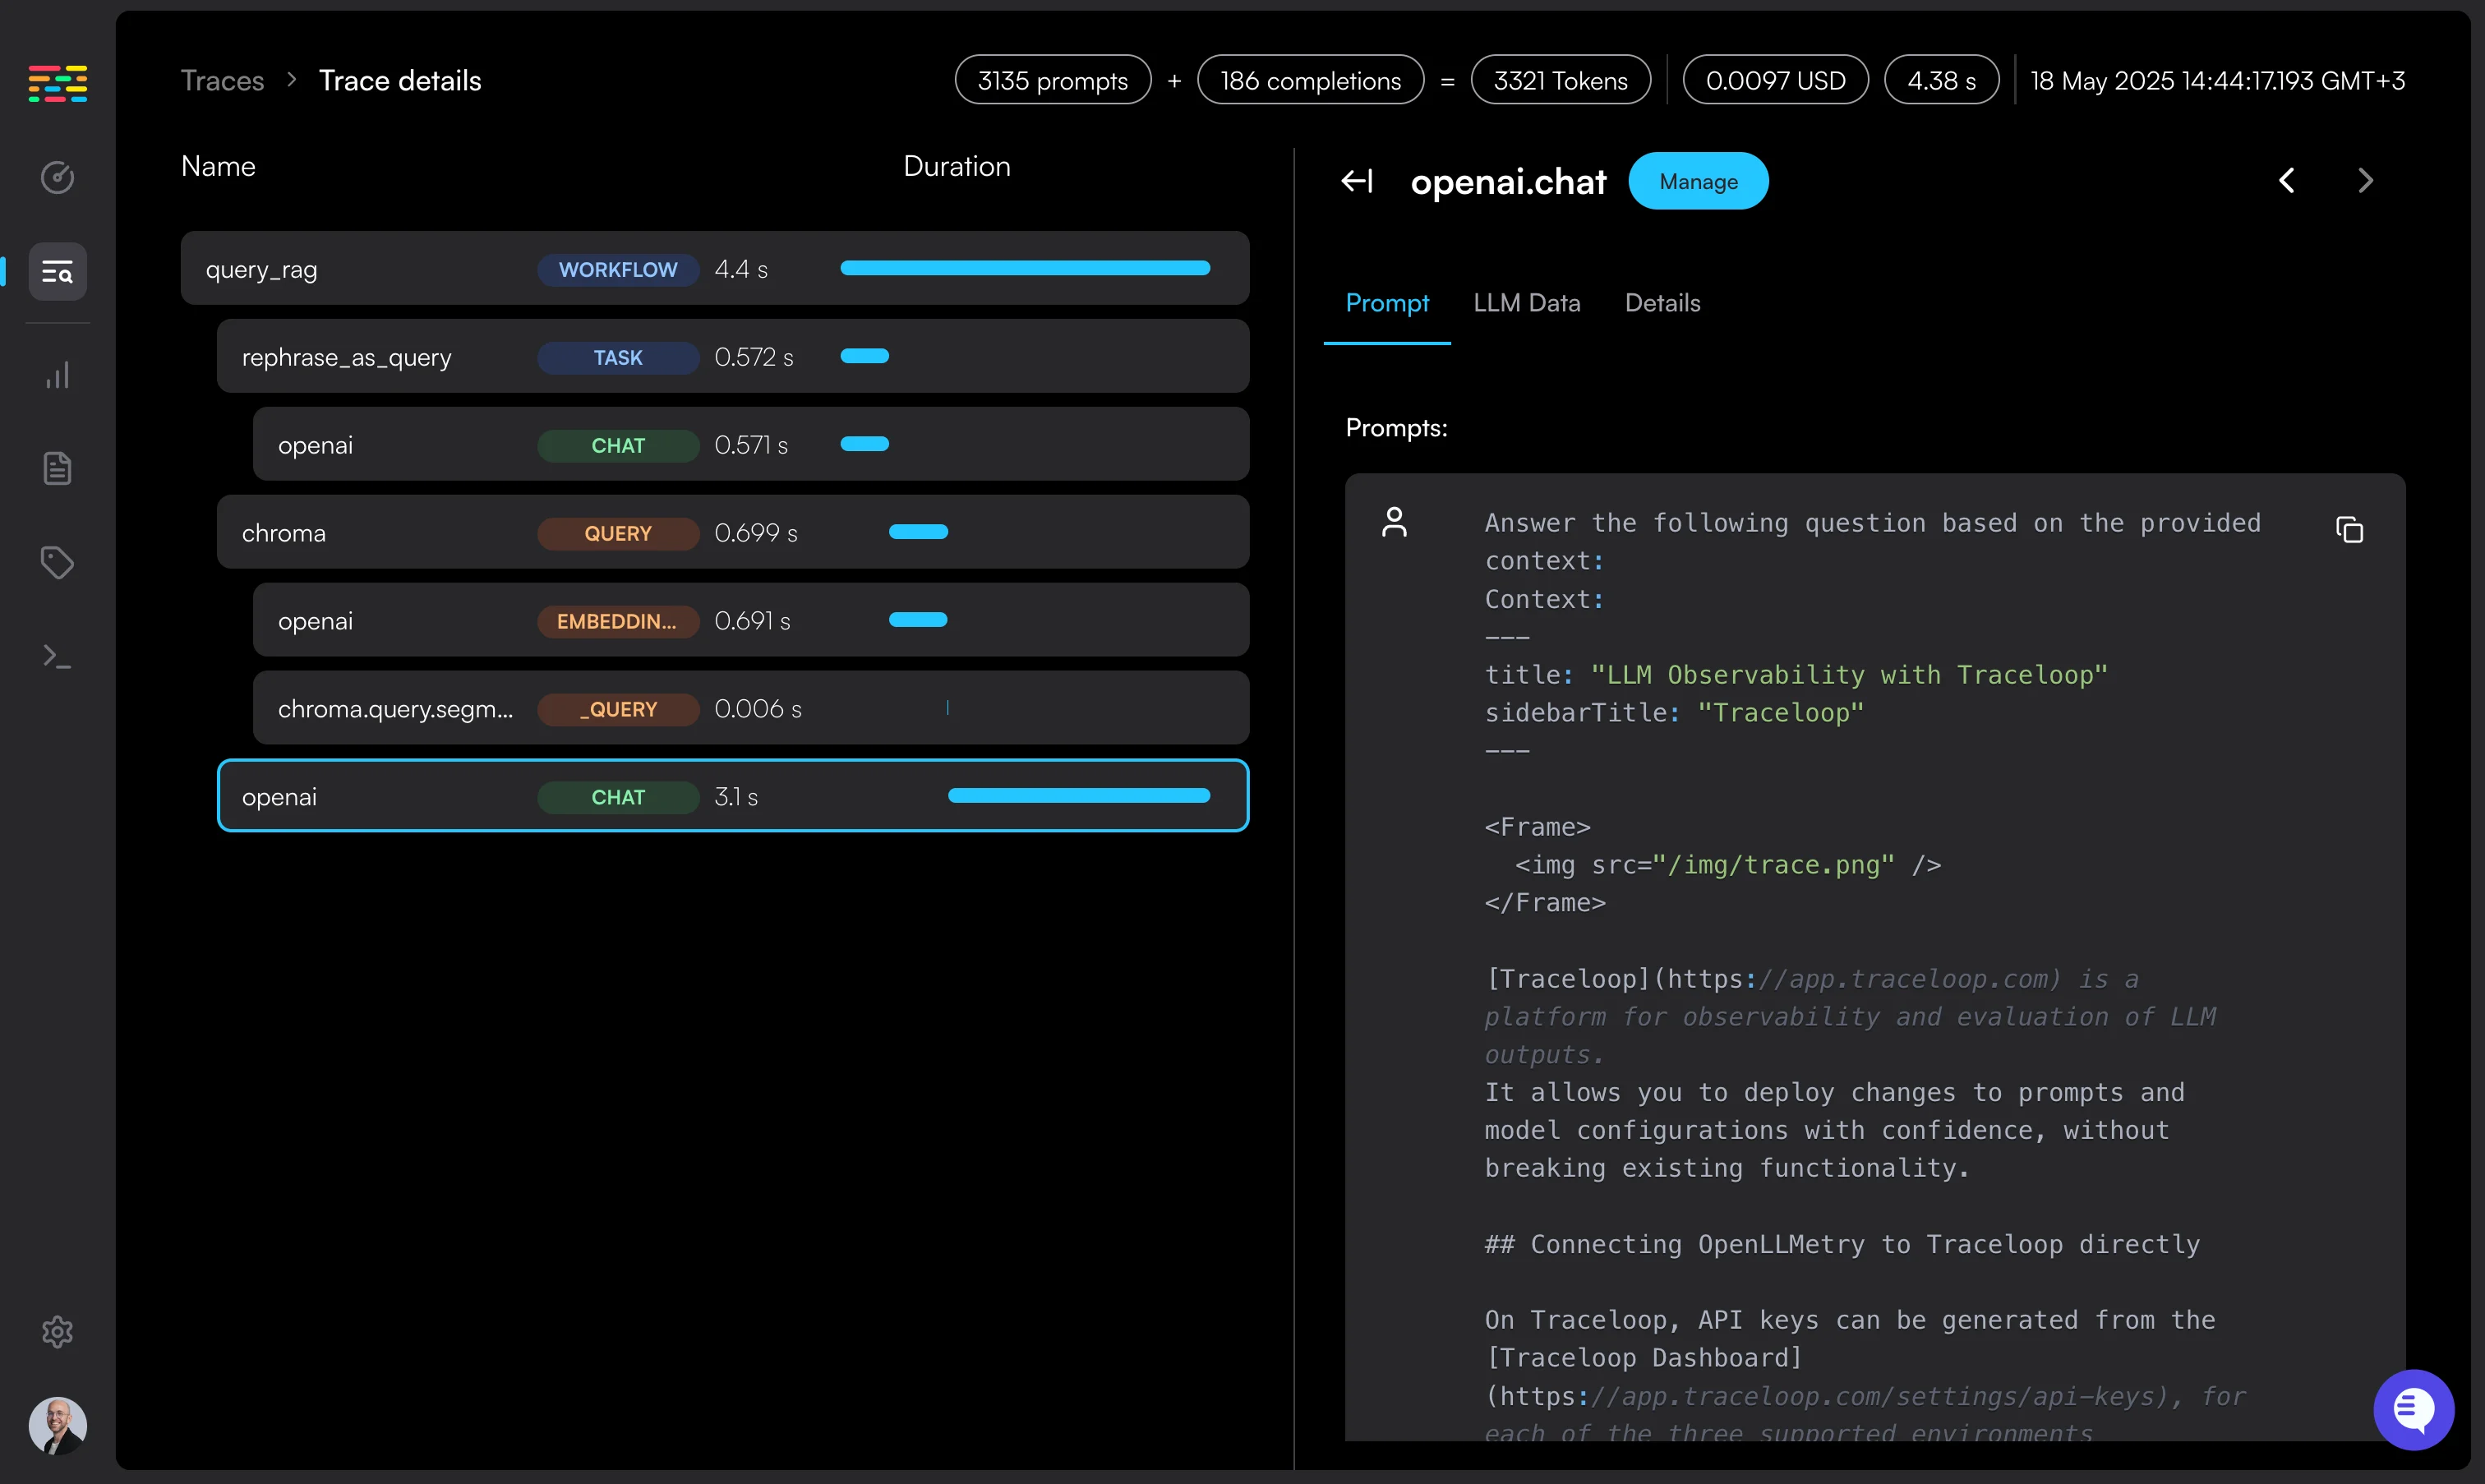
Traceloop is built on OpenLLMetry, its own Apache 2.0 instrumentation layer for OpenTelemetry. Agent runs arrive as standard OTel span trees, which means the same instrumentation can export to another backend without rewriting anything.
Setup is one line through the SDK, or through Traceloop Hub as a proxy in front of your model calls. Both the monitoring and evaluation dashboards are available on the free tier rather than gated behind a paid plan, with built-in evaluators for faithfulness and relevance plus drift detection.
Retention on the free tier is 24 hours, and that interacts badly with alerting. An alert firing overnight points at runs that no longer exist by the time anyone opens it, which pushes serious production use onto Enterprise, where retention is custom and pricing is a conversation.
Tracing: Standard OpenTelemetry span tree, portable to other backends by design.
Pricing: Free to 50K spans per month with 24-hour retention. Enterprise is quoted and includes SOC 2 and an on-premise option.
Best fit: teams committed to OpenTelemetry who want instrumentation they can point somewhere else later.
6. Opik
Opik is Comet's Apache 2.0 platform for tracing and evaluation, and the open-source build runs the same codebase as the hosted product rather than a stripped core with the useful parts held back.
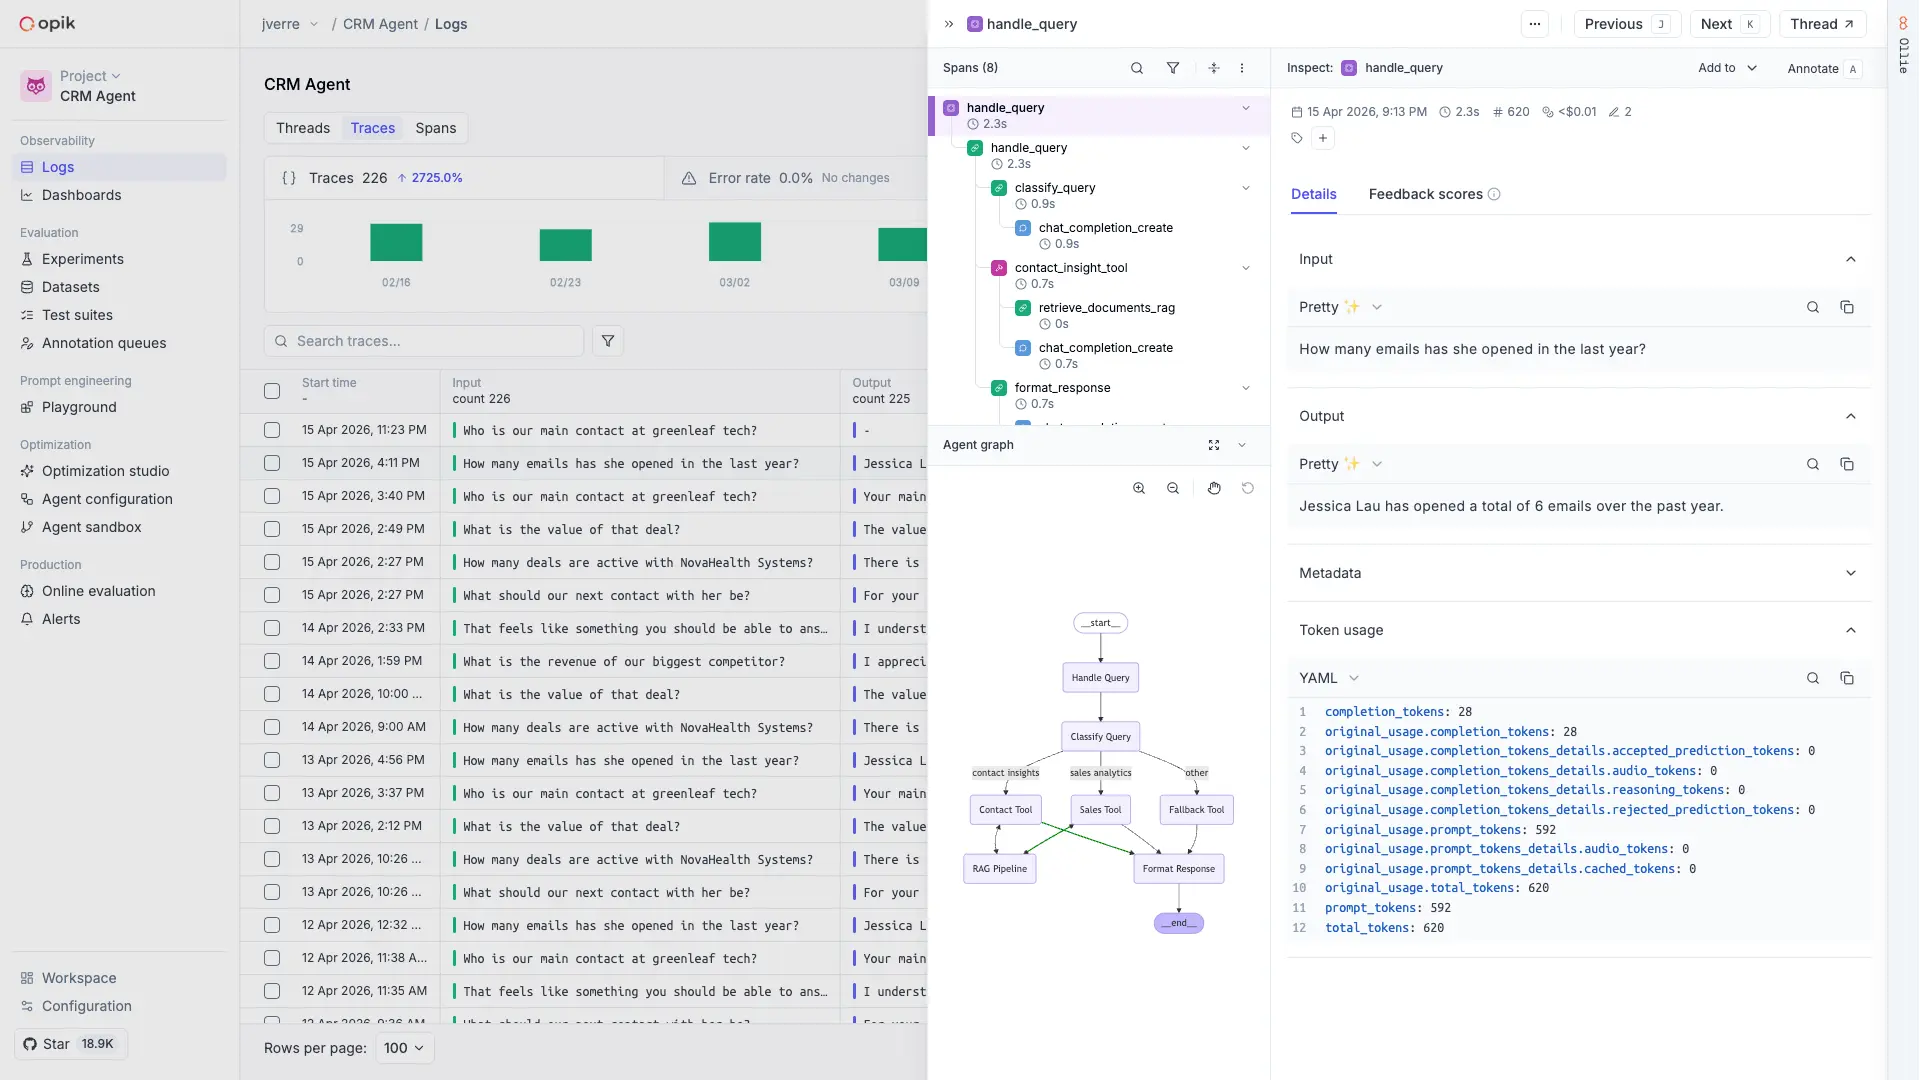
Agent execution graphs are the distinctive part of the trace model, rendering a run as a structure rather than a list of spans. Evaluation rules run on production traces with results stored alongside them, and scoring meters against spans rather than on a separate meter, so checking more of production stays cheap.
It sits inside Comet's broader platform alongside experiment tracking and a model registry, which assumes an ML lifecycle you may not have. Guardrails are available on the self-hosted open-source build rather than the cloud tiers, so wanting both guardrails and managed hosting means picking one.
Tracing: Span-level with agent execution graphs, 60-day retention on the free tier.
Pricing: Free Cloud covers 10 team members, 25,000 spans a month, and 60-day retention. Pro is $19 a month for up to 50 members and 100,000 spans, with additional spans at $5 per 100,000. Enterprise adds unlimited members, SSO, and RBAC.
Best fit: mid-sized teams that want a genuinely open core and cheap span volume.
7. Laminar
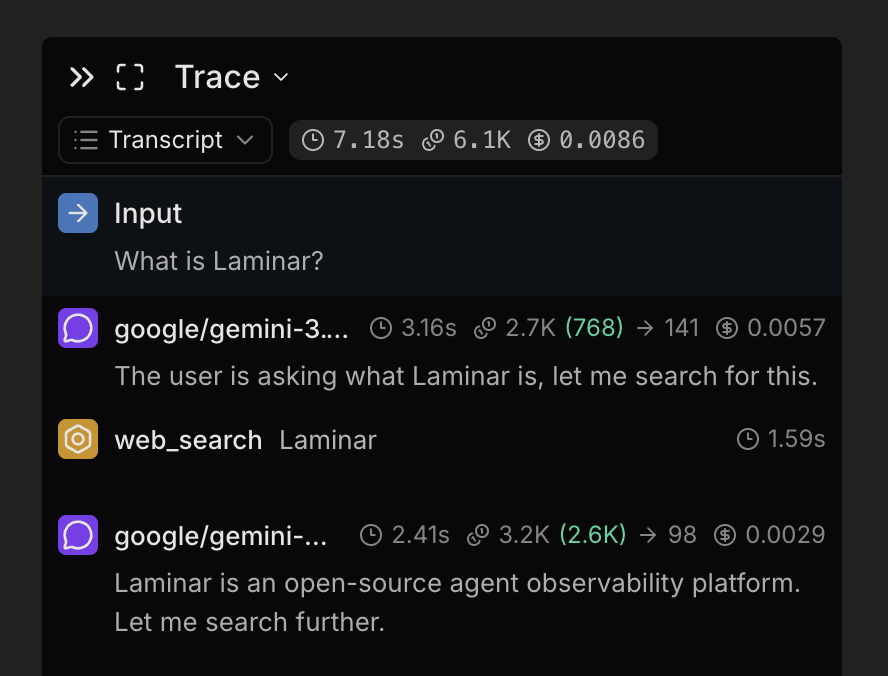
Laminar is a debugger and observability platform built around a storage problem. Agents re-send the whole conversation every turn, so it stores each unique message once and reconstructs the trace on read.
Signals is the more interesting capability for reading agent behavior. A plain-language prompt runs against every trace, produces structured events when it matches, and clusters them, so ten thousand runs collapse into the handful of behaviors your agent actually has.
Prompt management is the gap, and Laminar says so directly rather than implying otherwise. Teams moving from a full platform keep prompts somewhere else, which leaves the loop split across two systems.
Tracing: Span-level with deduplicated message storage and SQL access to the underlying data.
Pricing: Free covers 1 GB with no overage, $5 in Signals credits, 7-day retention, one project and one seat. Starter is $30 per month for 3 GB then $2 per GB. Pro is $150 for 10 GB then $1.50 per GB with 6-month retention. Apache 2.0 and free to self-host via Helm.
Best fit: teams debugging long agent runs who want the storage cost to track unique content rather than turn count.
8. AgentOps
AgentOps organizes everything around the session rather than the request, which is the right shape for agent work and rarer than it should be.
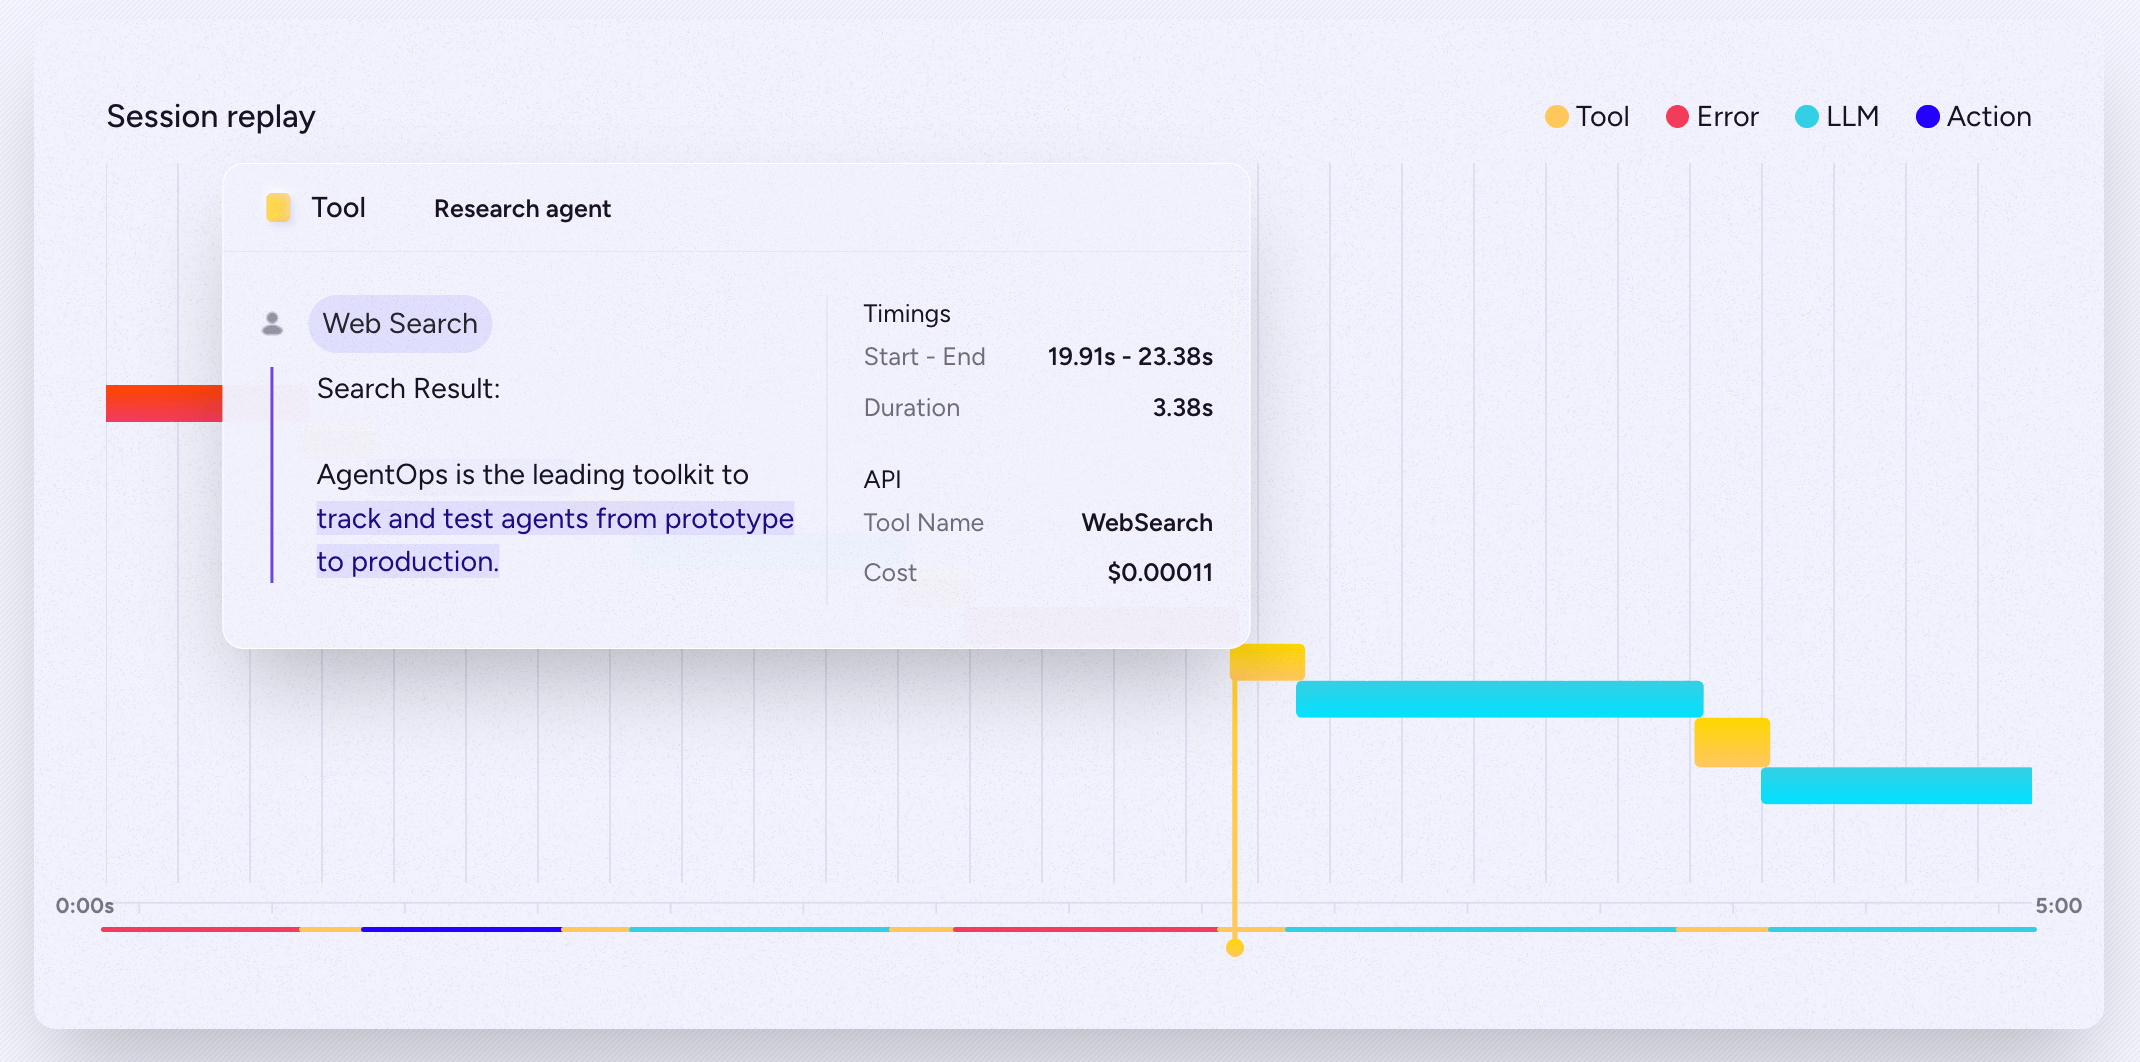
A session captures every LLM call, tool invocation, and step from start to finish, and replay walks the run chronologically. You watch where the agent went wrong instead of inferring it from a span list, which is a different reading experience from a trace tree and a better one for a long run.
Monitoring here is something you go and look at rather than something that reaches you, since there is no documented alerting or monitor configuration. For development-phase debugging that is a reasonable trade, and for a production agent that needs to page someone at 2am it is a gap you fill elsewhere.
Tracing: Session-level replay covering every call, tool invocation, and step in order.
Pricing: $40 per seat per month, plus $0.10 per 1K spans after the first 100K, plus $0.20 per 1M LLM tokens. Three meters accrue independently, so a small team at high volume and a large team at low volume land in very different places.
Best fit: framework-native teams who want session replay during development.
9. TruLens
TruLens is a library rather than a platform. It instruments an application with feedback functions that score outputs as they flow through it, then aggregates results into a leaderboard for comparing app versions.
Instrumentation is OpenTelemetry-based, so spans cover LLM generations, retrievals, and tool calls, and a Selector API targets any span attribute for scoring rather than only the final output. That granularity is unusual and it is the reason to reach for it on a retrieval-heavy system.
Being a library sets the boundary. Retention, alerting, and access control are your own infrastructure, and the project is maintained inside the Snowflake ecosystem, so production monitoring at scale means building around it or arriving through a Snowflake account.
Tracing: OpenTelemetry spans with selector-based targeting of any span attribute.
Pricing: The library is free, and no standalone pricing exists.
Best fit: teams scoring retrieval pipelines who want span-attribute targeting and already have somewhere to put the results.
How to choose an LLM observability tool
Most teams compare features first and discover the constraints later, which wastes an evaluation cycle. Reverse it, because constraints eliminate whole categories in one pass and what survives is usually a shortlist of two or three.
Start with what disqualifies, not what appeals. Data residency, required certifications, and deployment model rule out options before any feature enters the conversation. If traces cannot leave your infrastructure, the remaining decision is a different one.
Decide whether you need a platform or a library. TruLens produces scores and leaves storage, retention, and alerting to you. That is a reasonable trade during development and a project once traffic is real.
Check where the instrumentation sits before trusting the feature list. A proxy cannot report reasoning it never receives. Match the position to the depth you need, then compare products within that group.
Weight portability higher than it feels worth today. Most teams choose before they know what production traffic looks like, so being wrong is likely and the cost of being wrong is the real variable. OpenTelemetry instrumentation makes a change of mind cheap.
Decide whether routing belongs in scope. Running one provider makes this irrelevant. Running several means the record of which model served a request and the record of how it performed will either live together or be correlated by hand during every incident.
Model cost at the volume you expect, not the volume you have. Per-seat, per-span, per-GB, and per-trace pricing diverge sharply at scale, and the cheapest option at pilot volume is frequently the most expensive one a year later.
Whichever way that lands, run a pilot on real production traffic before committing. Instrumentation effort, trace fidelity, and cost at volume are all difficult to judge from a pricing page, and every platform here looks equally capable in a demo.
Stop guessing why your LLM app broke
An agent completes twelve steps, returns a wrong answer, and every span is green. Respan gives you the full run, evaluation on live traffic, and cost attribution down to the feature, so a bad output traces to the step that caused it. Free to start.
Platforms that capture, monitor, and evaluate what LLM applications and agents do in production. They differ from application monitoring by recording agent-shaped telemetry, meaning full traces of multi-step runs including tool calls and retrieved context, and by scoring output quality rather than only operational metrics.
How is LLM observability different from AI observability?
In practice the terms are used interchangeably. AI observability is the broader label and gets applied to model monitoring and data pipeline work too, while LLM observability is the subset aimed at applications built on language models and agents. For teams shipping agents, the relevant platforms are the ones built for agent-shaped traffic rather than the data-pipeline tools that also use the phrase.
How is LLM observability different from APM?
APM monitors infrastructure: latency, error rates, throughput, resource use. LLM observability monitors what the system produced. A model can return a 200 response in 50ms and still invent a policy, and evaluating that requires scoring response content, which APM was never built to do. Teams already on an APM stack usually keep it for infrastructure and add a platform that scores output quality.
Which LLM observability tools are open source?
Langfuse has an MIT core, Opik and Laminar are Apache 2.0, Traceloop's OpenLLMetry instrumentation layer is Apache 2.0, Arize Phoenix is under Elastic License 2.0, and TruLens is a free open-source library. Open source generally means owning the trace data and building the retention, alerting, and access control around it yourself.
What is the best free LLM observability tool?
Respan covers 100k logs, 1k scores, datasets, evaluators, and monitors at no cost with unlimited seats, which is enough to run online evals against real traffic rather than a demo. Opik's free tier is generous on retention at 60 days, Langfuse is free to self-host under MIT if you are willing to run the infrastructure, and Traceloop's free tier includes the dashboards but retains data for 24 hours, which is short for investigating anything that happened overnight.
Which LLM observability tool is cheapest?
It depends on whether you are paying in money or in operations. Self-hosting Langfuse, Opik, or Laminar costs nothing in licensing and whatever the infrastructure and engineering time cost. Among managed platforms, Respan starts free and meters logs and scores rather than seats, which matters because seat-based pricing on LangSmith at $39 per user meters your team size instead of your traffic.
Do I need a gateway as well as an observability tool?
If you run more than one provider, yes, and the question is whether it is a separate purchase. A gateway handles failover, caching, and spend limits, and it sees requests passing through it rather than the reasoning inside an agent run. Most tools on this list leave that job to another product, which means the record of which model served a request sits apart from the record of how that request performed. Respan runs both on one platform, so the two are one record.
Can I switch tools later?
Usually, and the cost depends on how much you built against proprietary interfaces. Instrumentation written against OpenTelemetry GenAI conventions is portable, which is the case for Traceloop, Arize Phoenix, TruLens, and Langfuse's OTel path. Proprietary SDKs, platform-native evaluator definitions, and prompts stored inside a vendor's system are what actually take time.
What should I monitor first?
Cost per feature, latency at p95, and error rate give you a baseline in an afternoon, and a baseline is what makes any threshold meaningful. Add evaluation on production traffic once normal looks recognizable enough to interpret, then alerts after that. Teams that configure alerts before they have a baseline mostly configure noise and mute it within a week.