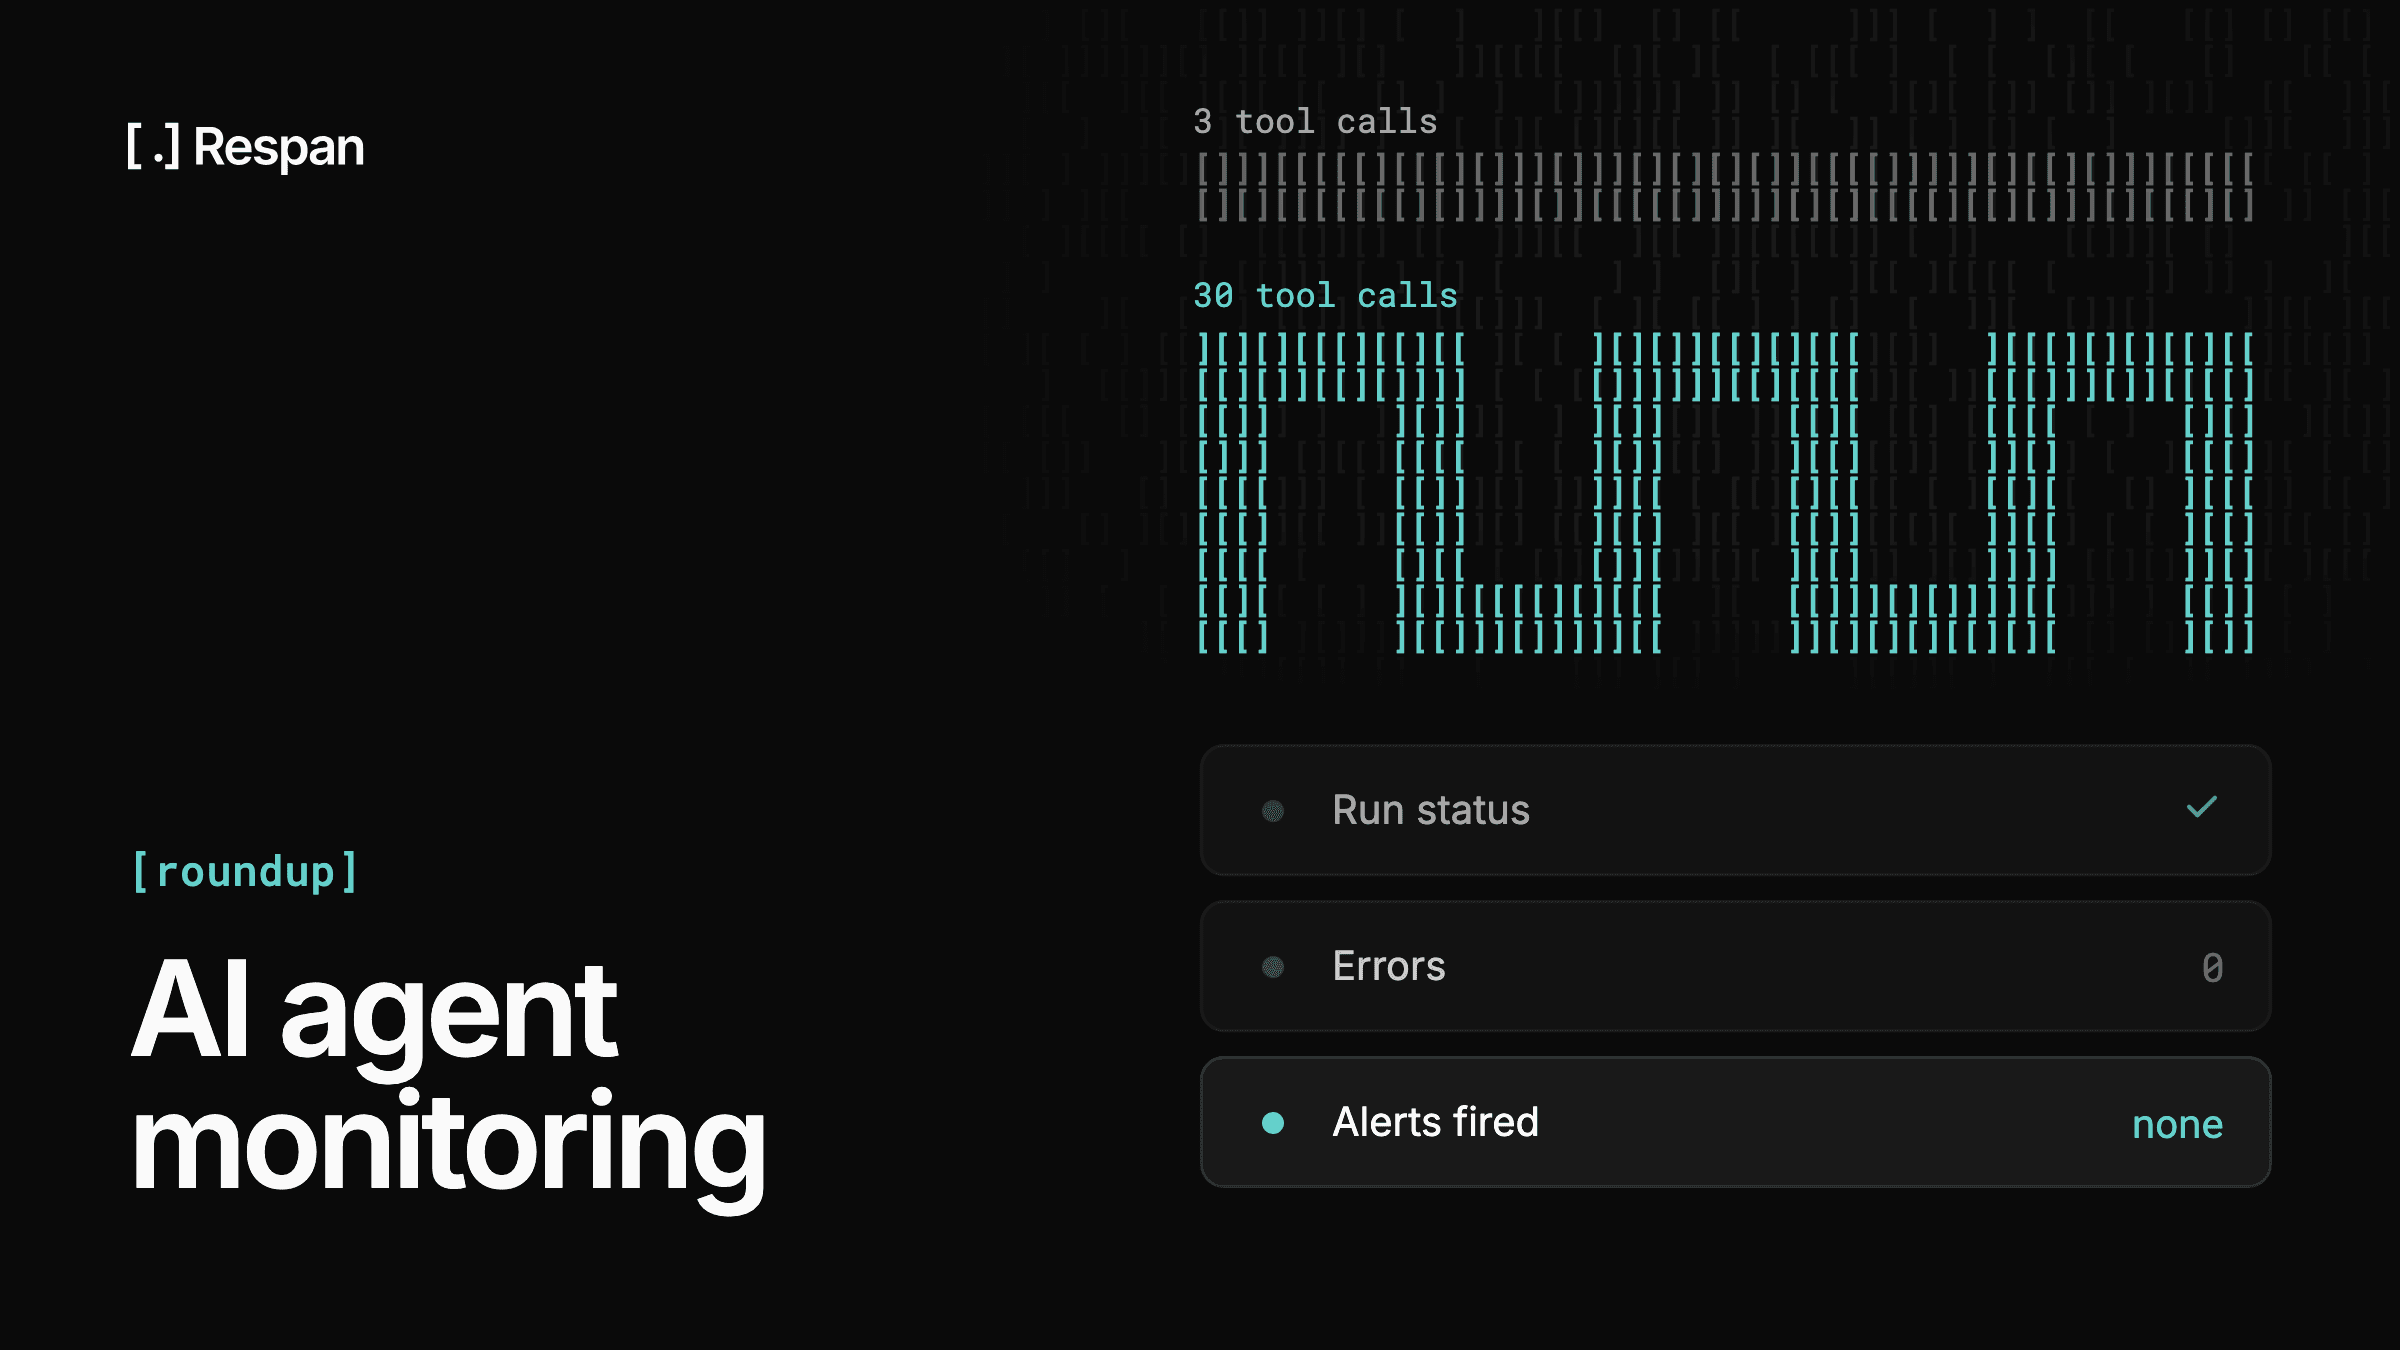
An agent that should finish a task in three tool calls and finishes it in thirty still finishes it. Latency climbs, the token bill climbs, and the run returns something the user can work with. Nothing errored, so nothing fired.
That gap between "the system is up" and "the agent did its job" is where most monitoring for LLM applications still sits. The tooling grew up around the request: one prompt, one completion, one status code, one latency number. An agent turns that into a run with planning steps, retrieval, several model calls, and a handful of tool invocations, and the thing that fails is usually the run rather than any single call inside it.
Because of that, the useful question when comparing platforms is narrower than whether they can trace agents. Nearly all of them can. What separates them is what each one watches on a schedule, what it takes to make that watch fire, and whether the notification drops you inside the run that caused it or leaves you hunting for it.
The eight AI agent monitoring tools below are judged on exactly that.
What Does AI Agent Monitoring Actually Mean?
AI agent monitoring means watching an agent's behavior in production at the level of the whole task, with signals chosen in advance that fire when the task goes wrong. The unit is the session or run rather than the individual model call.
The distinction between observability and monitoring does real work here, and it is practical rather than semantic. Monitoring is the set of signals you decided to watch, the thresholds on them, and the notification when one breaks. Observability is what lets you answer why afterwards by reading the trace. Both matter, but only one of them wakes somebody up.
What makes AI agents awkward is that the failure and the symptom sit in different places. A retrieval step returns a stale document on step two, and the visible problem is a confidently wrong answer on step nine. Every span in between succeeded. Request-level signals report that run as healthy because, by their definition, it was.
So the practical shift is in what gets grouped. A monitoring setup built for agents treats the run as the record, keeps multi-turn sessions together so context set early is still reachable, and attributes cost and latency to the step that produced them. Without that grouping, debugging an agent run starts with reconstructing which calls belonged to it.
What Metrics Actually Matter for AI Agent Monitoring
Operational metrics still matter. Latency, error rate, and token volume tell you the system is running, and when they move, something real happened. They just under-report agents, because an agent can be badly broken while all three look normal. The signals below are the ones that move when the agent is failing at its job.
-
Task completion rate - The share of runs that reached the outcome the user asked for, judged at the end of the session rather than per call. This is the closest thing agents have to a success rate, and it requires defining what completion means for your workflow before you can measure it. Everything else on this list is a leading indicator of this one.
-
Tool selection accuracy and tool error rate - Whether the agent picked the right tool with the right arguments, and how often the tool itself returned an error or malformed output. These separate cleanly in a trace and they fail for different reasons: selection degrades when a prompt or model changes, while tool errors usually track an upstream dependency.
-
Steps per task and loop detection - The number of steps a run consumed against what the task normally takes. A run at three times its usual step count is either handling something unusual or stuck retrying the same call, and the second case is common enough that it deserves its own watch.
-
End-to-end latency and per-step latency - Total wall-clock time for the run is what the user experiences, while per-step latency is what tells you which call to fix. Both are worth tracking, because a run that got slower without any individual step getting slower means the agent added steps.
-
Cost per completed task - Spend divided by successful outcomes rather than by request. A run that loops fifteen times and succeeds is expensive in a way that per-request cost hides, and it is the metric that catches a prompt change quietly doubling the bill while every dashboard stays green.
-
Quality scores on live traffic - Automated scoring of production output on criteria like faithfulness, relevance, or task adherence, sampled to control cost. Offline evals catch what your test set anticipated. Scoring live traffic is what catches the rest, and it is the only signal on this list that speaks to whether the answer was any good.
Not all of these belong on a dashboard someone checks. Some belong on a schedule that reaches out when the number moves.
Which Agent Signals Should Trigger an Alert
An alert is a claim that something is worth interrupting a person for. Measured signals outnumber alert-worthy ones by a wide margin, and wiring every metric in the previous section to a notification is the fastest way to end up with a muted channel.
The signals that earn an alert are rare enough that firing means something, and they come with an obvious next action:
- Completion rate below baseline - Measured over a rolling window rather than per run. This is the signal that catches the failure agents actually produce, where every span returned successfully and the task still did not get done.
- Tool error rate climbing on a specific tool - Scoped to one tool rather than aggregated, because the aggregate moves slowly and the per-tool number usually points straight at an upstream dependency you can go check.
- Cost per run jumping above its normal range - Useful as a notification, though the stronger version of this control is a hard spend cap that stops the run rather than a message telling you it already happened.
- Share of scored runs below a quality threshold - Quality scores are noisy per run and stable in aggregate, so alerting on a single low score produces constant noise while alerting on the share below a threshold produces a signal. That framing also survives the sampling rate you need to keep scoring costs down.
The window is a design decision that gets skipped. A five-minute window catches outages and misses degradation, since a quality regression developing over a working day never trips a threshold measured five minutes at a time, while a one-day window catches drift and reports an outage far too late. Anything you want to catch in both shapes needs two watches at different windows, which is worth knowing before you evaluate a platform whose window options are fixed.
What the alert carries matters as much as when it fires. A notification saying average score dropped below 0.7 starts an investigation, and a notification carrying a link to the filtered set of runs that caused the drop starts a fix. That difference is most of what separates the platforms below.
Top 8 AI Agent Monitoring Tools & Software
| Tool | Alerts on | Session-level tracing | Spend controls | Pricing model |
|---|---|---|---|---|
| Respan | Cost, errors, latency, tokens, scores | Traces and multi-turn threads | Soft and hard caps | Free tier, $199/mo Team |
| Langfuse | Observations and score metrics | Full trace tree | Spend alerts only | Free tier, from $29/mo |
| LangSmith | Cost, errors, latency, feedback | Full trace tree | Spend alerts only | Free tier, from $39/seat/mo |
| Braintrust | SQL filters over logs | Trace tree | Alerts via log filters | Free tier, $249/mo Pro |
| Arize | Any span attribute | Trace tree and agent paths | Spend alerts only | Phoenix free, AX from $50/mo |
| AgentOps | Not documented | Session replay | Not documented | $40/seat plus usage |
| Galileo | Metric averages per log stream | Trace and graph view | Spend alerts only | Free tier, $150/mo Pro |
| Traceloop | Output quality metrics | OpenTelemetry span tree | Not documented | Free to 50K spans/mo |
1. Respan
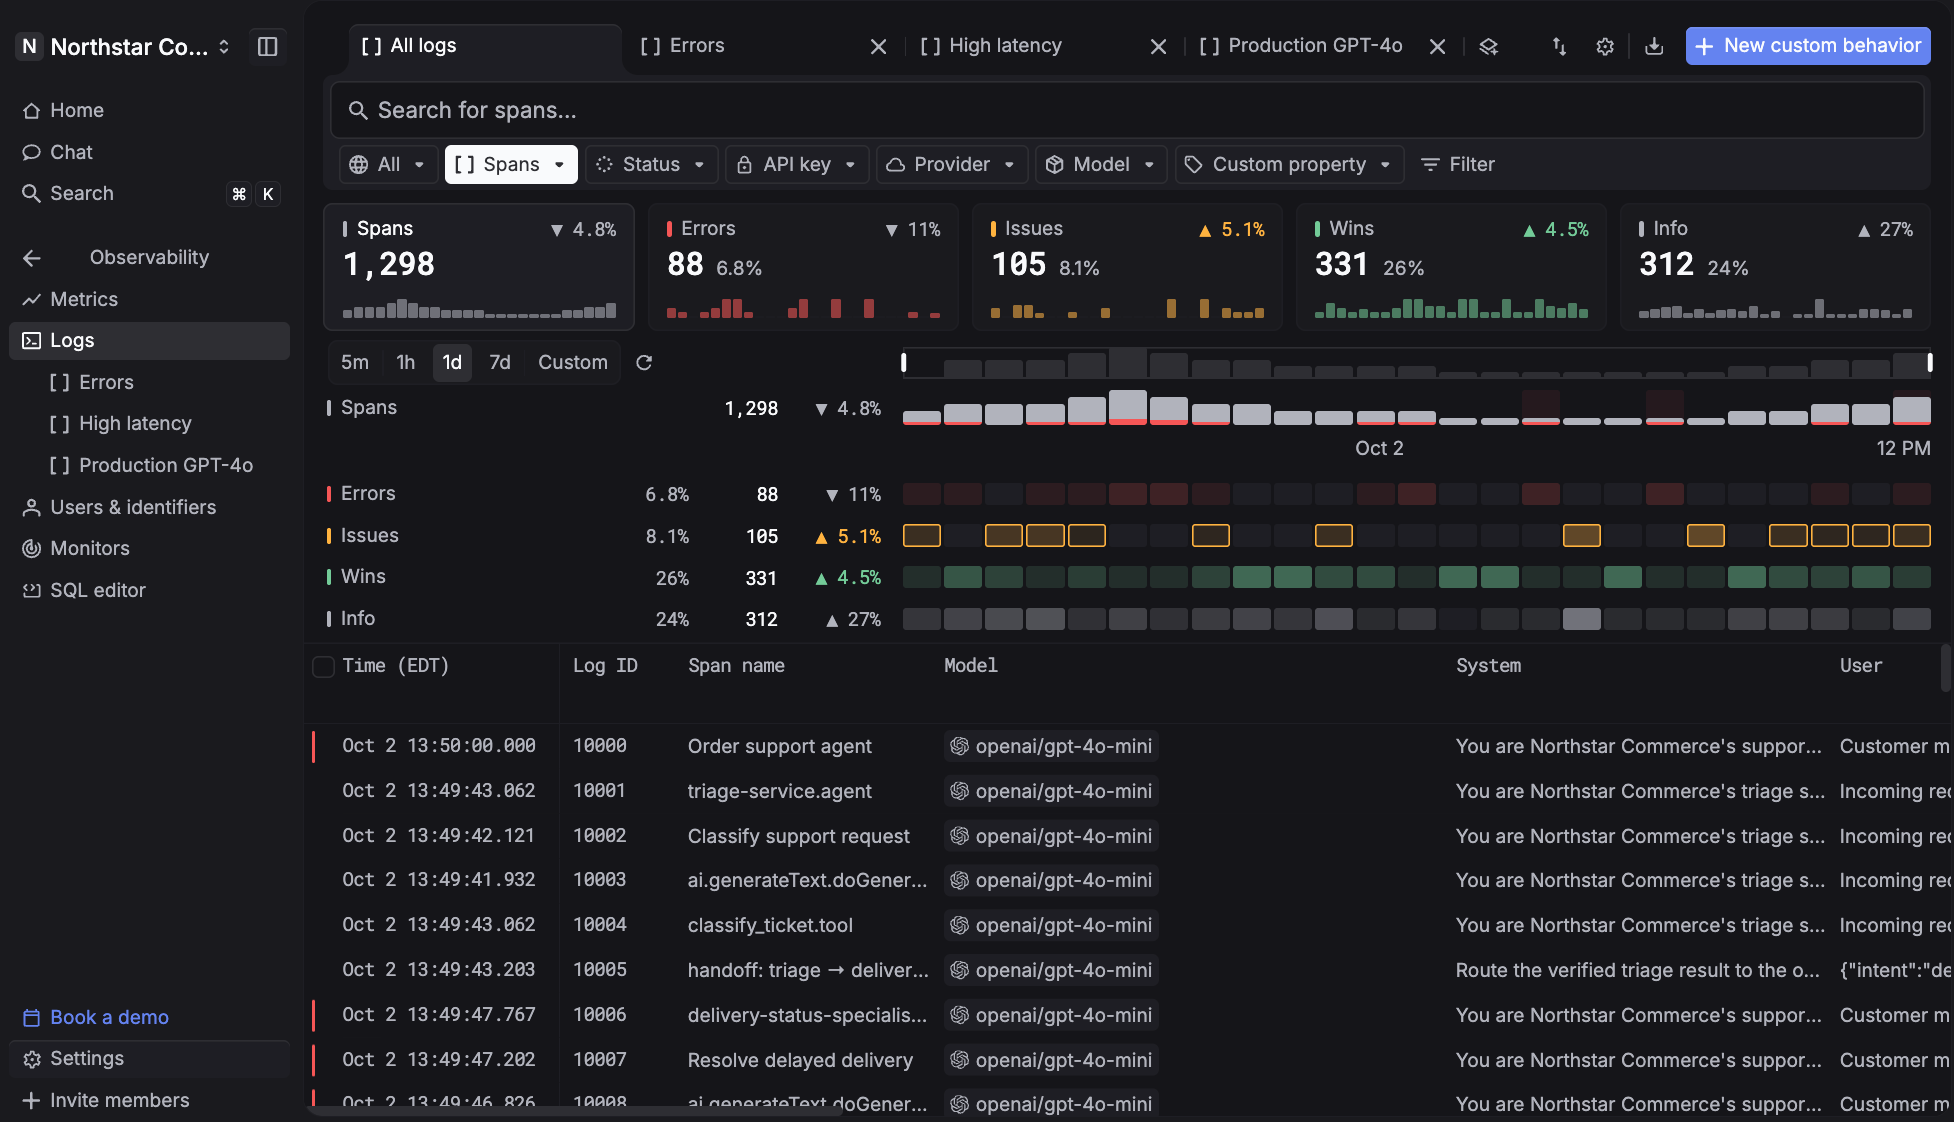
Respan runs monitoring, tracing, evaluation, prompt management, and model routing on one platform. With Respan, you can route, observe, and evaluate every LLM call all in one place. Because the gateway that served a request and the trace that recorded it live in the same system, an alert on cost or quality arrives already attached to the runs behind it, which removes the correlation step that eats the first hour of most incidents.
Respan features:
- Monitors - Watch cost, errors, latency, or tokens over any window, scoped by model, project, environment, or user. The alert reaches Slack, email, or a webhook the moment it breaches.
- Behaviors - Semantically classify live traffic into patterns and chart them over time, with built-in classifiers for frustration, jailbreak, laziness, unsafe output, and escalation, plus your own.
- Span-01 - Span-01, Respan's reasoning classifier, checks agent traces against plain-English behavior definitions, like an agent looping on the same tool call or misusing a tool, in one forward pass, and beats frontier models on Respan's Behavior Benchmark. Span-01 Lite is free.
- Online evals - Deploy an evaluator on live production spans, filtered by status, customer, or thread and sampled to control cost, so a quality regression surfaces in real time rather than in next month's review.
- Error tracking - Find error spikes, classify them by type and cause, and identify contributing failures.
- Threads and users - Group multi-turn sessions so a bad output on turn five traces back to context set on turn two, and attach a customer ID to get spend and tokens broken down per end user.
- Hard spend limits - Set soft and hard caps on spend or rate, per key, per customer, or org-wide. The soft cap warns, the hard cap stops the spend.
- Guardrails - In early access, Respan Guardrails block requests in categories like jailbreak or prompt injection at the gateway, so the pattern Behaviors charts over time can also be stopped before it reaches the model.
- Gateway - One endpoint to 1,000+ models with automatic failover, retries, and caching, at typically 30–40ms of added latency.
Pricing: The free tier includes alerts, 100k logs, 1k scores, and 7-day retention. Team is $199 per month with 10k scores, unlimited datasets and evaluators, 30-day retention, and five seats.
Best for: teams who want the alert, the trace, and the model that served the request in one place.
2. Langfuse
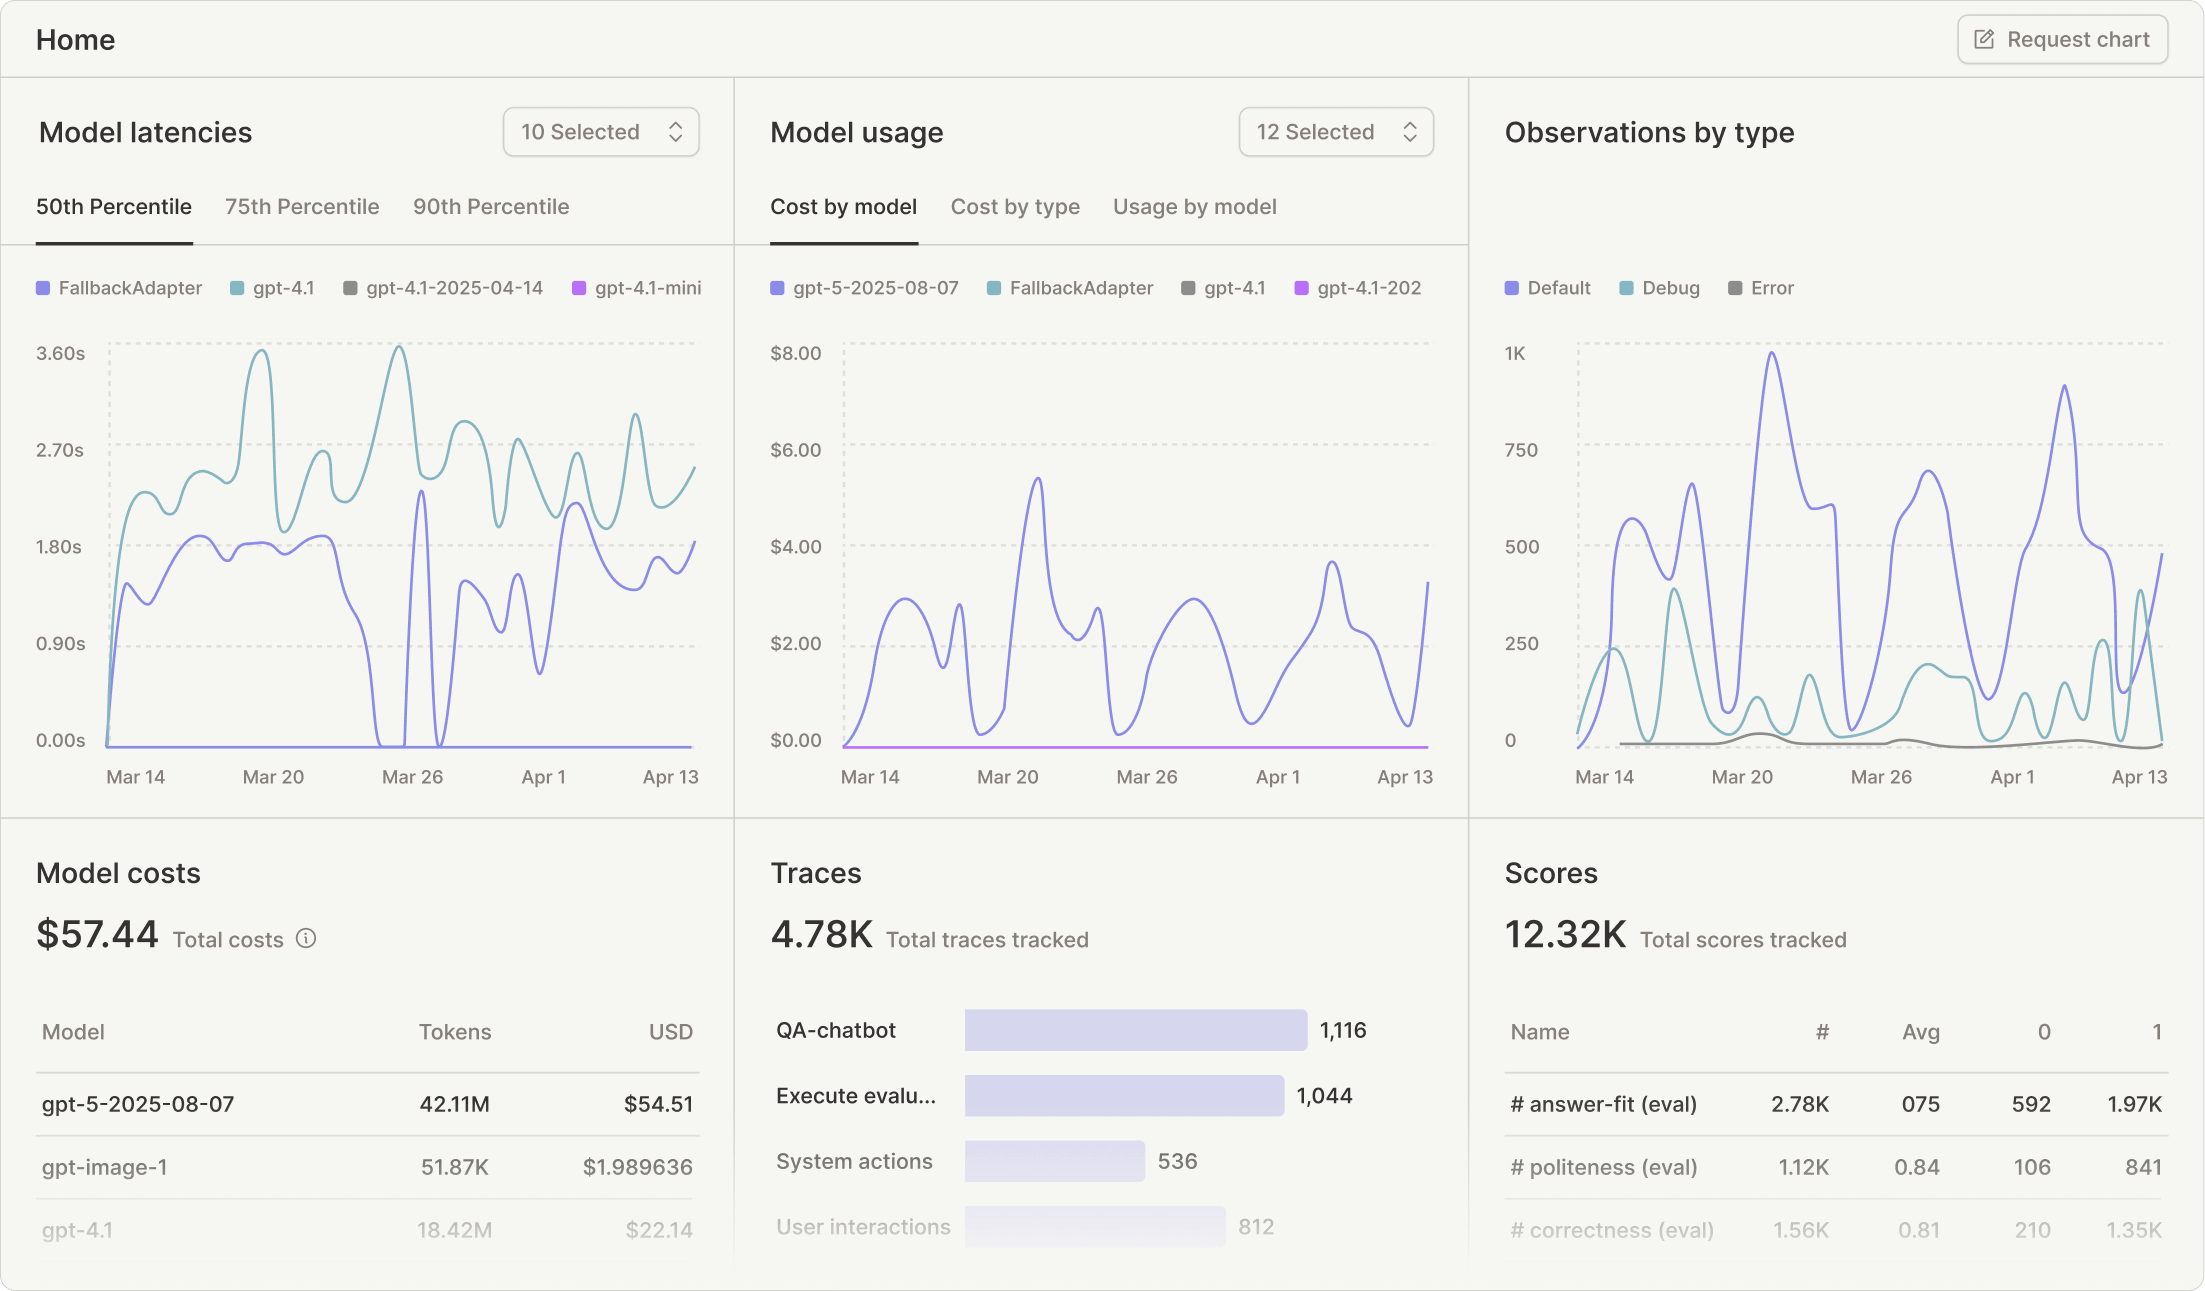
Langfuse is a tracing backbone with prompt management and evaluation attached, and the MIT-licensed core is a real production build rather than a limited demo. OpenTelemetry support is solid and the trace UI handles deep multi-step runs without struggling.
Alerting with Langfuse is a bit more capable than its reputation suggests. Alerts run against observations or against score data, numeric, categorical, or boolean, with filters on model, tag, user, or environment, a warning threshold below the alert threshold, and windows from an hour out to a week.
The constraints with tools like Langfuse are worth knowing if you're interested in giving it a try. Alerts are capped per plan, at 2 on Hobby, 20 on Core, 50 on Pro, and 100 on Enterprise, and self-hosted deployments need v4 or later to get them at all. Langfuse also sits outside the request path, so it can tell you spend crossed a line and cannot stop it.
Pricing: Self-hosting is free to licence. Managed cloud has a free tier with paid plans from around $29 per month.
Best for: teams that want data ownership and are willing to run the infrastructure.
3. LangSmith
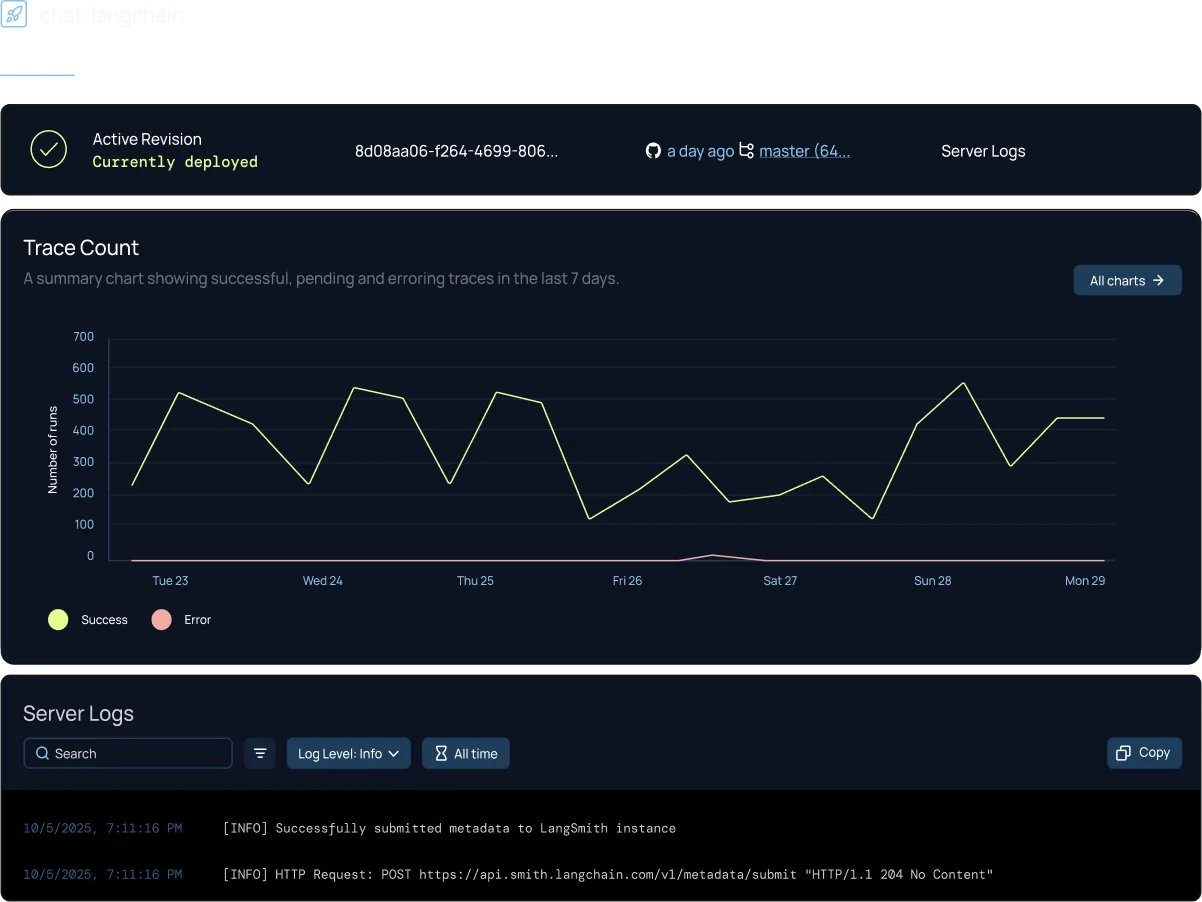
LangSmith ships from the LangChain team, and traces render the full execution tree including tool selections, retrieved documents, and model parameters. Annotation queues route specific runs to domain experts, and that output feeds both datasets and the feedback scores the alerting layer reads.
Alert routing is the strongest part of LangSmith for teams with an existing incident process. Native channels cover Slack, PagerDuty, and Dynatrace alongside generic webhooks, so an agent quality alert can create a real incident in the same system as everything else on call.
The aggregation window is fixed at five or fifteen minutes, and that ceiling is the limitation with tools like LangSmith. Degradation developing across a working day will not cross a threshold measured in fifteen-minute slices, so slow quality drift needs to be caught some other way. Alerts are also project-scoped, meaning each project is configured separately, and trace volume meters separately from seats, so the bill tracks team size independently of usage.
Pricing: A free developer tier covers evaluation. Paid plans start around $39 per seat per month, with traces billed on top.
Best for: LangGraph and LangChain teams that want agent alerts inside an existing on-call rotation.
4. Braintrust
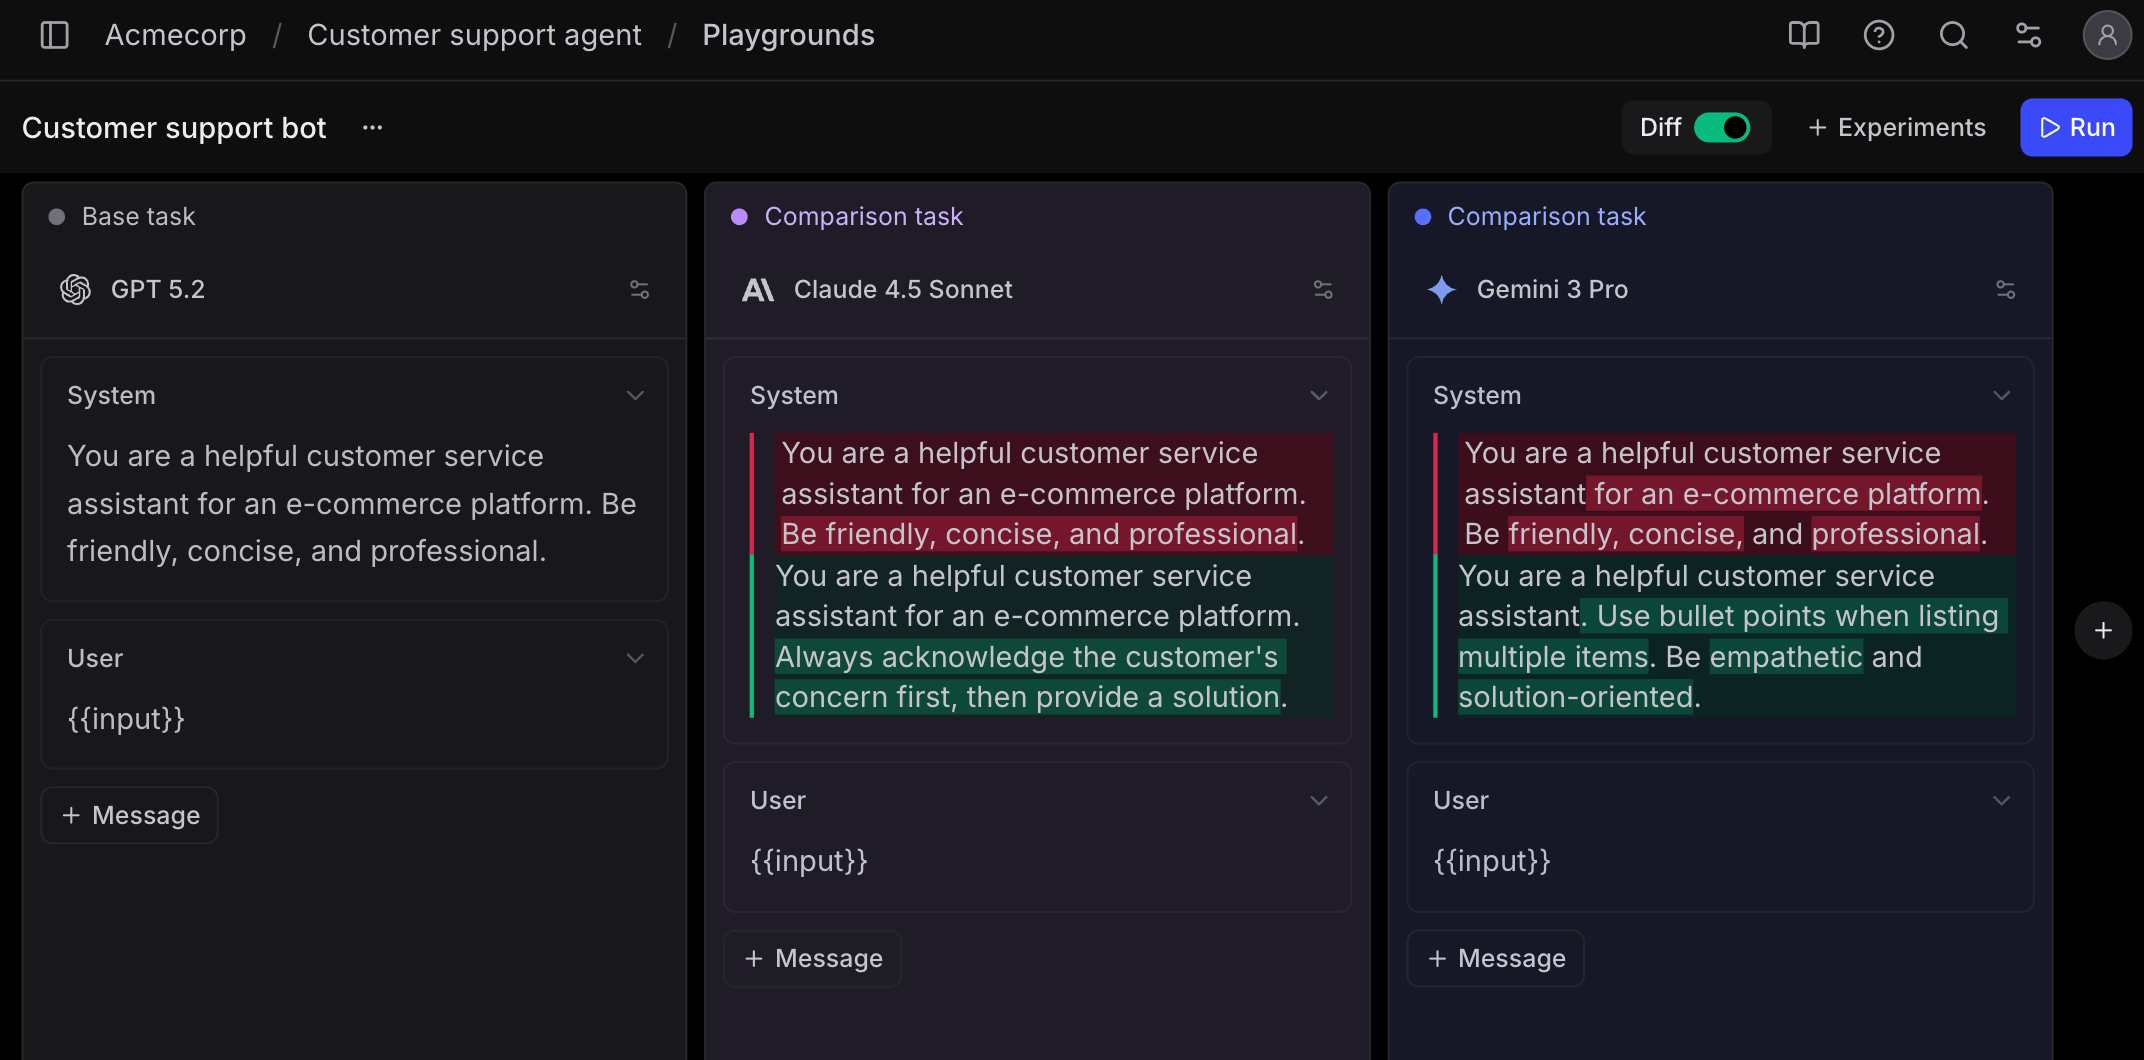
Where most platforms give you a metric dropdown, Braintrust gives you a query. Alerts are SQL filters over log events, checked on an interval from five minutes to twenty-four hours, routed to Slack or a webhook. An alert can express something like a relevancy score under 0.5 on more than five percent of runs in the last hour, or errors on production traffic only, and the same scorer library runs offline and online so a check written during development works unchanged in production.
That expressiveness comes with the obvious cost. There is no threshold slider, and someone has to write and maintain the query, which puts alert configuration in the hands of whoever knows the query language. Braintrust also has environment alerts that fire when a prompt is promoted, which is closer to deployment tracking than to monitoring but useful when a regression follows a prompt change.
Tracing exists to serve the eval workflow, so it is less developed than in platforms built for production debugging, which is the tradeoff at the centre of any Braintrust comparison worth reading. Eval volume can also grow with the size of the test suite rather than with traffic, so the tier escalation might arrive earlier than your team is planning for.
Pricing: Usage-based with no per-seat charge. The free Starter plan includes 1 GB of processed data, 10k scores, and unlimited users. Paid plans start at $249 per month.
Best for: teams where eval discipline is the constraint and someone will happily write the alert queries.
5. Arize
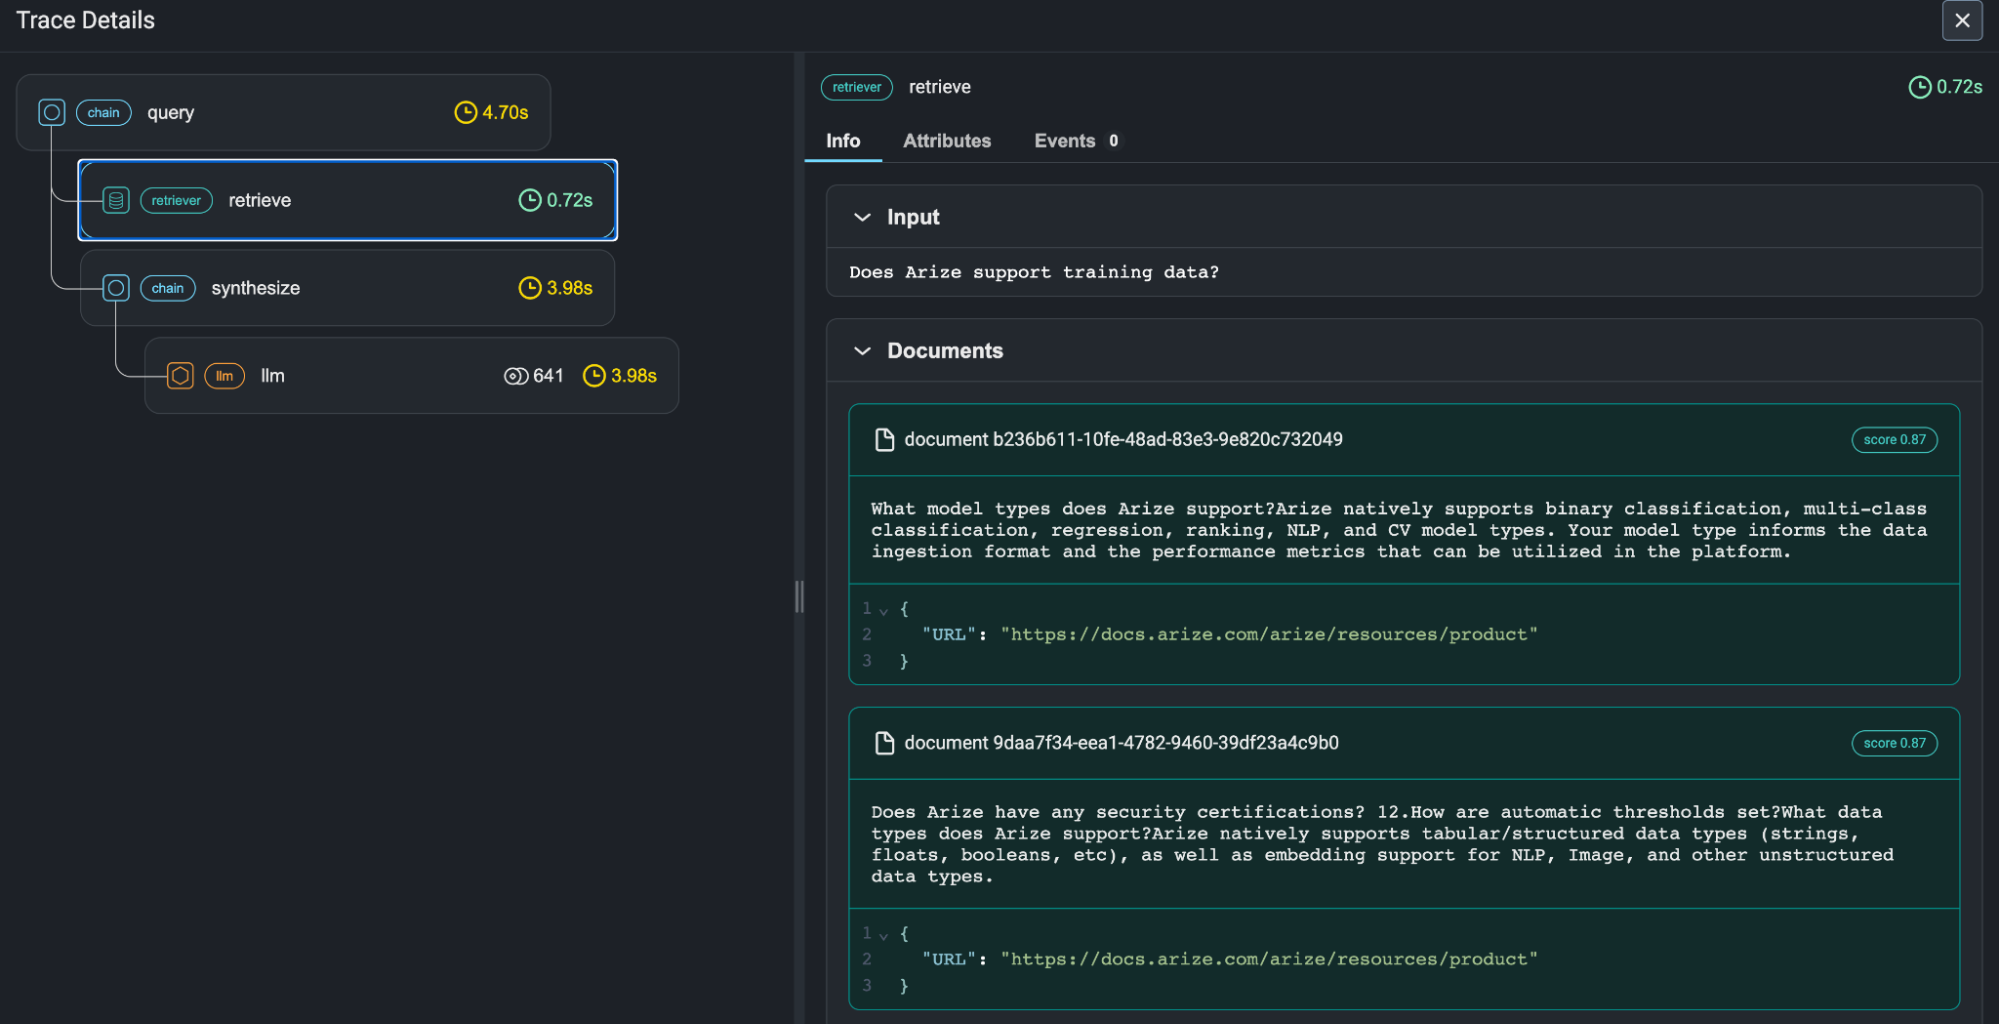
The monitoring layer in Arize is the part that carries the company's ML heritage most visibly, and it shows in the configuration options. A monitor can watch any span attribute, which includes latency, status, token counts, custom metadata, and eval labels, on a window and cadence that goes down to five minutes.
Instrumentation with Arize runs on OpenInference over OpenTelemetry, covering LangChain, LlamaIndex, Haystack, DSPy, and others, and agent path and convergence evaluations are first-class rather than bolted on.
The split between the two products is the thing to check. Monitors are documented as part of the commercial AX platform, and the open-source Phoenix project's documentation covers tracing, evaluation, and experiments rather than production alerting. Phoenix is genuinely useful during development, though running it does not get you the alerting layer.
Pricing: Phoenix is free and self-hosted. Managed AX has a free tier with a capped trace allowance and paid plans from around $50 per month.
Best for: organizations running classical ML alongside LLM workloads that want one monitoring surface for both.
6. AgentOps
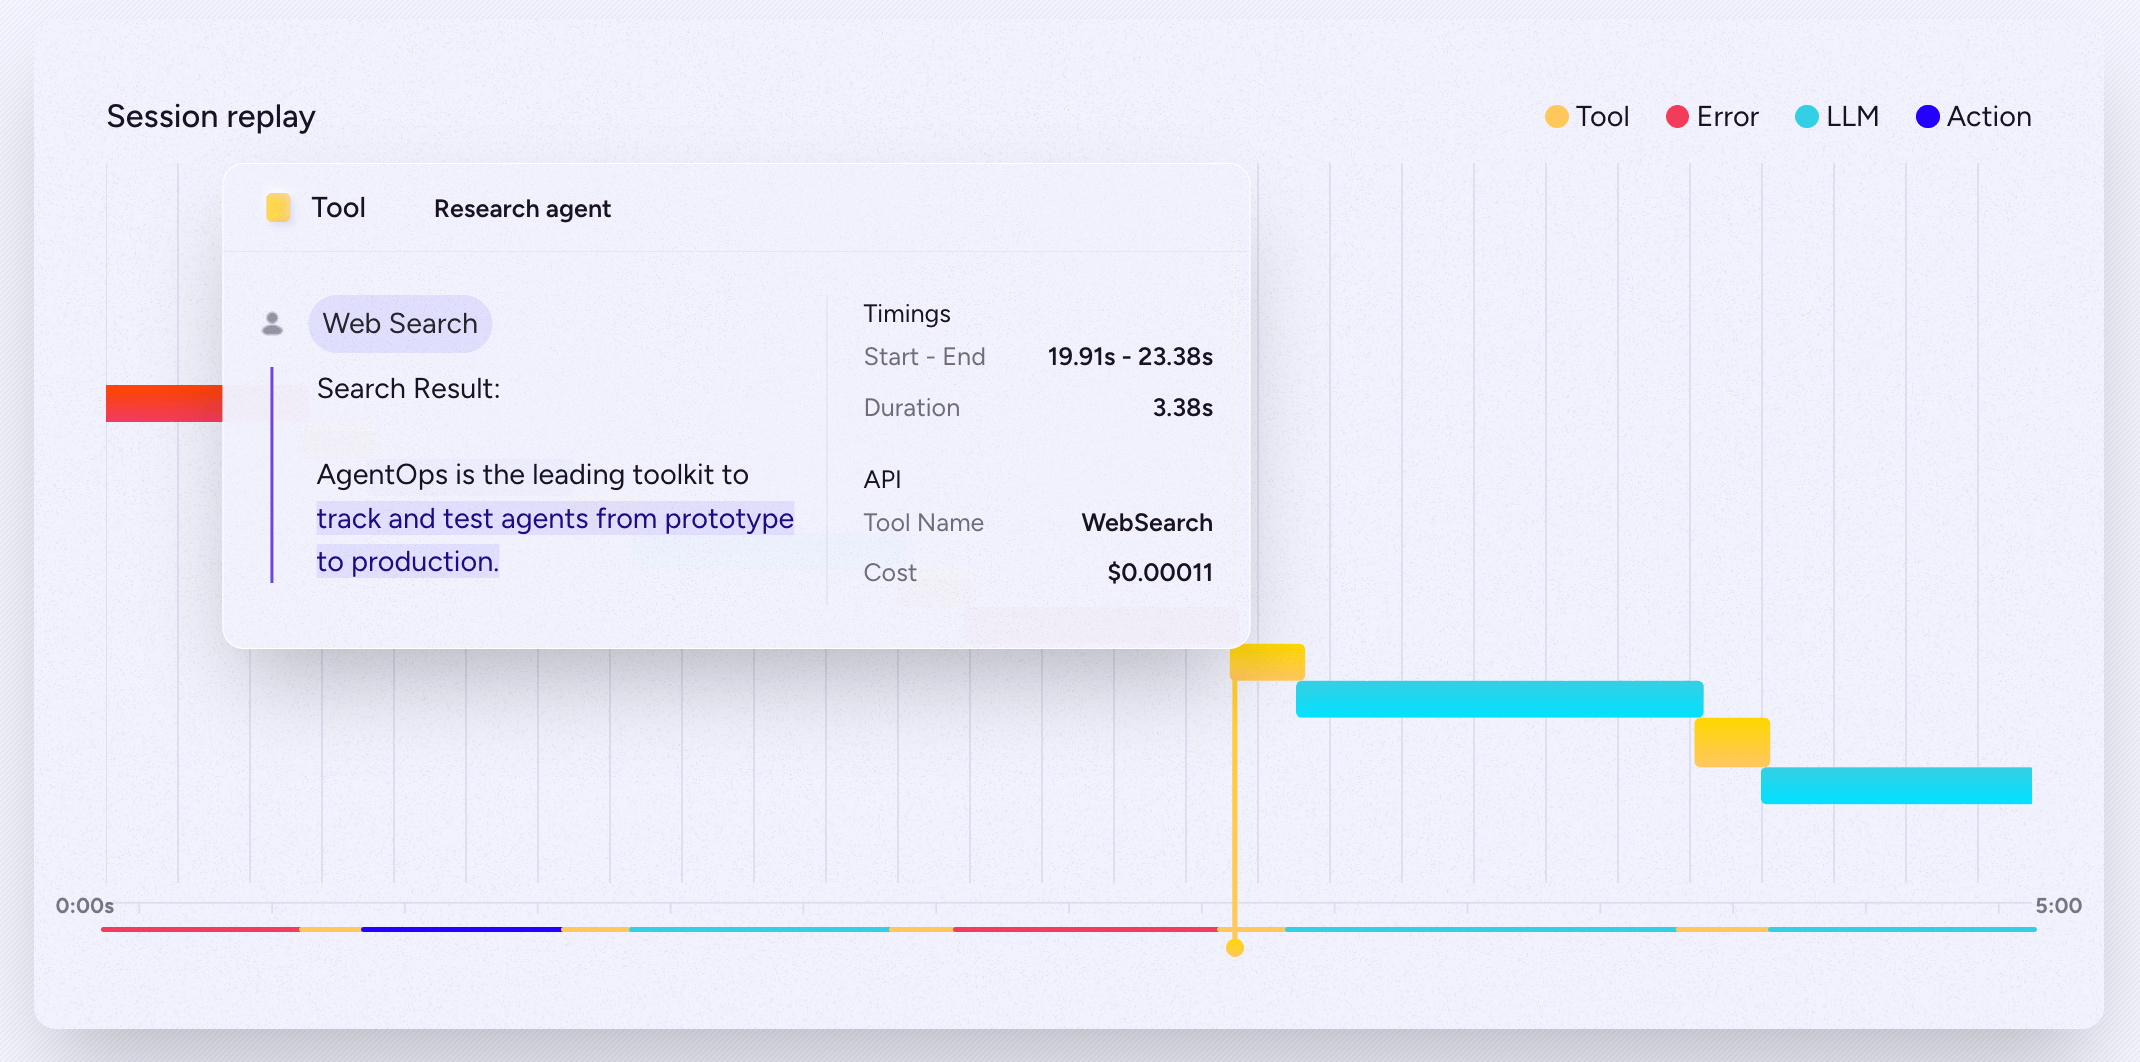
AgentOps organizes everything around the session rather than the request, which is the right shape for this problem and rarer than it should be. A session captures every LLM call, tool invocation, and step from start to finish, and replay walks the run chronologically so you can watch where the agent went wrong instead of inferring it from logs.
For the question this comparison asks, though, the product stops short. AgentOps documents tracing, replay, and cost tracking, and there is no documented alerting or monitor configuration. Monitoring here is something you go and look at rather than something that comes to you, and building the notification layer on top means polling or exporting the data yourself. For development-phase debugging that is a reasonable trade. For a production agent that needs to page someone at 2am, it is a gap you fill elsewhere.
Pricing meters on three axes at once, which makes forecasting harder than a single-meter product. Seats, spans, and tokens each accrue independently, so a small team running high volume and a large team running low volume land in very different places.
Pricing: $40 per seat per month, plus $0.10 per 1K spans after the first 100K, plus $0.20 per 1M LLM tokens.
Best for: framework-native teams who want session replay during development.
7. Galileo
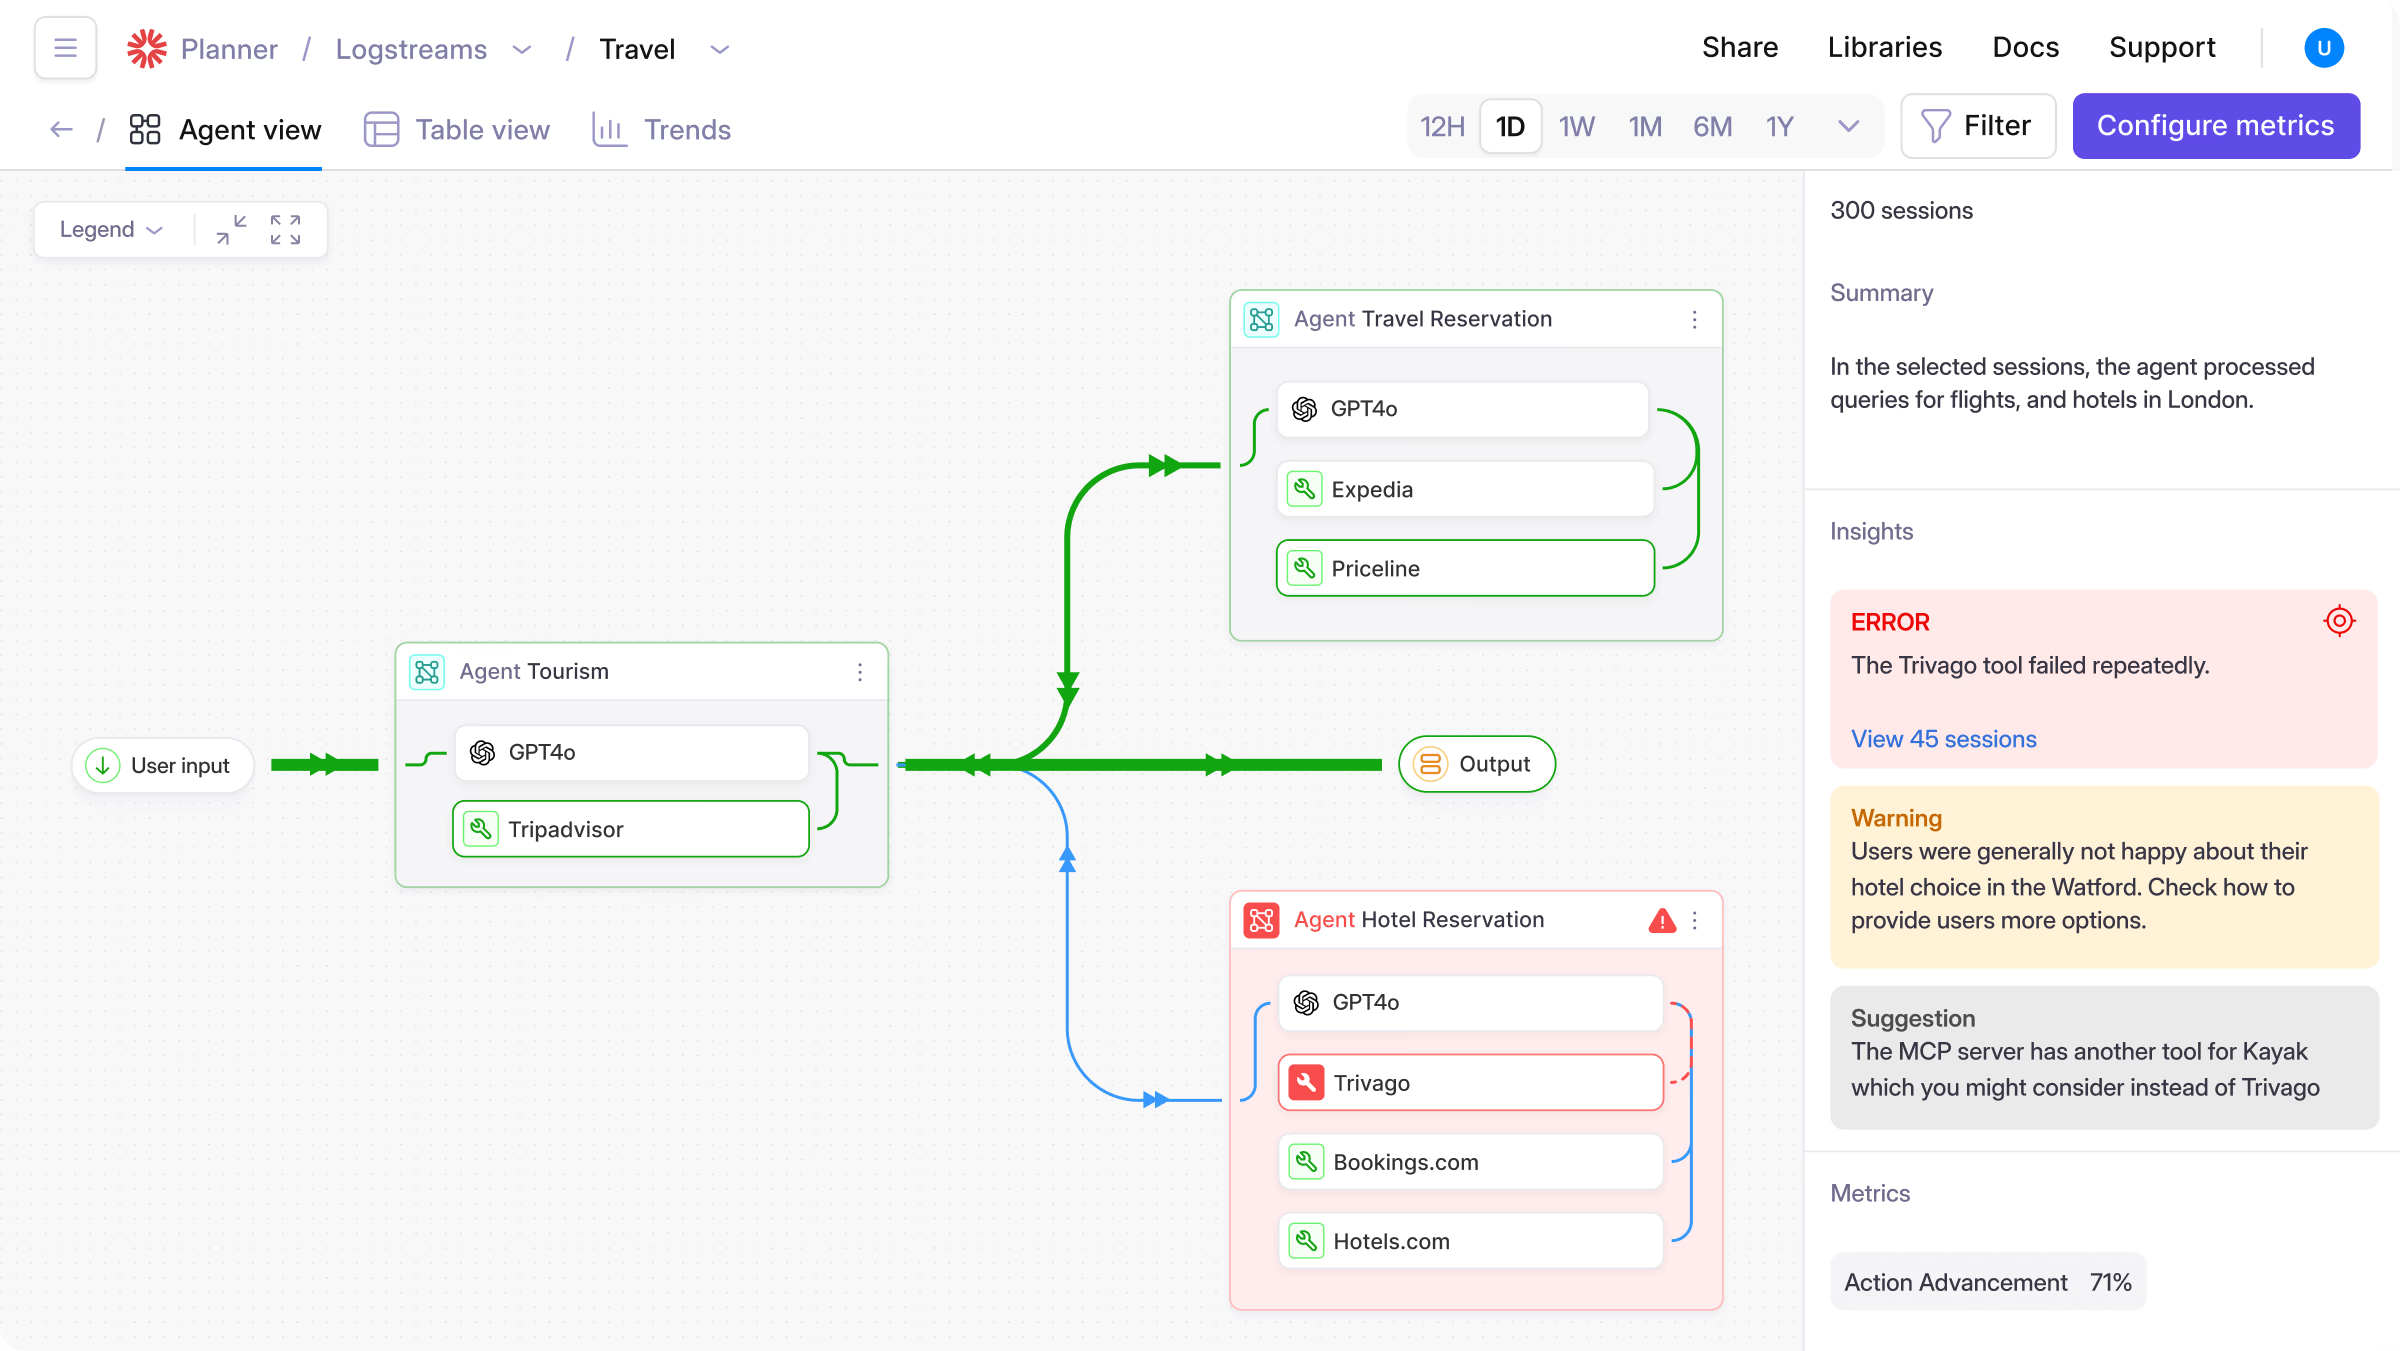
Galileo is built around quality measurement for enterprises where hallucination detection and audit-ready reporting drive the requirement. Agent runs render as an interactive graph rather than only a span list, and agentic metrics like action completion and tool selection quality ship as first-class scorers, so several of the signals worth alerting on exist without anyone writing them.
Alerts run against log streams and fire on a metric average over a window, which covers conditions like context adherence dropping below 0.5 in the last hour. The scoping is worth understanding before you plan around it: alerting attaches to a log stream, so the metrics have to be configured on that stream first, and coverage is a function of how the streams were carved up rather than something that applies across the project by default.
The product is built around governance and audit workflows, so the developer experience is thinner than platforms designed for engineers debugging production, and there is no self-hosting, which rules it out where data residency is a hard requirement. Runtime protection, which blocks unsafe output before it reaches a user, is a separate mechanism from alerting and sits on the Enterprise tier.
Pricing: Free tier, then $150 per month for Pro billed monthly, with Enterprise on quote.
Best for: regulated environments where quality reporting has to satisfy someone outside engineering.
8. Traceloop
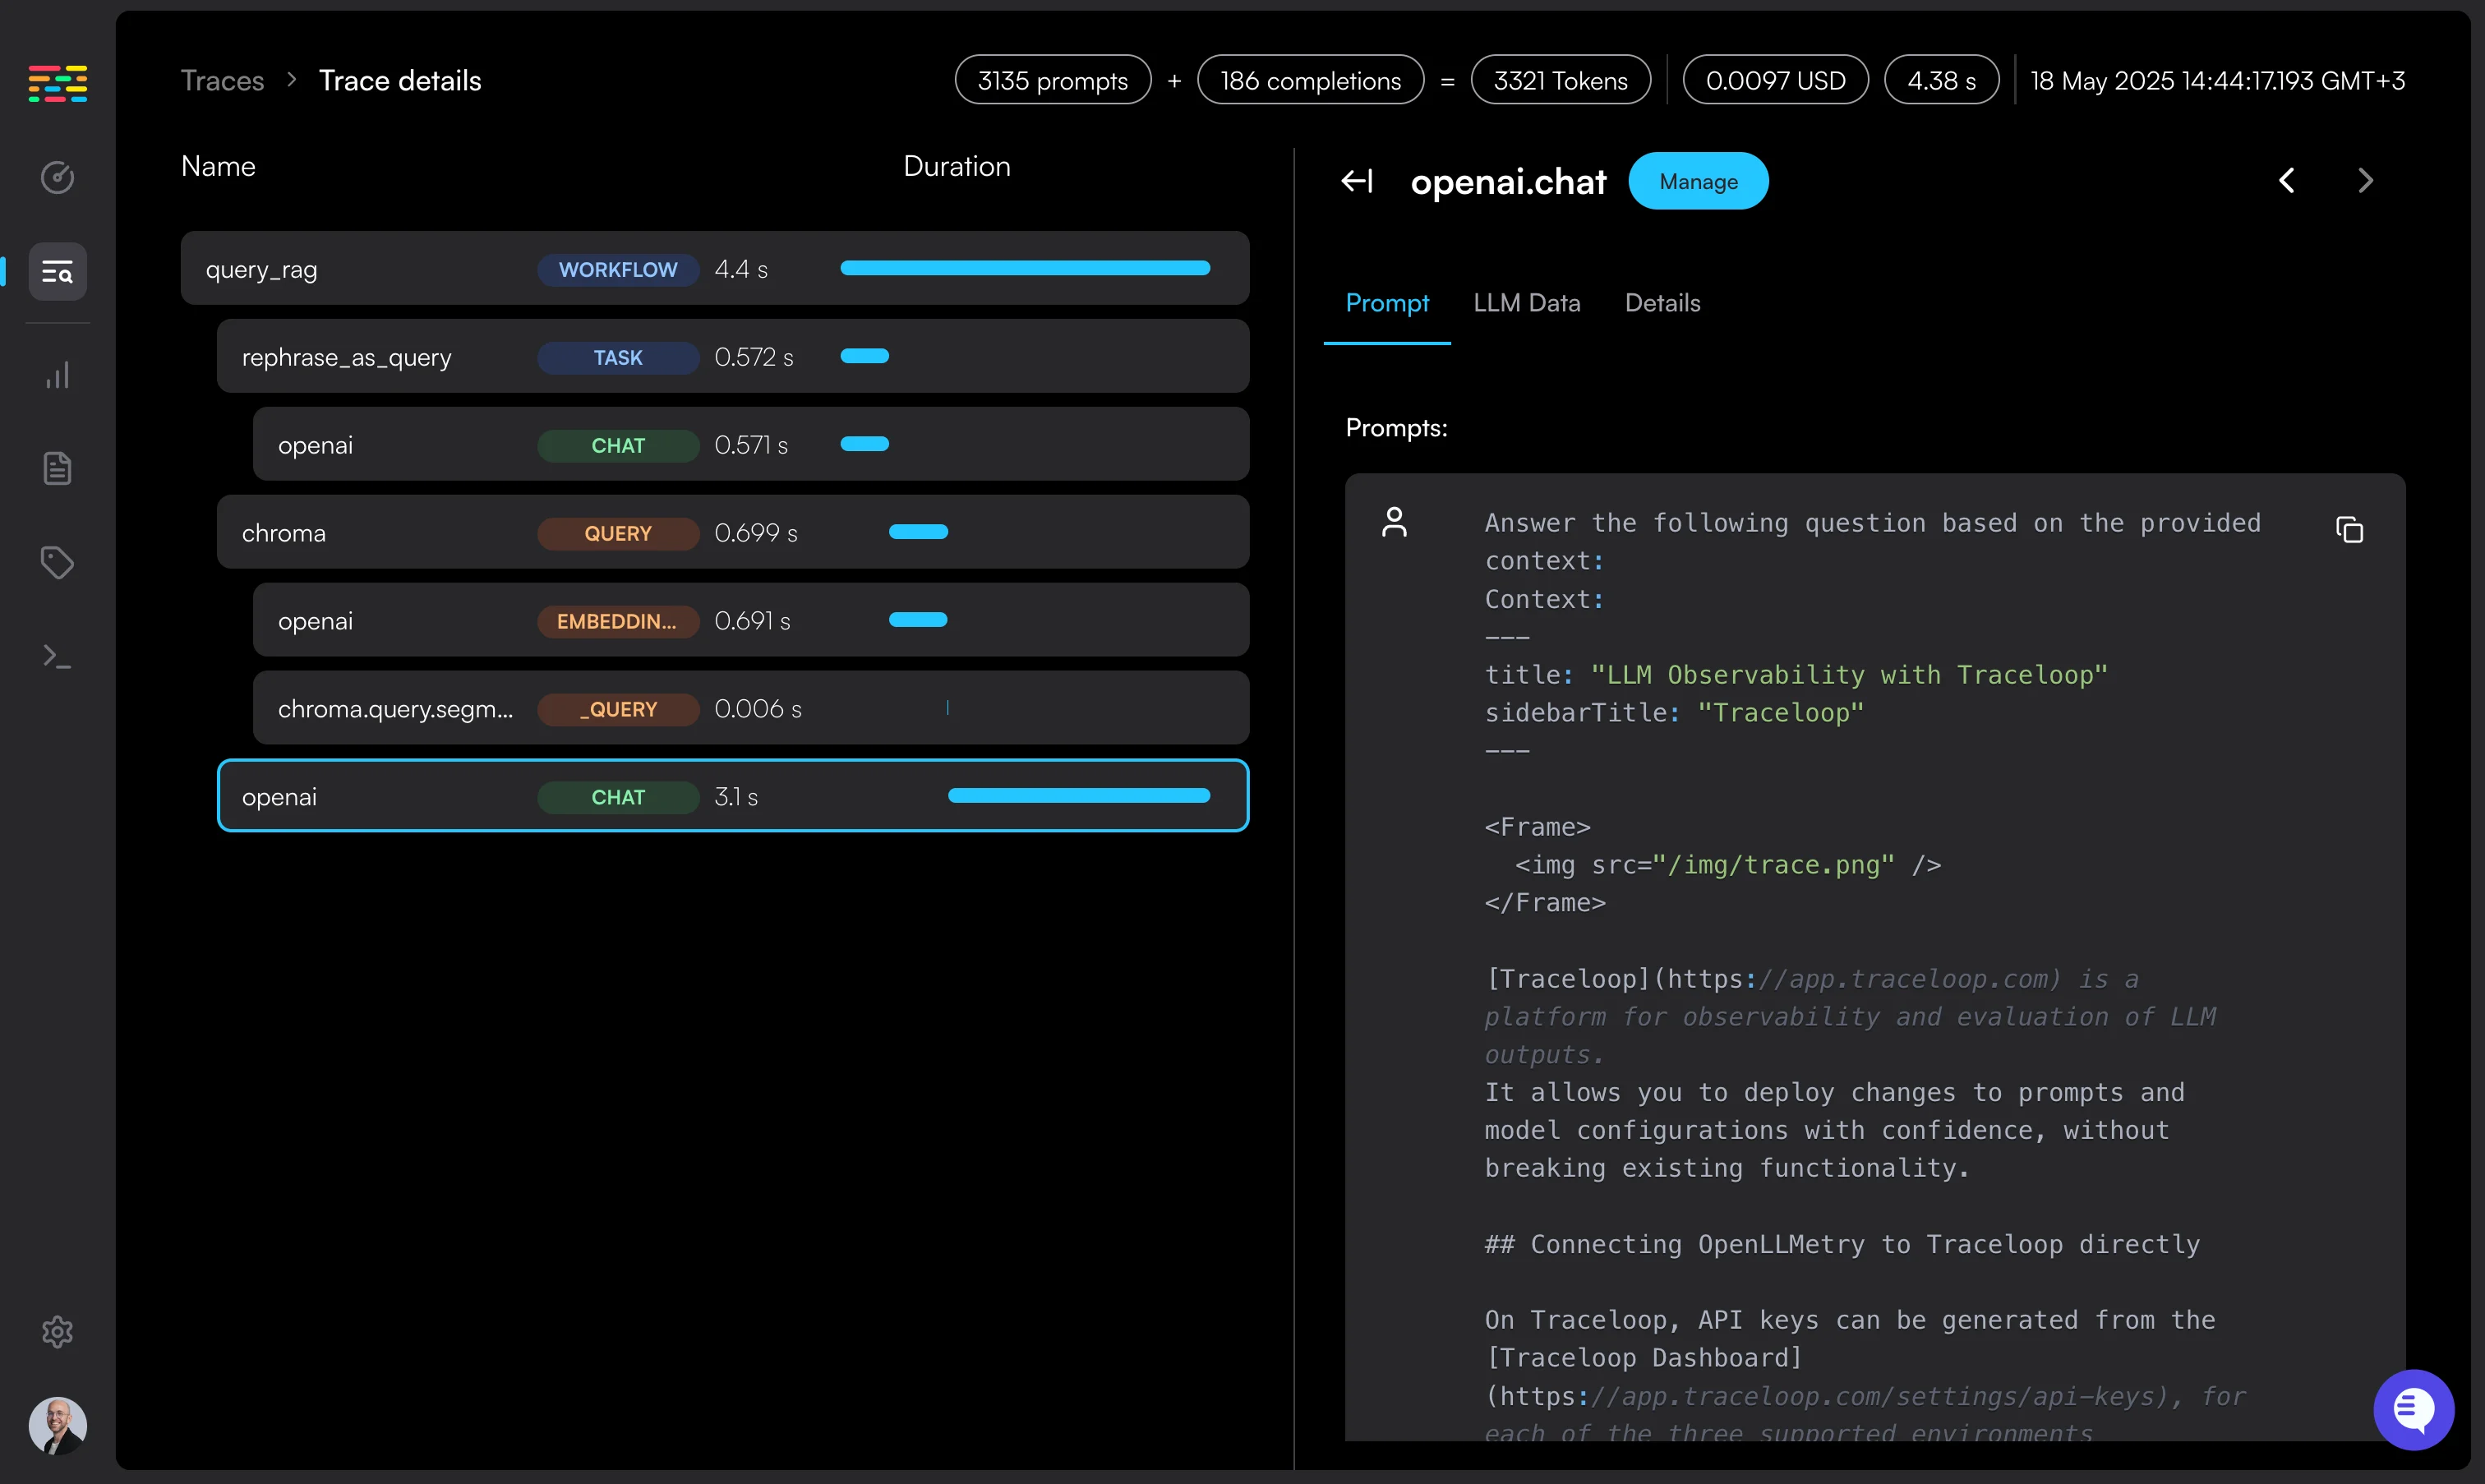
Traceloop is built on OpenLLMetry, its own Apache-2.0 instrumentation layer for OpenTelemetry, which means agent runs arrive as standard OTel span trees and the same instrumentation can export to other backends. Setup is one line through the SDK, or through Traceloop Hub as a proxy in front of your model calls, and both the monitoring and evaluation dashboards are available on the free tier rather than gated behind a paid plan.
Real-time alerting on output quality is documented as a headline capability, running on built-in evaluators for faithfulness and relevance plus custom evaluators trained on your own data, with drift detection to catch quality regressions before users report them.
Retention on the free tier is 24 hours, which interacts badly with alerting in a specific way. An alert that fires overnight points at runs that may no longer exist by the time anyone opens it. That pushes any serious production use onto the Enterprise tier, where retention is custom and pricing is a conversation.
Pricing: Free to 50K spans per month with 24-hour retention. Enterprise is quoted, and includes SOC 2 and an on-premise deployment option.
Best for: teams committed to OpenTelemetry who want instrumentation they can point somewhere else later.
Frequently Asked Questions
What is the difference between AI agent monitoring and LLM observability?
LLM observability is the broader capability of understanding what your system did, built on traces, scores, and logs you can query after the fact. AI agent monitoring is the narrower job of watching chosen signals on a schedule and raising a notification when one crosses a line, scoped to the whole agent run rather than to individual calls. In practice you need both, since the alert tells you something is wrong and agent observability tells you why by opening the run behind it. Platforms that provide them together remove the step where you correlate one against the other during an incident.
Can you monitor AI agents with existing APM tools?
Partially, and the limit is structural. An APM agent instruments the service, so it reports spans, error rates, and latency accurately, and the completion text is a payload it was not built to read. That covers whether the system is up and misses whether the agent completed the task, which is the failure mode agents actually produce. Teams already invested in an APM stack usually keep it for infrastructure and add a platform that scores output quality on live traffic, then route both into the same on-call process.
When should you start monitoring an AI agent?
Before the first real user, since baseline telemetry is what makes any threshold meaningful and you cannot set one without knowing what normal looks like. Start with cost per run, end-to-end latency, and error rate, which take an afternoon to wire up. Add quality scoring on sampled production traffic once the traffic is recognizable enough to interpret, and add alerts after that, in that order. Teams that configure alerts before they have a baseline mostly configure noise and mute it within a week.
What is the best free AI agent monitoring tool?
Respan's free tier is the most complete of the free options for production monitoring, because alerts are included rather than reserved for a paid plan, and it covers 100k logs, 1k scores, five datasets, two evaluators, and 7-day retention with monitors that reach Slack, email, or a webhook. Langfuse's free cloud tier includes two alerts, and self-hosting the MIT core has no licence cost if you are willing to run Postgres and ClickHouse. Traceloop's free tier includes the monitoring dashboard but retains data for 24 hours, which is short for investigating an overnight alert. Free tiers on this list mostly diverge on retention and on whether alerting is included at all, so check both before picking one.
How do you monitor a multi-agent system?
Group everything under one session or thread so a failure on the fifth agent's turn traces back to the context the second agent set, then attribute cost and latency per agent so you can see which one is expensive and which one is slow. Handoffs between agents are worth their own signal, since a task that gets passed back and forth is a specific failure mode that looks like normal activity in aggregate. Beyond that, the monitoring is the same as for a single agent applied at the system level: completion rate for the whole task, tool error rate per agent, and quality scoring on the final output. Respan's threads group multi-turn sessions this way, with per-step cost and latency attached to each span in the tree.