Choosing an AI observability platform used to be something teams did after launch. With agents now running customer-facing workflows, it's happening before release, and the shortlist keeps shifting as eval vendors, APM companies, and gateways all add agent features.
The products sold as AI observability vary a lot in how much of a run they can see. Some trace every step of an agent and score its output on live traffic, while others started as eval suites or APM platforms and extended into agents from there.
For agents in production, the deciding factor is whether one platform can show you the full run and tell you whether the output was any good, without wiring several tools together.
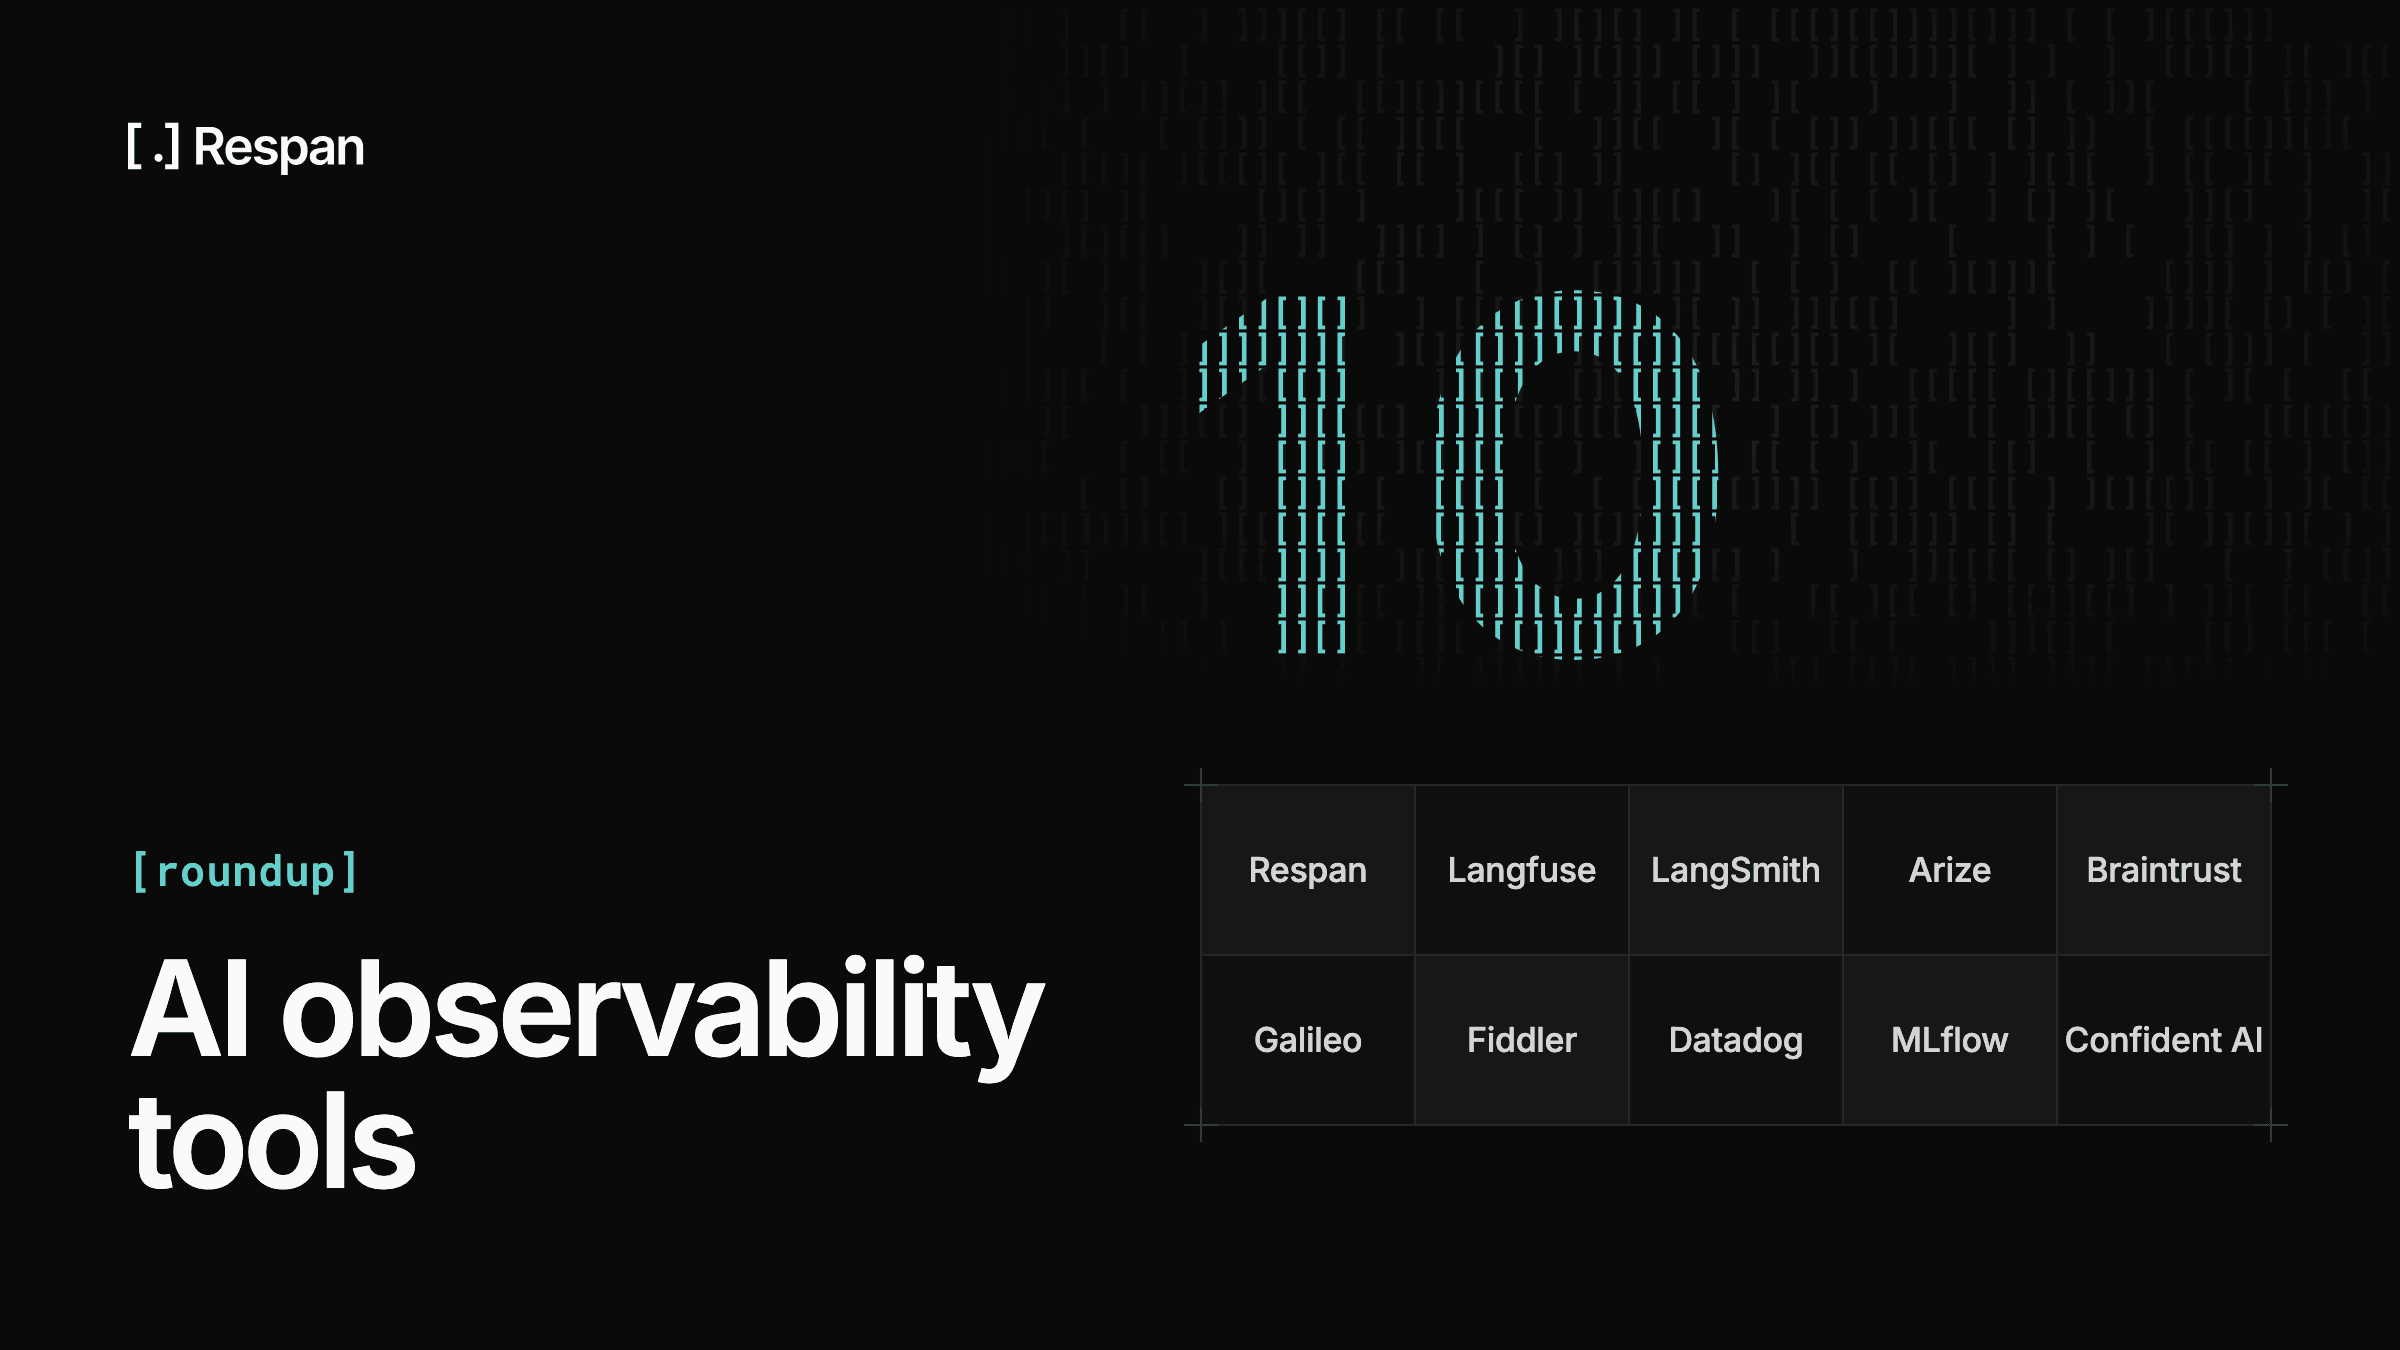
Below are the 10 best AI observability tools and platforms for agents in 2026, compared on tracing, live evals, governance, and pricing.
TL;DR: Best AI Observability Tools Compared
The short version, with each platform's starting price and best fit:
| Tool | Type | Starting price | Best for |
|---|---|---|---|
| Respan | Router, observability, and evals | Free; Team $199/mo | Production agents, one platform |
| Langfuse | Open-source LLM platform | Free; Core $29/mo | Open-source tracing and evals |
| LangSmith | Observability and evals | Free; $39/seat/mo | LangChain and LangGraph stacks |
| Arize | ML and LLM observability | Phoenix free; AX $50/mo | Mixed ML and LLM teams |
| Braintrust | Eval-first platform | Free; Pro $249/mo | Eval-driven teams |
| Galileo | Evals and guardrails | Free; from $100/mo | Splunk customers |
| Fiddler | Guardrails and explainability | Free; $0.002/trace | Regulated industries |
| Datadog | APM with agent module | Free; Pro $160/mo | Teams already on Datadog |
| MLflow | Open-source ML platform | Free to self-host | MLflow and Databricks teams |
| Confident AI | Eval platform from DeepEval | Free; Starter $200/mo | DeepEval users |
Starting prices are each vendor's published entry point, and most of these platforms meter on spans, traces, or scores, so the number that matters is the cost at your production volume.
What to Look for in an AI Observability Tool
What an AI observability platform can report is bounded by where it sits and what it was built for, and with agents in production those limits show up fast. These capabilities separate a platform you can run agents on from one you'll outgrow:
- Agent run tracing - A failed agent run is usually a chain of reasonable-looking steps with one bad decision in it. The platform should record the whole run as one nested trace, including tool arguments, tool results, and retrieved context, so you can find the step that went wrong.
- Evals on live traffic - Offline test sets catch what you anticipated. Scoring sampled production traffic with LLM-as-a-judge, code checks, or human review catches what you didn't, which is where unplanned agent failures show up.
- Cost and token attribution - Agents multiply token spend through loops and retries. Cost broken down by model, feature, and customer tells you which change doubled the bill and who it affects.
- Alerting on quality - Alerts inherited from infrastructure monitoring watch error rates and latency, and an agent that picks the wrong tool or skips a step usually moves neither. Monitors on eval scores, cost, and token volume are what surface that kind of regression.
- Integration approach - Proxy integration is the fastest to set up but only sees requests passing through it. SDK instrumentation captures what happens inside the application, and OpenTelemetry-based instrumentation keeps your traces portable if you change platforms later.
- Governance and compliance - Prompts and completions carry customer data. Look for PII masking, retention controls, access control, and the certifications your buyers ask about, such as SOC 2 and HIPAA with a BAA.
- Gateway and routing - Routing, fallbacks, and caching are often a separate purchase, which leaves the record of which model served a request apart from the record of how it performed. If you run more than one provider, keeping both in one place removes a correlation step from every incident.
Agent run tracing and live evals are worth weighting above the rest, since they decide whether a platform can show you the failure that made you start looking for one in the first place.
The 10 Best AI Observability Tools and Platforms
Respan comes first. The rest run from LLM-native platforms through eval-first tools to platforms that extended into agents from APM or classical ML.
1. Respan
Type: AI router with built-in observability and automated evals · Price: Free tier, Team $199/mo
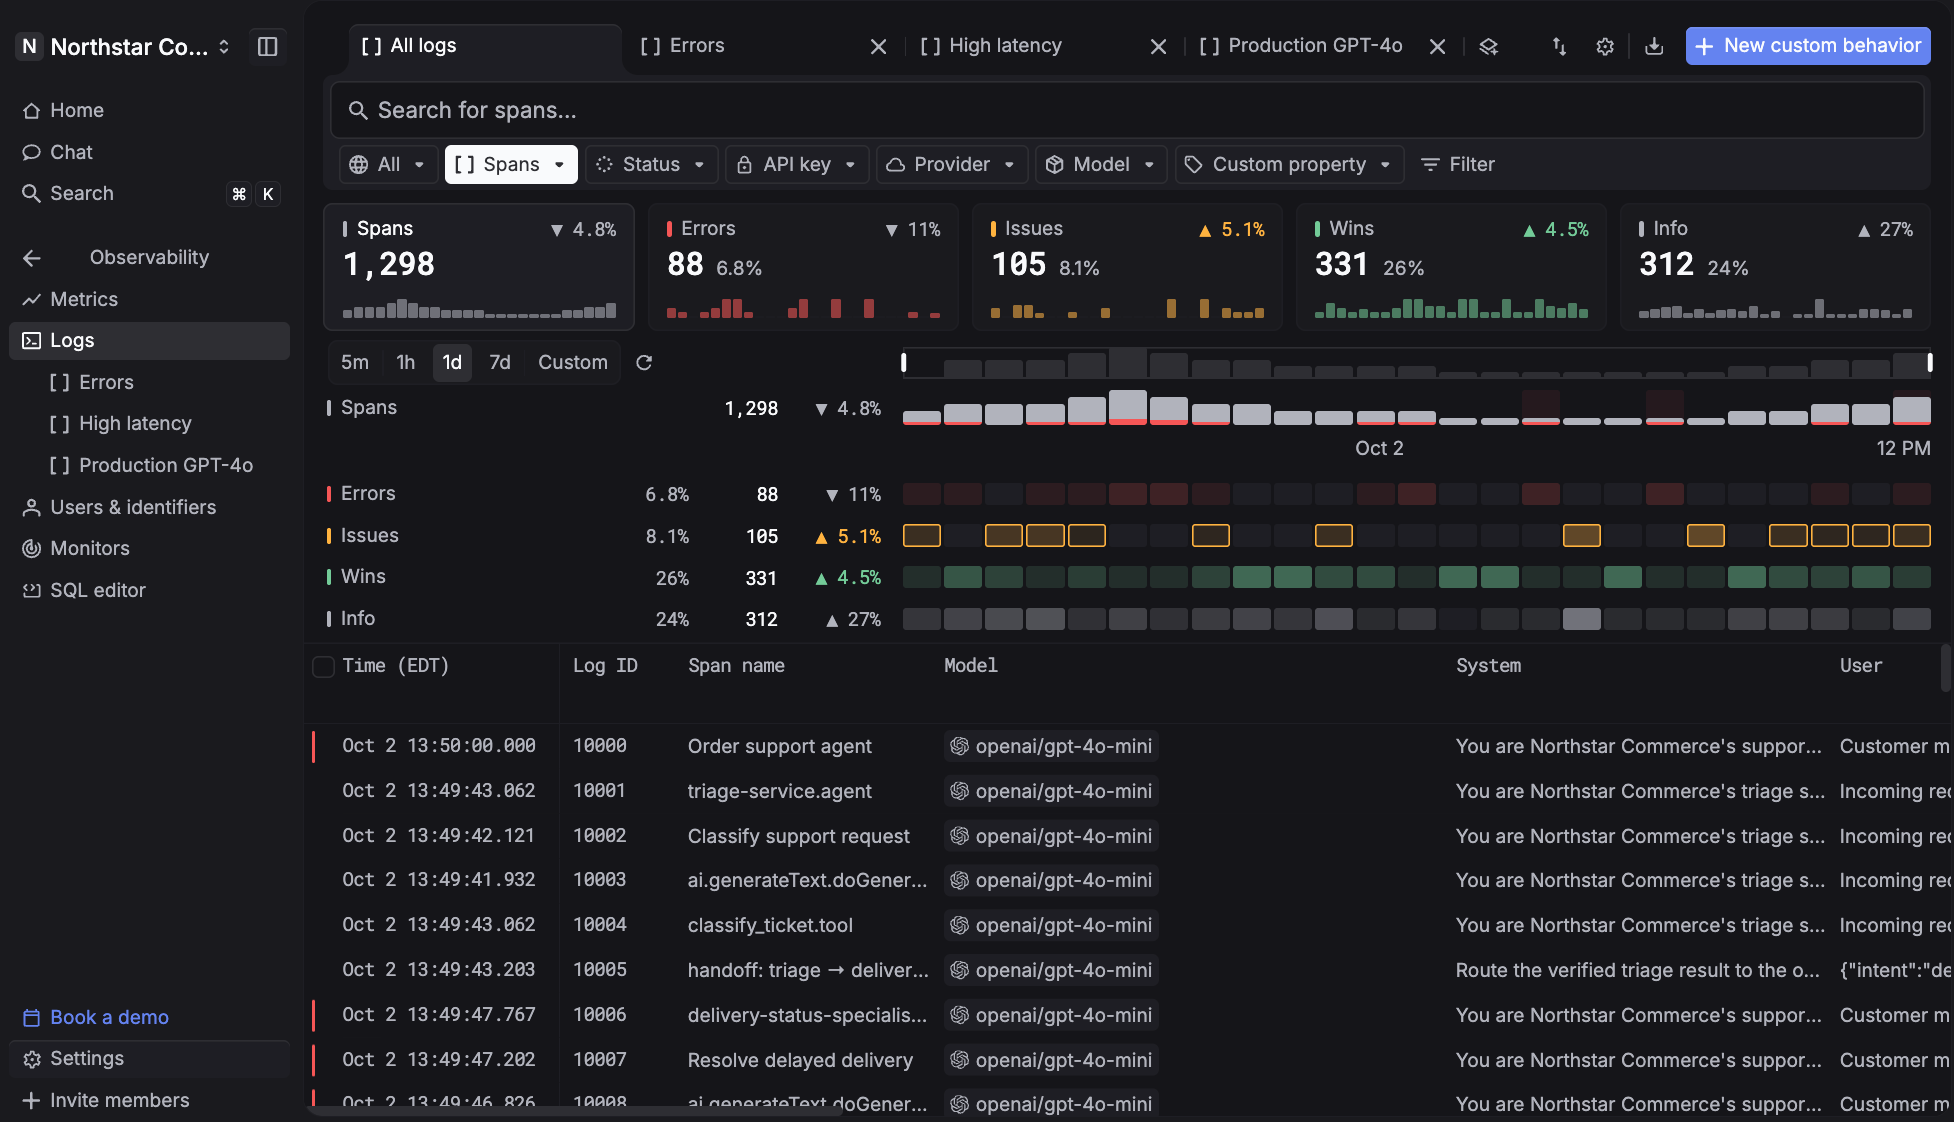
Respan sends every model call through one API and traces, prices, and scores it in the same place. Route, observe, and evaluate every LLM call, so a metric always ties back to the agent run behind it and a bad output leads to the step that caused it.
What that gets you:
- See the whole agent run - Every LLM call, tool run, retrieval, and agent turn becomes a span in one nested trace, each with its own input, output, latency, and cost.
- Score quality on live traffic - LLM judges, code checks, and human review compose into one evaluator that runs on sampled production spans, filtered by status, customer, or thread.
- Know where every dollar goes - Costs broken down by model, request, and end customer, with soft warnings and hard spend limits per key or customer.
- Hear it from Respan, not a customer - Monitors watch cost, errors, latency, or tokens and alert Slack, Microsoft Teams, email, or a webhook the moment one breaches.
- Stay up when a provider fails - The AI gateway routes to 1,000+ models. List the models to fall back to once, and traffic moves to the next one when a provider errors or rate-limits.
- Close the loop - Turn a bad trace into a dataset, test a fix against real data in an experiment, and ship the winning prompt version without a code deploy.
- Pass the security review - SOC 2, HIPAA with a BAA, GDPR, and ISO 27001, with PII masking for prompts that carry customer data.
Pricing: Free covers 100k logs, 1k scores, 5 datasets, 2 evaluators, and 7-day retention with unlimited seats. Team is $199 per month billed yearly, with 10k scores, unlimited datasets, evaluators, and prompts, and 30-day retention. Enterprise is custom.
Best fit: teams running agents in production who would rather debug one system than four.
2. Langfuse
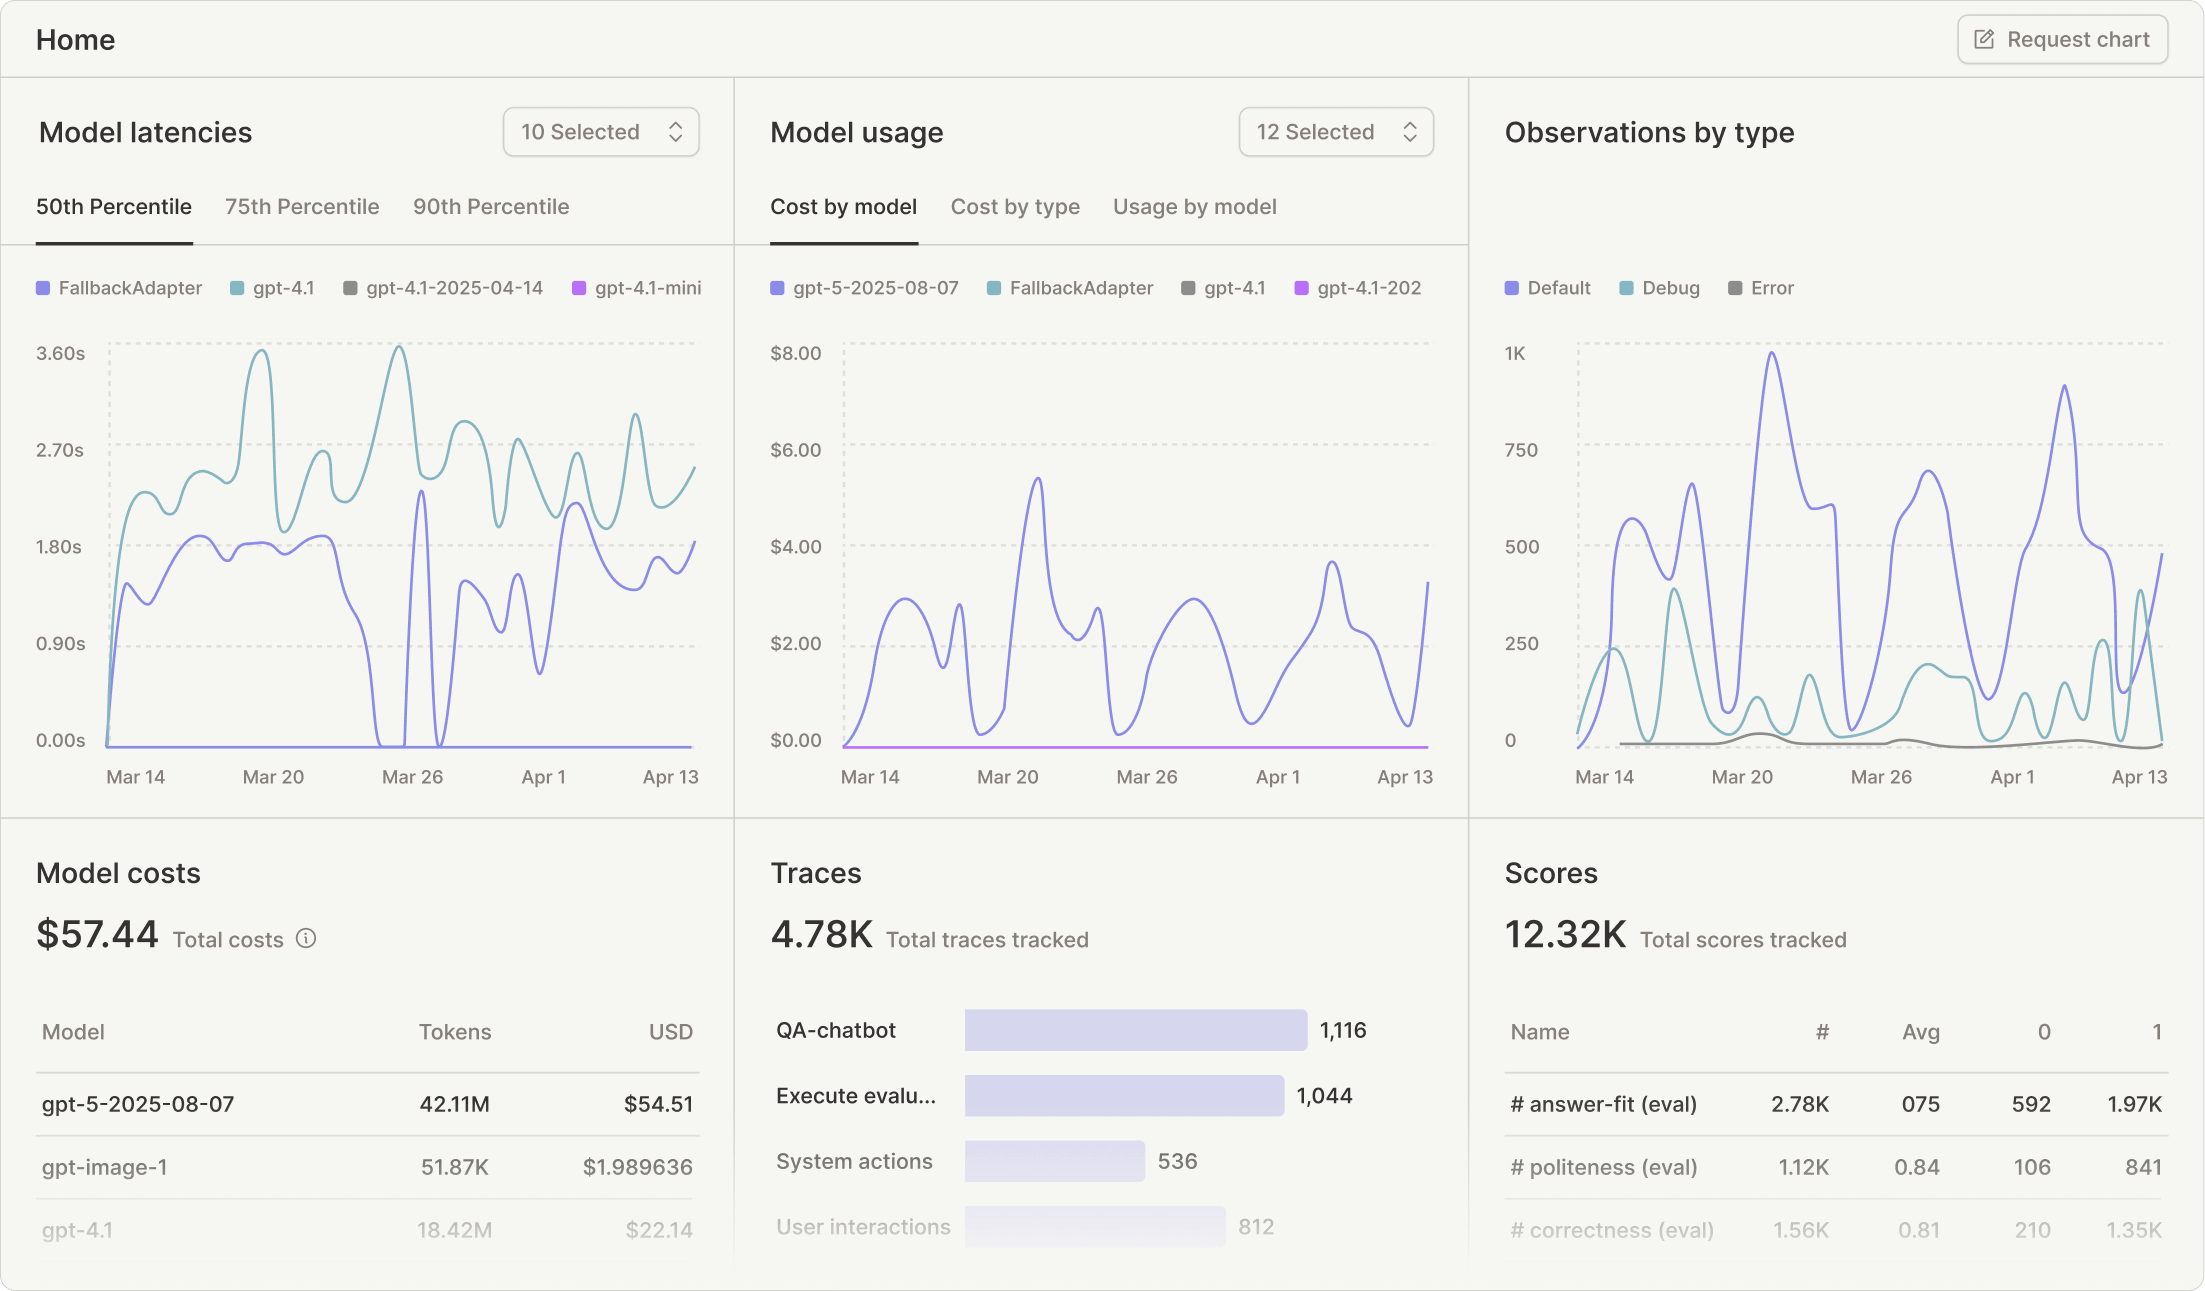
Type: Open-source LLM engineering platform · Price: Free tier, Core $29/mo
Langfuse is an open-source LLM engineering platform covering tracing, prompt management, datasets, and evaluation, with an MIT-licensed core you can run on your own infrastructure. Online evaluation runs LLM-as-a-judge against live production traces, and monitors can alert on scores as well as operational metrics, so a quality regression can reach someone without a second tool.
The tradeoff for open source is operational. Running it yourself means operating its database and storage services in production, which suits a platform team better than a small one and can push smaller teams toward the managed cloud. It also doesn't route model traffic, so routing and fallbacks sit in a separate system, which is one of the main differences among the Langfuse alternatives worth comparing.
Pricing: Hobby is free with 50k units and 2 users. Core is $29 per month for 100k units with unlimited users, Pro is $199, and Enterprise is $2,499. A unit is a trace, an observation, or a score, so scoring more of production costs the same as recording another step.
Best fit: teams that want open-source tracing and evals with the option to self-host.
3. LangSmith
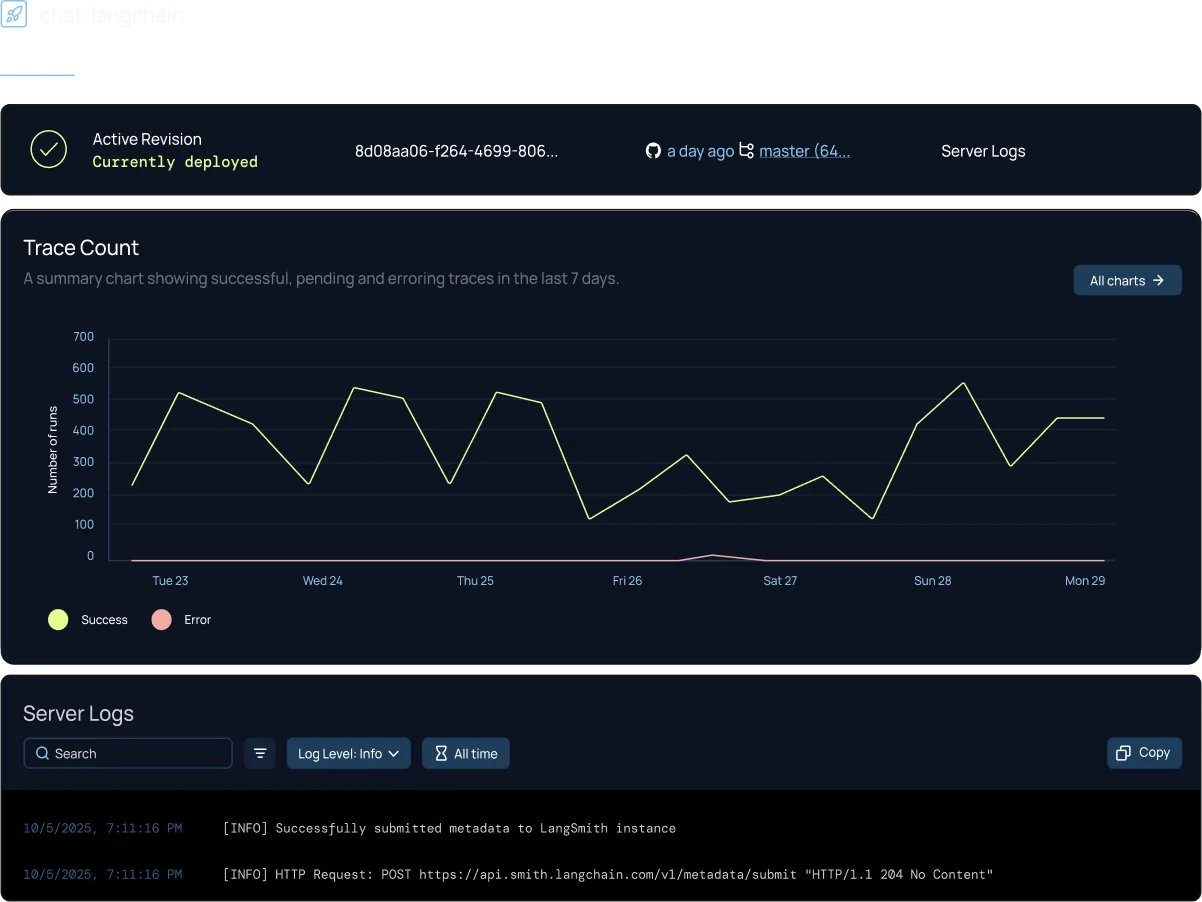
Type: Observability and evaluation platform · Price: Free tier, $39/seat/mo
Built by the LangChain team, LangSmith covers tracing, datasets, evaluation, annotation queues, and a prompt hub. For teams on LangGraph it adds a development environment where you visualize the graph, set breakpoints, modify state mid-run, and resume from a checkpoint.
It traces any framework through a wrapper and supports OpenTelemetry, though the detail can be thinner outside LangChain and LangGraph, so adopting it is partly a bet on the framework. Seats and traces meter separately, so the bill tracks team size independently of usage. Base traces are also kept for only 14 days, which means reviewing an incident a few weeks later may require traces you paid to move to extended retention, and that pricing shape is one of the primary reasons people compare LangSmith alternatives.
Pricing: Developer is free with one seat and 5k base traces a month. Plus is $39 per seat per month with 10k base traces, then pay-as-you-go, and extended 180-day retention costs extra. Self-hosting is only available on Enterprise, which is custom.
Best fit: teams whose stack is LangChain today and will still be LangChain in two years.
4. Arize
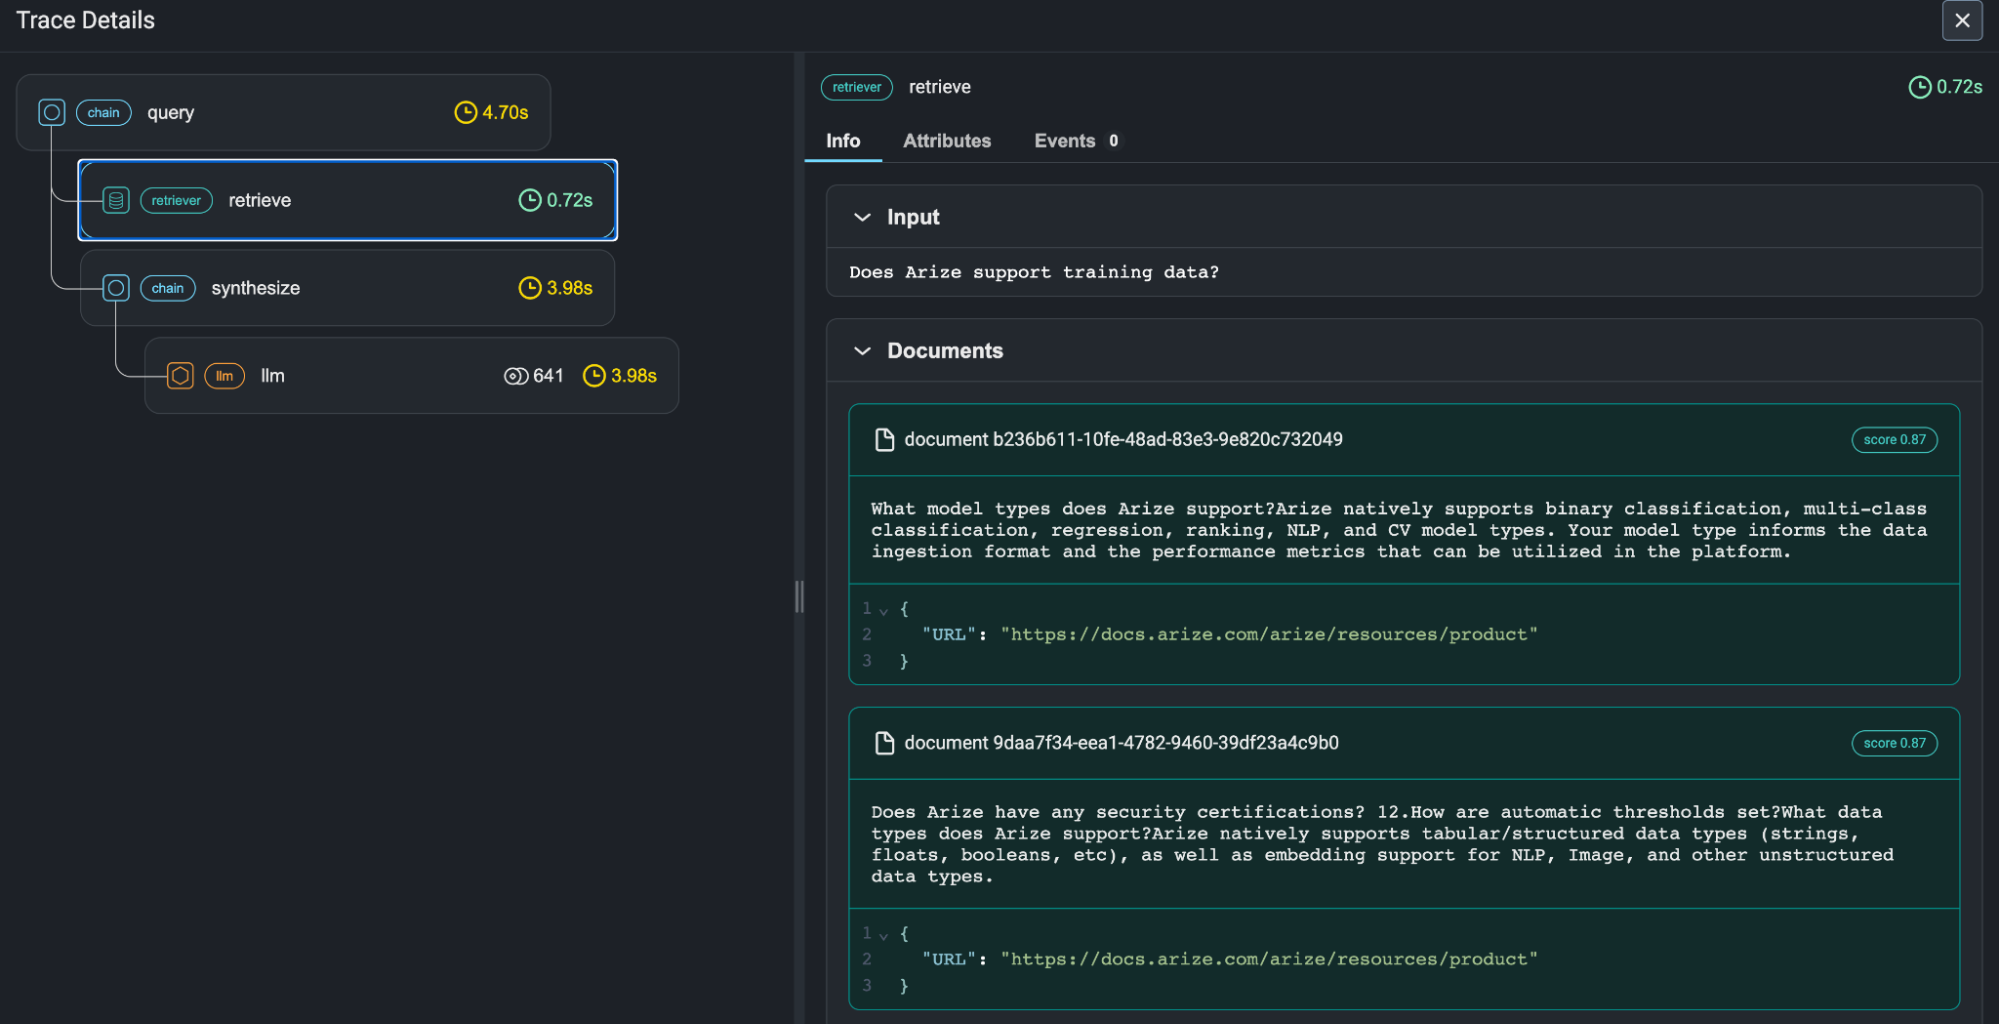
Type: ML and LLM observability platform · Price: Phoenix free, AX from $50/mo
Arize comes from classical ML monitoring and extended into LLM and agent workloads through two products. Phoenix is the open-source library, built on OpenTelemetry and OpenInference, that runs in a notebook, locally, or in Docker, which makes it useful during development. Arize AX is the managed platform, with online evals on traces included on every tier, prompt versioning, and custom monitors.
The constraint on AX is volume. The free tier includes 25k spans a month with 15-day retention and Pro includes 50k with 30 days, and since a single agent run can produce dozens of spans, those allowances can go quickly once agents run at production scale.
Pricing: Phoenix is free to self-host. AX Free covers 25k spans and 15-day retention, AX Pro is $50 per month for 50k spans and 30-day retention, and AX Enterprise is custom, with self-hosting available.
Best fit: organizations running classical ML alongside LLM workloads that would rather not add a second vendor.
5. Braintrust
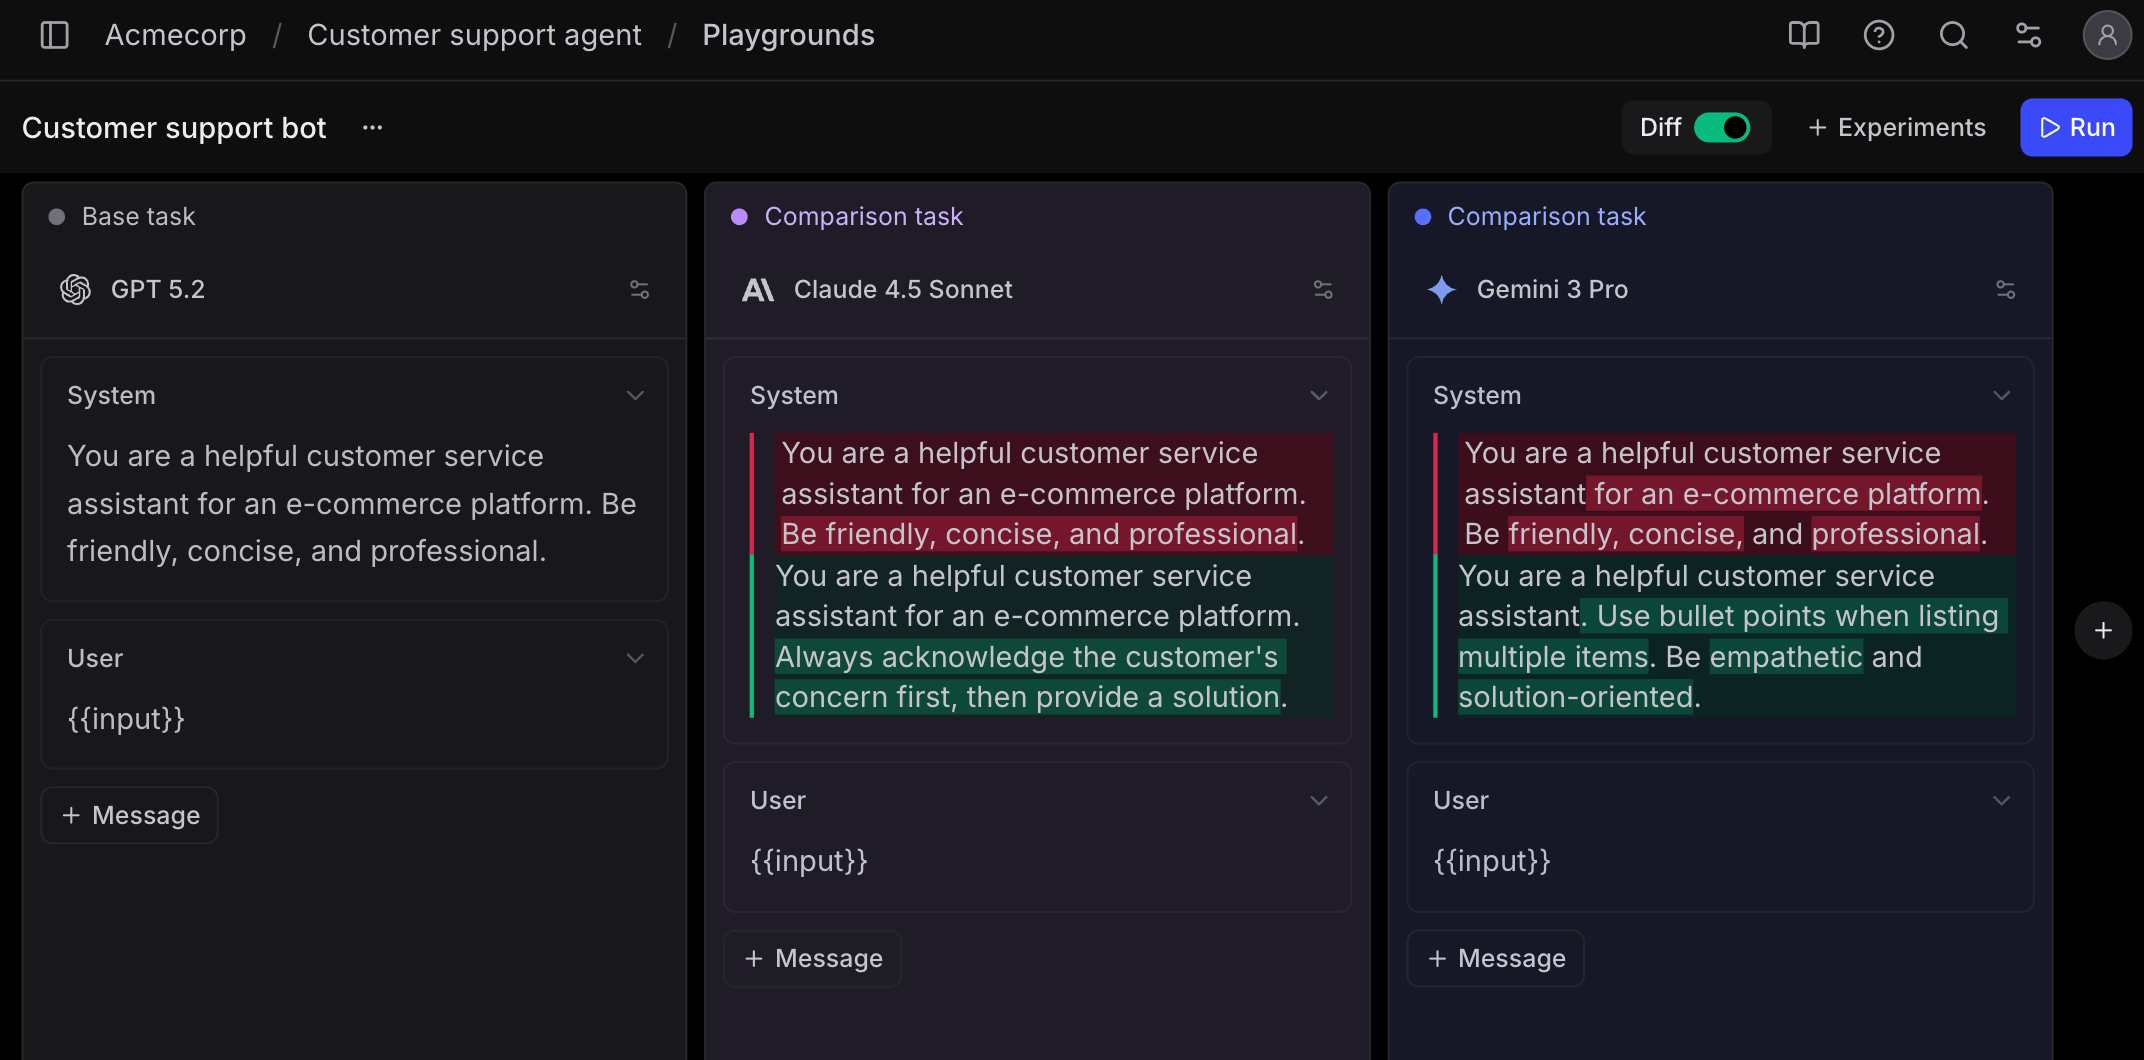
Type: Evaluation-first platform · Price: Free tier, Pro $249/mo
Evaluation is the center of Braintrust. Datasets, scorers, experiments, and regression comparisons are all first-class, and scores from LLM-as-a-judge, autoevals, or custom code can run against production logs as well as test sets. It also has a gateway for routing calls across providers.
Tracing exists to feed the eval workflow, so it is less developed than in platforms built for production debugging, which is the tradeoff at the center of most comparisons with Braintrust alternatives. Pricing meters on processed data and scores rather than seats, and eval volume can grow with the size of your test suite rather than with traffic, so the tier escalation might arrive earlier than what your team is planning for.
Pricing: Starter is free with 1 GB of processed data, 10k scores, and 14-day retention. Pro is $249 per month with 5 GB, 50k scores, and 30-day retention, plus overage on both. On-prem or hosted deployment is Enterprise only.
Best fit: teams where eval discipline is the constraint.
6. Galileo
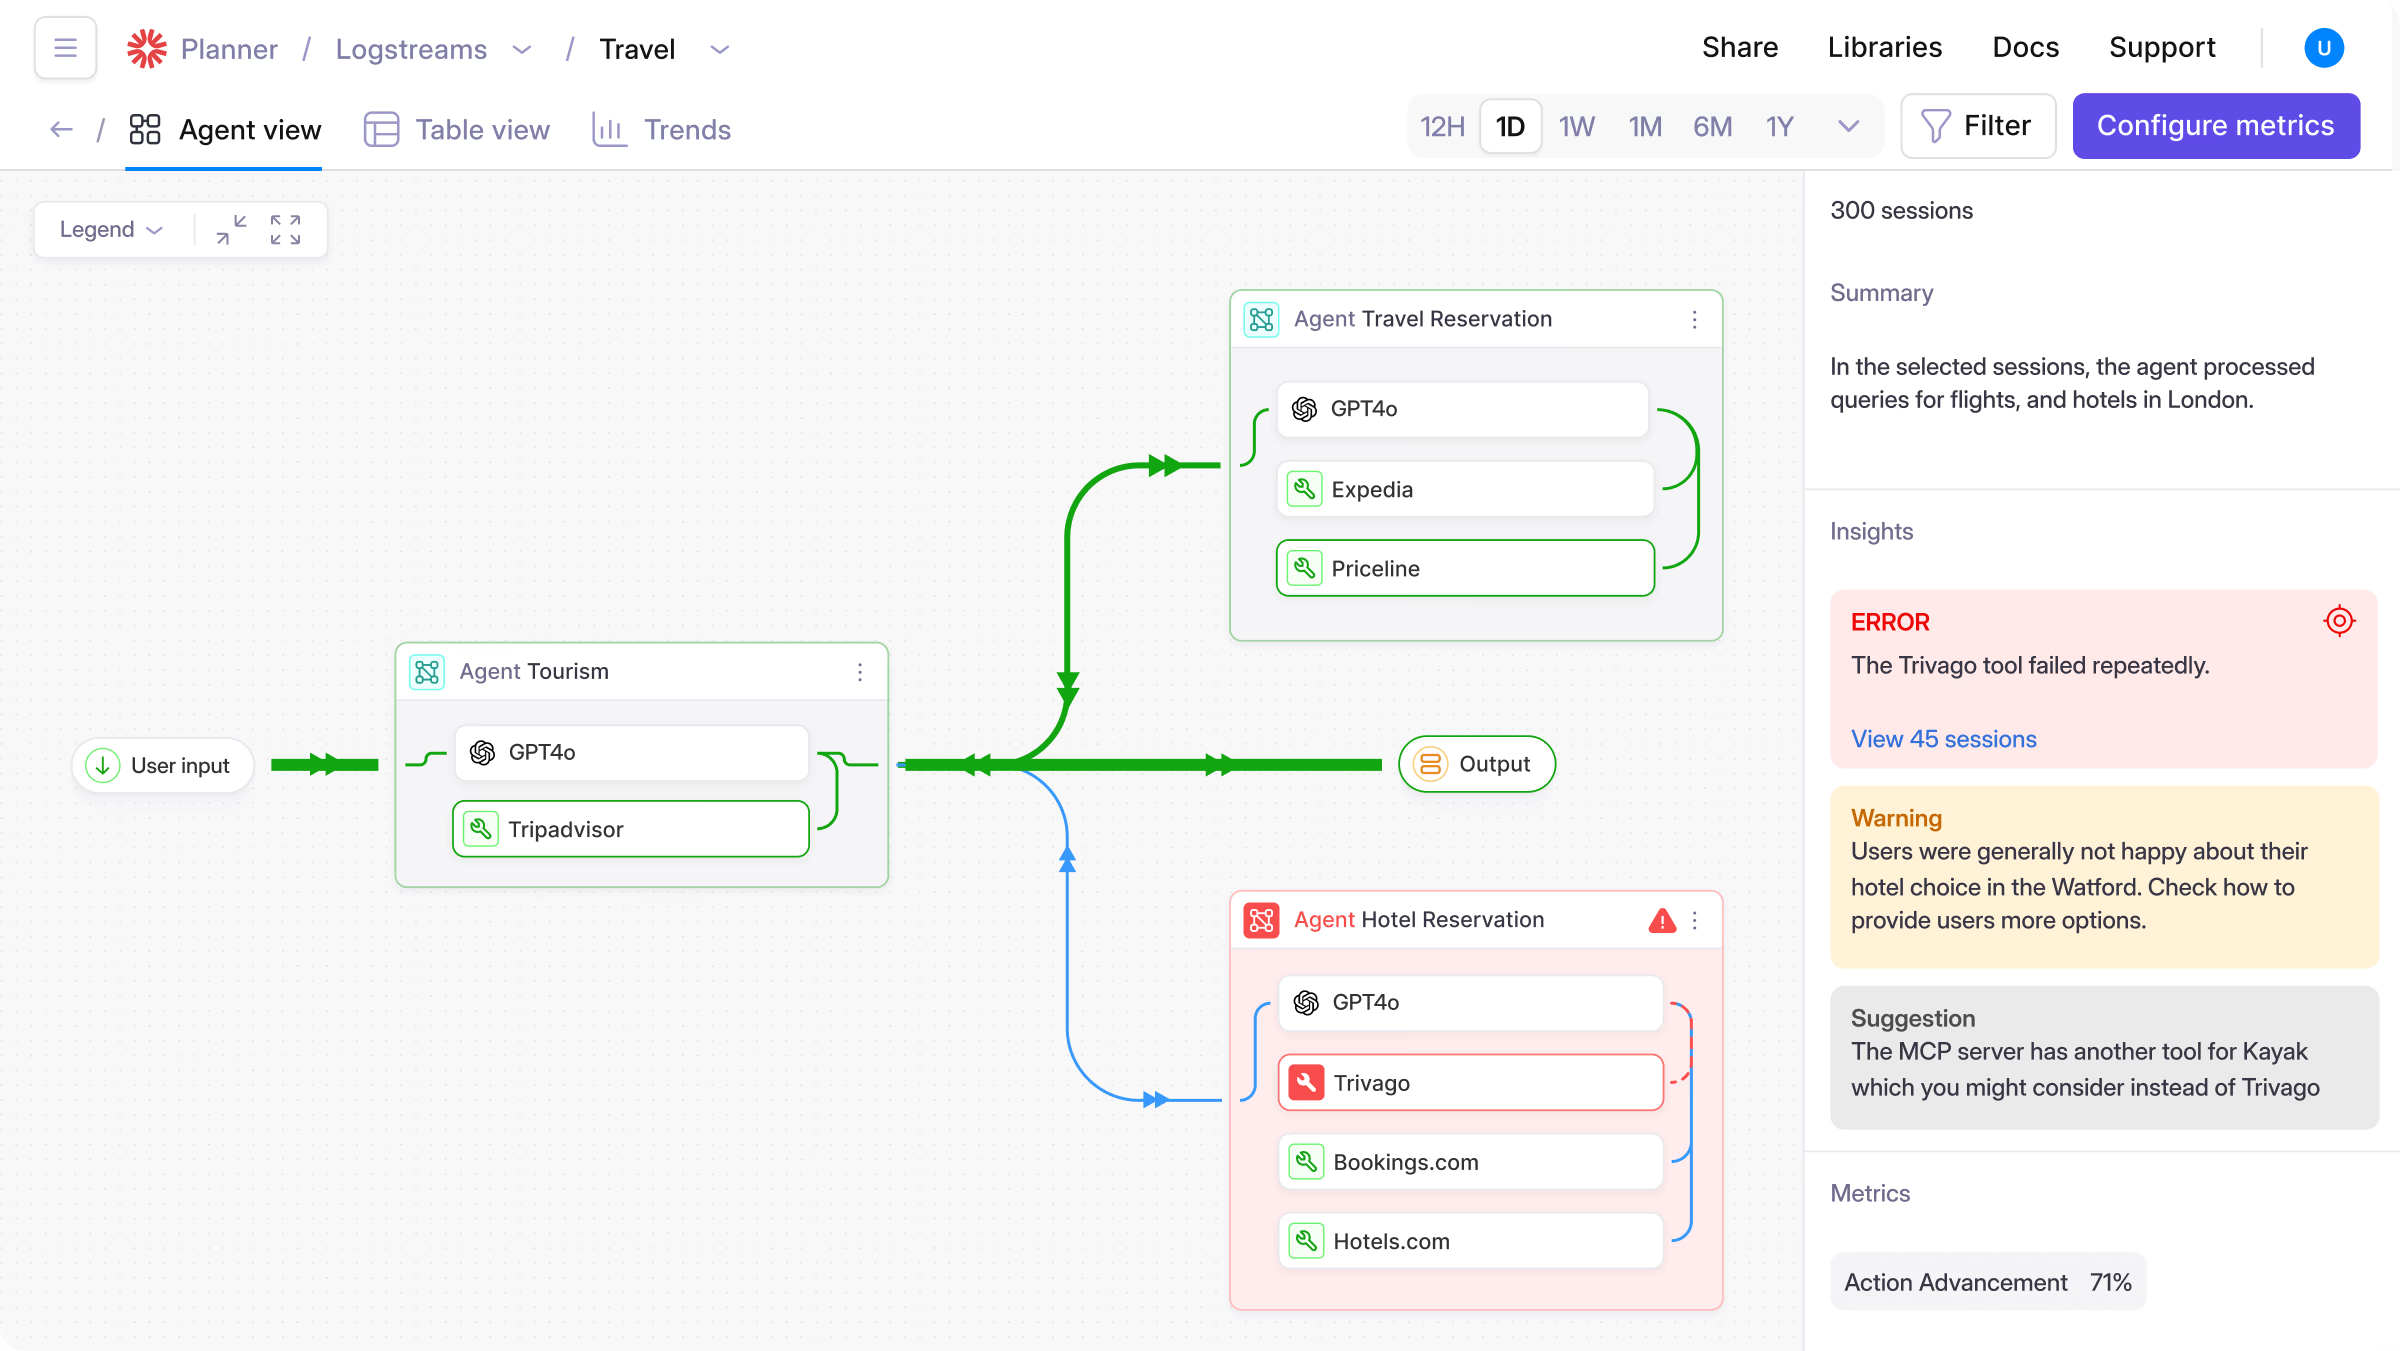
Type: Evaluation and guardrails platform · Price: Free edition, from $100/mo
Galileo focuses on evaluation and guardrails, using its Luna evaluation models to score outputs and turn offline evals into production guardrails. Following Cisco's acquisition, the product is now sold as Splunk Agent Observability, so pricing, procurement, and support run through Splunk.
That makes it a natural fit for organizations already buying from Splunk, and a heavier purchase for a small team that mainly wants to trace an agent, since paid plans bill annually on span volume.
Pricing: A free edition is available. Paid plans start at $100 per month per 1.2 million spans, billed annually, with an allowance of Luna tokens and add-ons for extended retention. It deploys in Splunk Observability Cloud or self-hosted.
Best fit: teams on Splunk that want evals and guardrails in the same purchase.
7. Fiddler
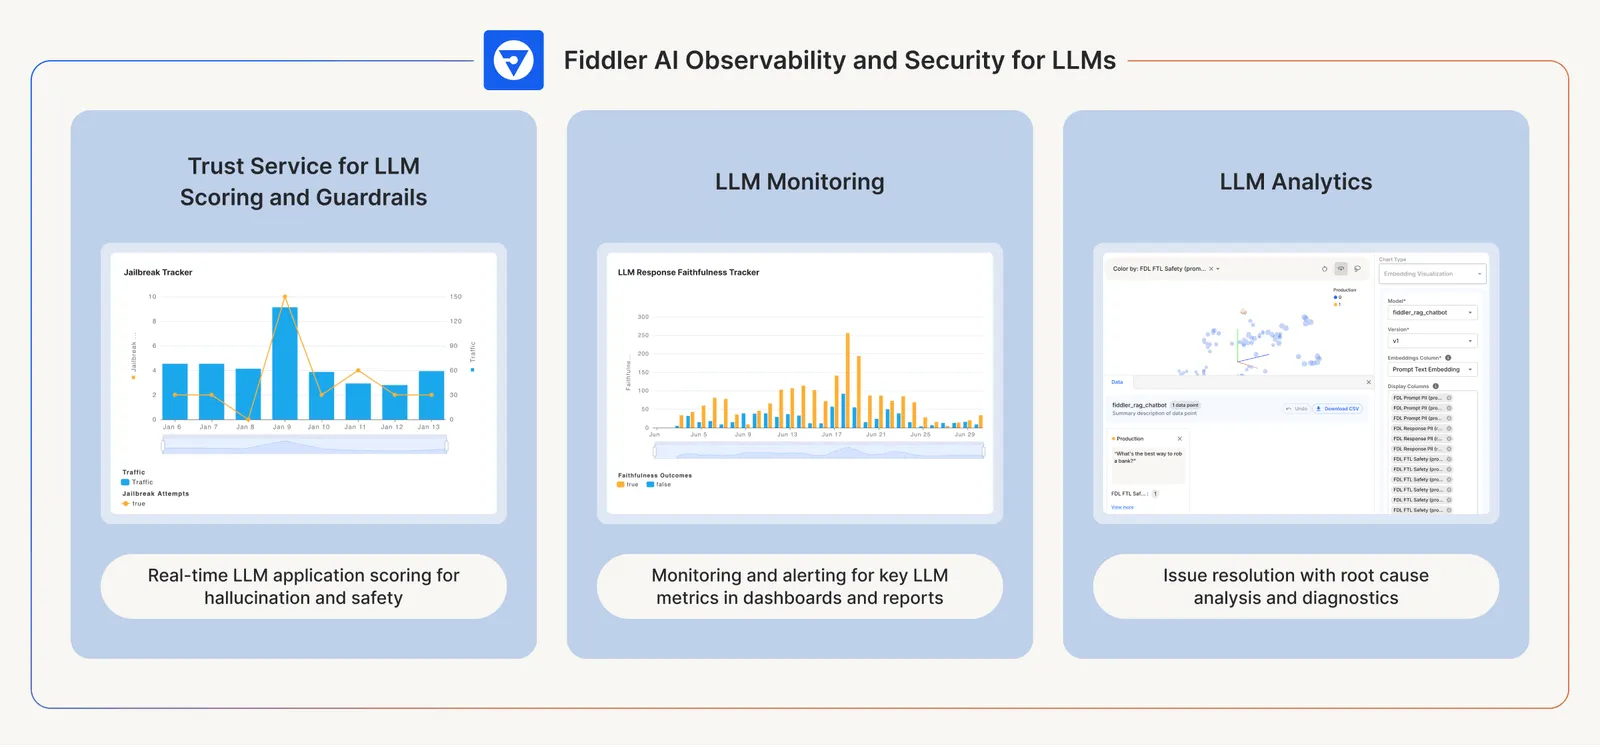
Type: Guardrails, monitoring, and explainability platform · Price: Free tier, $0.002 per trace
Fiddler pairs model monitoring with explainability and runtime guardrails. The free tier covers guardrails against hallucinations, toxicity, PII and PHI exposure, prompt injection, and jailbreaks, and the paid Developer plan adds observability, custom evaluators, RBAC, and SSO.
Its explainability heritage comes from classical ML, and the product invests more in governance and risk than in the developer workflow around agent tracing and debugging. Per-trace pricing scales with request volume rather than with how many steps each run takes, which keeps the cost of long agent runs predictable.
Pricing: Free for guardrails. Developer is $0.002 per trace on SaaS. Enterprise is custom and adds VPC or on-premise deployment.
Best fit: financial services, healthcare, and other settings where model decisions need defending to an auditor.
8. Datadog
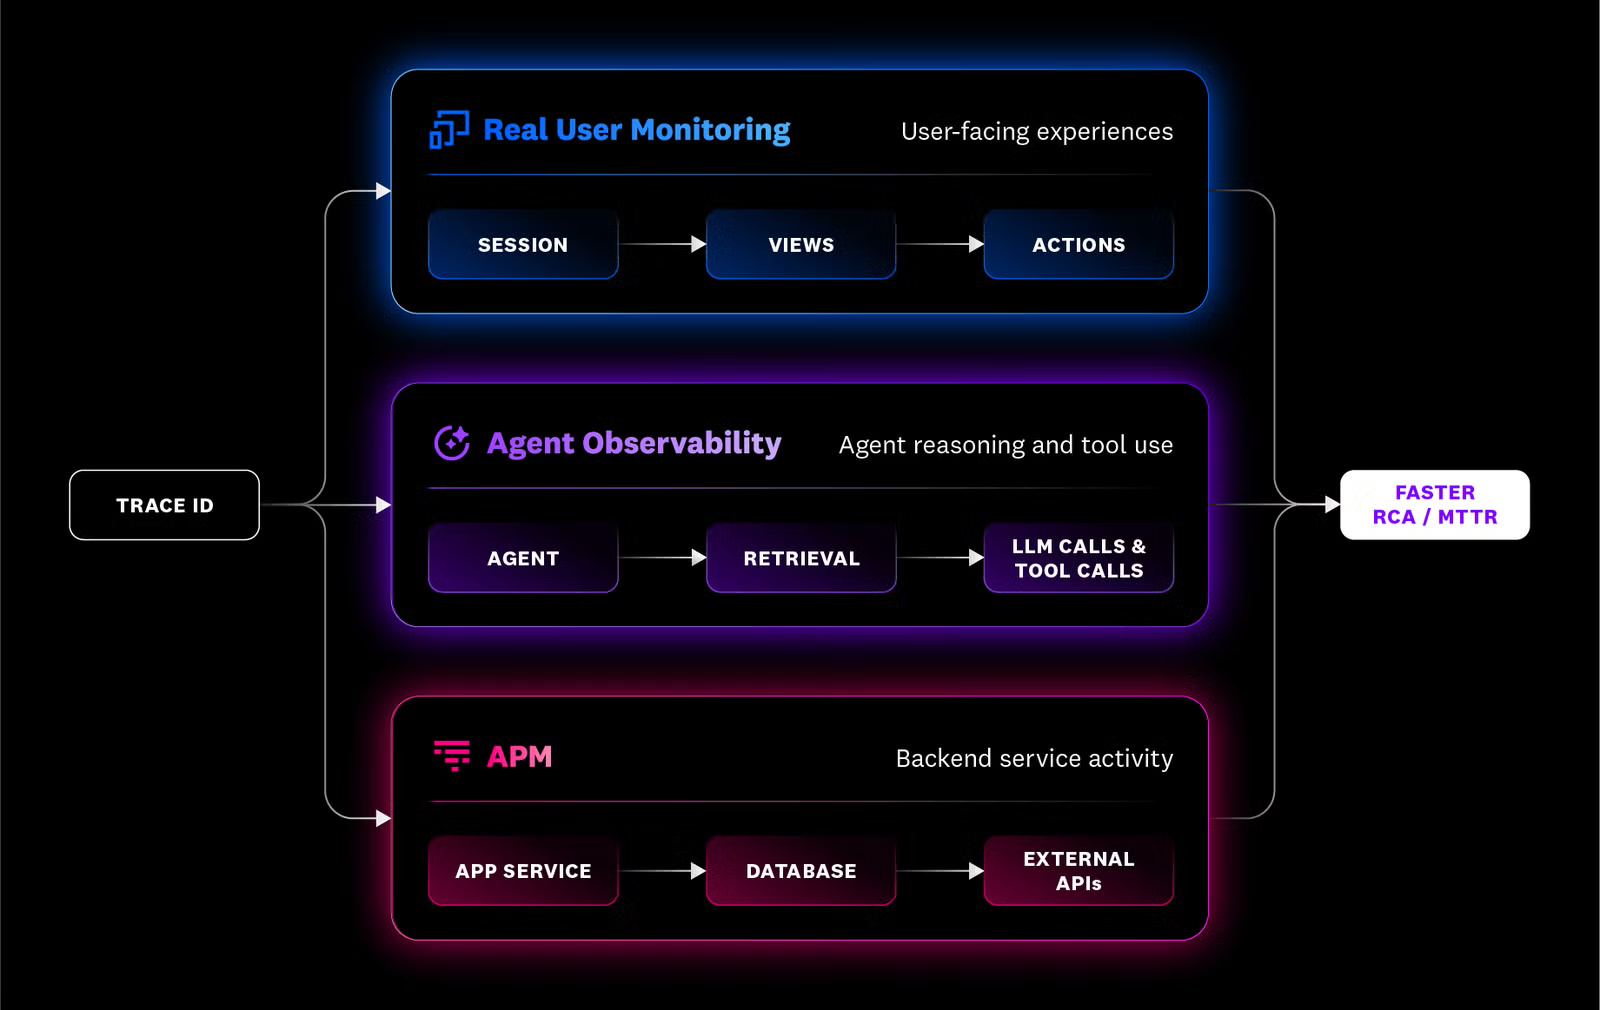
Type: APM platform with an agent observability module · Price: Free tier, Pro $160/mo
For teams already on Datadog, its Agent Observability product (formerly LLM Observability) correlates LLM and agent spans with the rest of your APM traces, so a slow agent caused by a timing-out database shows up in one view. It includes built-in evaluators and custom LLM-as-a-judge evaluations that run across traces and spans.
The pricing detail worth knowing is that evaluators draw from the same span quota as production traffic, so scoring more of your traffic uses up the allowance faster. Other Datadog products bill separately on top, and that cost structure is a common reason teams look at Datadog alternatives.
Pricing: Free covers 40,000 LLM spans a month. Pro is $160 per month for 100,000 spans, with on-demand usage above that and retention add-ons billed separately.
Best fit: teams already standardized on Datadog that want agent telemetry next to their infrastructure data.
9. MLflow
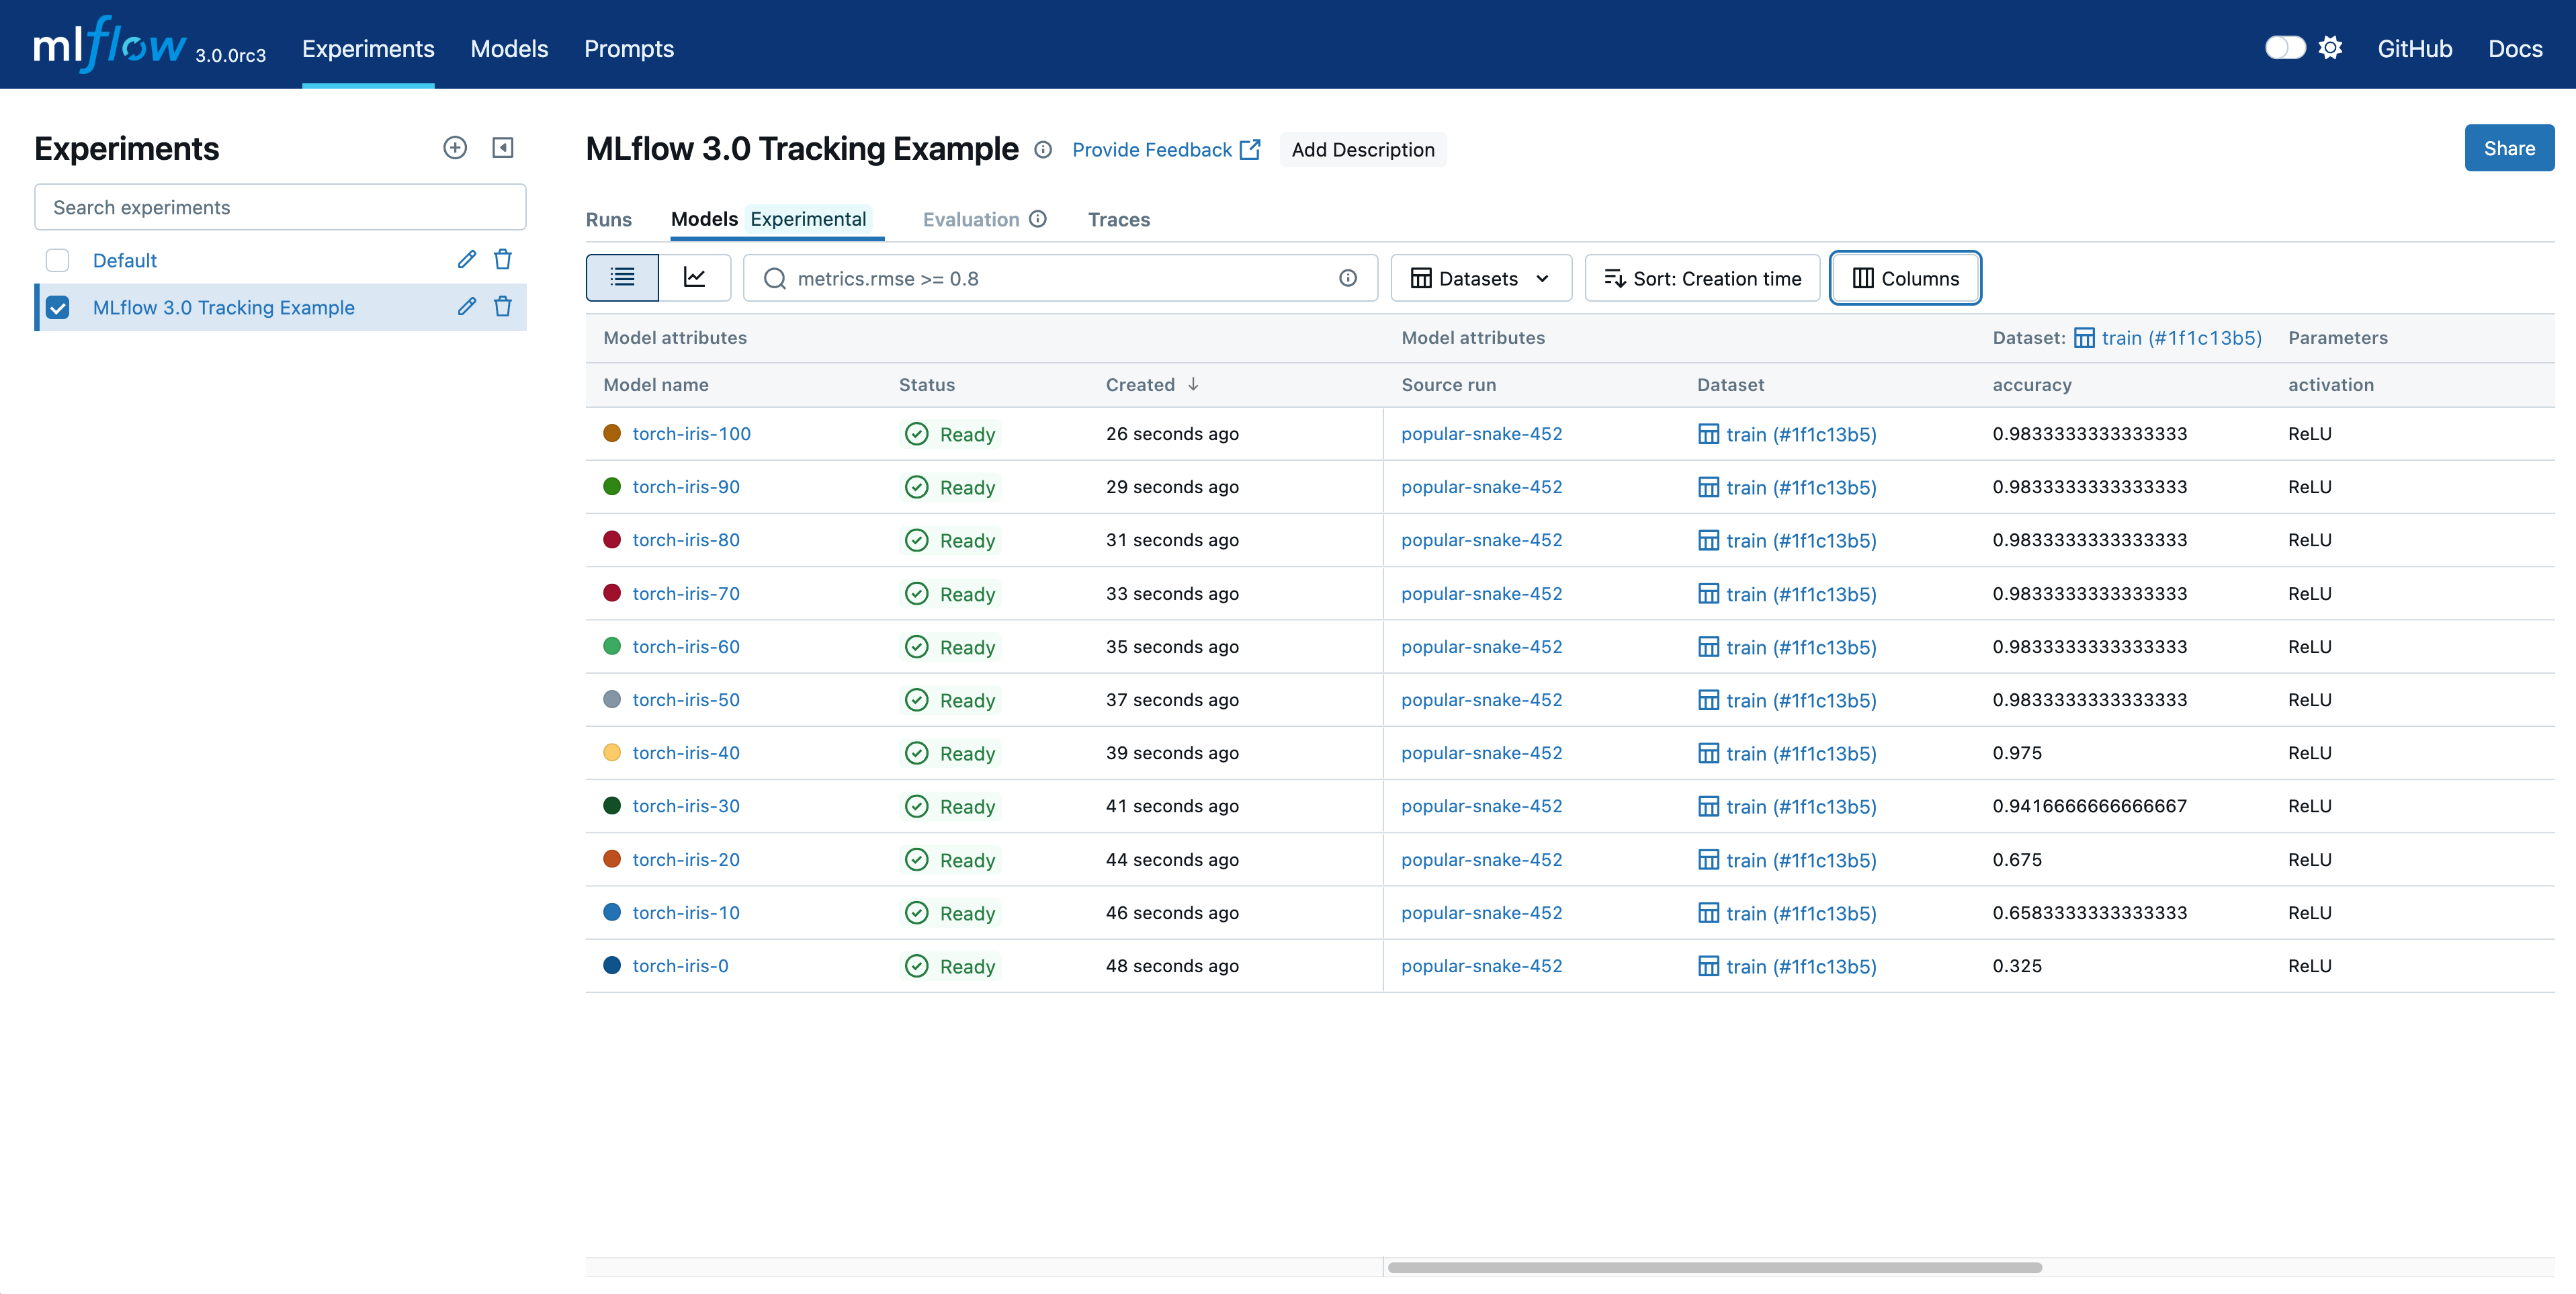
Type: Open-source ML and GenAI platform · Price: Free to self-host
MLflow is an open-source ML platform under the Linux Foundation that extended into GenAI with tracing, evaluation, a prompt registry, and an AI gateway. Tracing is OpenTelemetry-compatible with native support for the GenAI semantic conventions, LLM judges come prebuilt for metrics like hallucination and relevance or can be written custom, and the gateway handles routing, traffic splitting, and fallback chains.
Self-hosting is free, but your team operates the tracking server, the backend database, and the artifact store. The managed path runs through Databricks, where usage bills through the platform's compute units, which suits teams already on Databricks more than teams starting fresh, and the MLflow alternatives mostly trade that operational work for a hosted product.
Pricing: Free and open source to self-host. Managed MLflow on Databricks bills through Databricks compute units.
Best fit: ML teams already on MLflow or Databricks that are adding agent workloads.
10. Confident AI
Type: Evaluation platform from the DeepEval team · Price: Free tier, Starter $200/mo
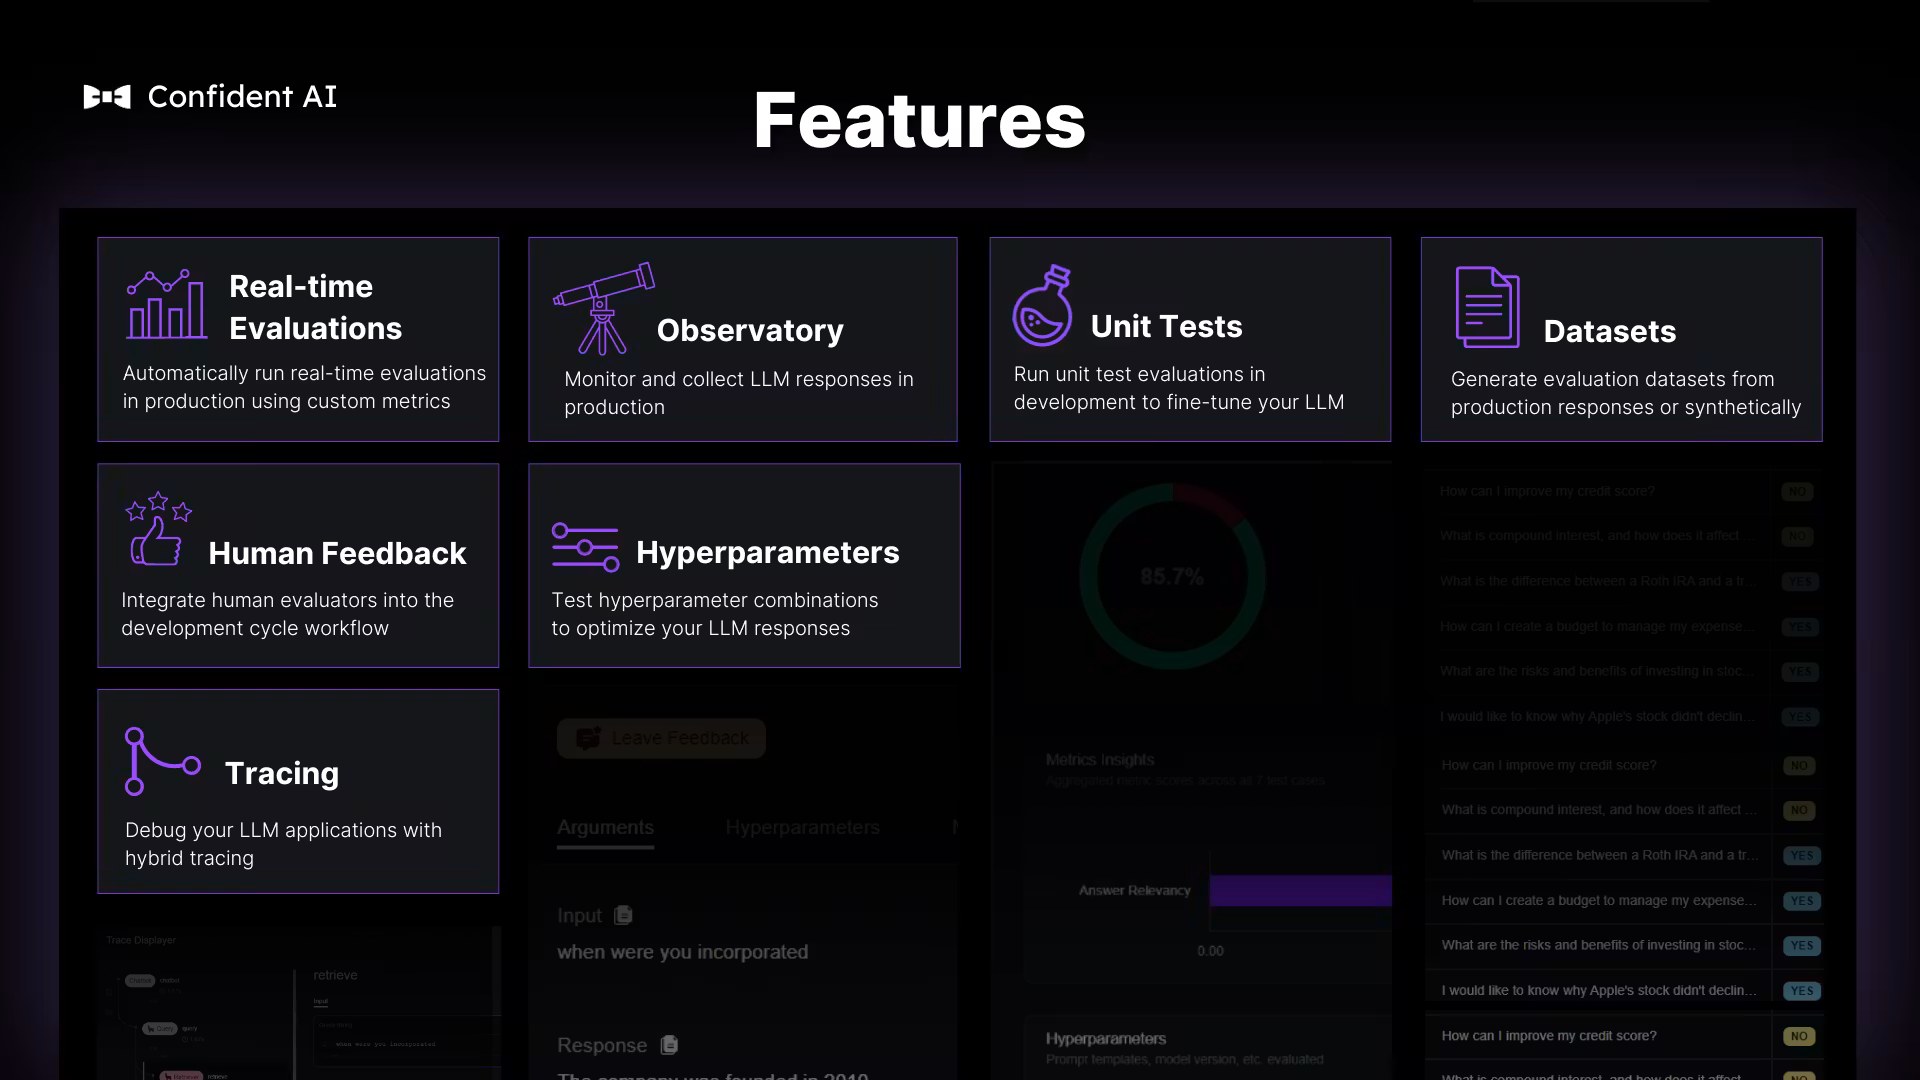
From the team behind DeepEval, the open-source LLM evaluation framework, Confident AI is the hosted platform that adds tracing, prompt versioning, regression testing, custom metrics, and real-time alerting on top. For teams that already write DeepEval tests, it moves the same metrics into a shared workspace.
Pricing is a flat monthly fee per organization rather than per seat, and the jumps between tiers are what to plan around. Real-time alerting starts on Starter at $200 per month, while SSO, RBAC, and SOC 2 arrive on Team at $2,000 per month, so a team with security review requirements might need the higher tier sooner than its traffic does.
Pricing: Free covers 2 seats, 1 project, and 1 GB-month of spans, with extra spans dropped and 5 test runs a week. Starter is $200 per month with unlimited seats and 5 projects. Team is $2,000 per month. Enterprise adds on-prem deployment and HIPAA.
Best fit: teams already using DeepEval that want hosted dashboards and alerting.
How to Choose an AI Observability Platform
Shortlisting goes faster when you start from your agents and your constraints rather than from feature lists:
- Start with the run you need to debug - Pick a recent agent failure and check whether each platform could have shown you the step that caused it. A platform that only sees individual requests won't.
- Decide where scoring happens - If quality checks only run on test sets, you'll catch the regressions you predicted. Live scoring on sampled production traffic is what catches drift and edge cases.
- Check what your data requires - PII in prompts, regulated customers, and data residency rules narrow the field before features do, so confirm certifications, masking, and retention controls early.
- Decide whether routing is in scope - With one provider, it isn't. With several, a platform that also routes keeps the model decision and the trace in one record.
- Model cost on span volume - Agents produce many spans per run, and plans meter spans, traces, scores, seats, or processed data. Price each shortlisted platform at the volume your agents will generate rather than the volume of your pilot.
- Check who needs to read the output - If only engineers can interpret traces and scores, every quality question waits on engineering, while shared views and readable eval results spread that work across the team.
Whichever way that lands, run a pilot on real production traffic before committing, since trace fidelity and cost at volume are hard to judge from a pricing page. If your workload is mostly single LLM calls rather than agents, or you want an open-source tool you run yourself, LLM observability tools are the better place to start.
FAQ
What Are AI Observability Tools?
AI observability tools capture, monitor, and score what AI systems do in production. For agents, that means recording each run as a connected trace of model calls, tool calls, and retrievals, then evaluating the output and tracking cost and latency alongside it. They differ from application monitoring by treating the content of a response as something to measure rather than an opaque payload.
What's the Best AI Observability Platform for Agents?
The best platform for agents is one that traces the full multi-step run, scores output on live traffic, and attributes cost down to the feature or customer, ideally without stitching tools together. Respan does all of that on one platform, with routing built in so the model that served each request is part of the same record. If your team is already standardized on a platform like Datadog or LangSmith, the native option can be the shorter path, as long as it covers live evaluation.
How Is AI Observability Different From APM?
APM monitors infrastructure: latency, error rates, throughput, and resource use. AI observability monitors what the system produced and how it got there, so it can show which step of an agent run made a bad decision even when every service it touched stayed healthy. It's common to keep APM for infrastructure and add an AI observability platform for output quality, and some APM vendors, Datadog among them, now offer agent-focused products that sit between the two.
Does an AI Gateway Replace an AI Observability Platform?
Not on its own. A gateway sees requests passing through it, which gives you cost, latency, and model usage, but it doesn't see the reasoning between calls in an agent run and doesn't evaluate output quality. Platforms that combine both, like Respan, keep the record of which model served a request together with how that request performed.