
Datadog charges per host. It counts a host at your peak for the month, discards the top 1% of hours, and bills the rest at that number. Scale to 200 nodes for a five-day launch and the whole month prices at 200 nodes, for infrastructure and APM both.
That is one meter. There are five more. Logs bill on gigabytes ingested and again on millions of events indexed. Custom metrics come with 100 per host and every unique tag combination past that is a new billable metric. Containers are allotted five per host. LLM spans have their own tier, and the evaluators you run to check output quality draw from the same 100,000 spans your users do.
Most teams don't leave Datadog because it's expensive. They leave because they can't tell you in advance what next month costs, and because the thing they most need to see in 2026, what an agent actually did between the request and the response, is the meter Datadog prices hardest.
The 16 alternatives below are ranked by how much of Datadog each one replaces.
What Is Datadog?
Datadog is a SaaS observability platform that collects metrics, logs, traces, and events from across your infrastructure and correlates them in one interface. It began as infrastructure monitoring and expanded outward into APM, log management, real user monitoring, synthetics, security, CI visibility, and most recently AI agent tracing. Over 1,000 integrations mean most stacks can standardize on it without custom collection work.
The architecture is first-party. The Datadog Agent runs on each host, ships telemetry to Datadog's backend, and every product reads from the same store, which is why correlating a slow endpoint to a database timeout takes no additional wiring. It also accepts OTLP, so OpenTelemetry instrumentation flows in alongside the Agent.
What Does Datadog Do?
Datadog covers the signals a platform team needs across cloud-native and hybrid environments:
- Infrastructure monitoring across hosts, containers, Kubernetes, serverless, and cloud services
- APM with distributed tracing, service dependency mapping, and code-level profiling
- Log management with ingest, indexing, and archive-to-S3 with ad-hoc rehydration
- Real user monitoring, session replay, synthetics, and mobile app testing
- Cloud SIEM, workload protection, and code security
- Agent Observability for LLM and agent traces, with evaluations and experiments
- Watchdog anomaly detection and Bits AI agents for automated investigation
Datadog Pricing
Six meters run at once and none of them are expressed in the same unit:
- Infrastructure - Free covers 5 hosts at 1-day retention. Pro is $15 per host per month billed annually, $18 on demand. Enterprise is $23 and $27.
- APM - $31 per host with Infrastructure attached, $35 for APM Pro, $40 for APM Enterprise. Standalone, without Infrastructure, it is $36, $41, and $47.
- Logs - $0.10 per GB ingested, plus $1.70 per million indexed events at 15-day retention. Flex Storage runs $0.05 per million events stored for long-term retention without rehydration.
- Custom metrics - 100 per host on Pro and 200 on Enterprise, with overage rates unpublished. Metrics are counted hourly and averaged monthly across the whole account rather than per host.
- Containers - Past the allotment, $0.002 per container-hour or $1 per container per month prepaid.
- Agent Observability - Free covers 40,000 LLM spans per month. Pro is $160 per month for 100,000, with on-demand usage above that and retention add-ons billed per 10,000 LLM spans.
- AI Credits - $500 per 500 credits monthly, or $1.30 per credit on demand. Credits reset each month and do not roll over.
None of these meters share a unit, which is why nothing in your usage forecasts the bill. Hosts move with peak node count while logs move with verbosity, and neither one tells you anything about custom metrics, which move with tag cardinality nobody is tracking. So the levers fight each other. Sampling traces harder cuts your APM ingest, and it also blinds the debugging you bought APM for.
16 Best Datadog Alternatives & Competitors
The list runs from platforms that replace the most of Datadog down to the ones that cover a single layer.
| Tool | Deployment | Bills on | Starting price | Best for |
|---|---|---|---|---|
| Respan | Cloud | Logs and scores | Free, then $199/mo | Production traffic that runs through models |
| New Relic | SaaS | Data ingested and seats | Free with 100 GB/mo | Container-dense clusters on small teams |
| Dynatrace | SaaS, managed, self-hosted | Memory-GiB-hours | $58/mo per 8 GiB host | Automated root cause at enterprise scale |
| Grafana Cloud | Cloud, self-hosted, BYOC | Per-signal meters and active users | Free, Pro from $19/mo | Open-source stacks and exit optionality |
| Splunk Observability Cloud | SaaS | Host | $15/host/mo, 15-host minimum | Existing Splunk and Cisco estates |
| Elastic Observability | Serverless, hosted, self-managed | GB ingested and retained | From $0.07/GB | Search-heavy log workloads |
| Honeycomb | SaaS, Private Cloud on Enterprise | Events and metrics data points | Free to 20M events/mo | High-cardinality debugging without seat fees |
| SigNoz | Cloud, self-hosted | GB and metric samples | Free self-hosted, $49/mo cloud | OTel-native teams leaving per-host billing |
| Chronosphere | SaaS | Useful telemetry retained | Custom quote | Enterprises where volume is the problem |
| Coralogix | SaaS with your own S3 | Units across routed pipelines | 14-day trial, then $1.50/unit | Routing data by value before it lands |
| SolarWinds Observability | SaaS, self-hosted | Node | From $8/node/mo | Hybrid estates with on-premises workloads |
| Braintrust | SaaS, on-prem on Enterprise | Processed data and scores | Free, then $249/mo | Eval-driven release gates |
| Arize Phoenix | SaaS, self-hosted | Spans and ingestion volume | Free, Pro $50/mo | Classical ML and LLM in one tool |
| Sentry | SaaS, self-hosted | Error events | Free, then $26/mo | Error tracking for application teams |
| Uptrace | Cloud, self-hosted, on-prem | GB and metric datapoints | 50 GB/mo free, then $0.10/GB | Predictable OTel backend with a hard cap |
| OpenObserve | Cloud, self-hosted | GB ingested and queried | Free self-hosted | Teams that will run their own backend |
1. Respan
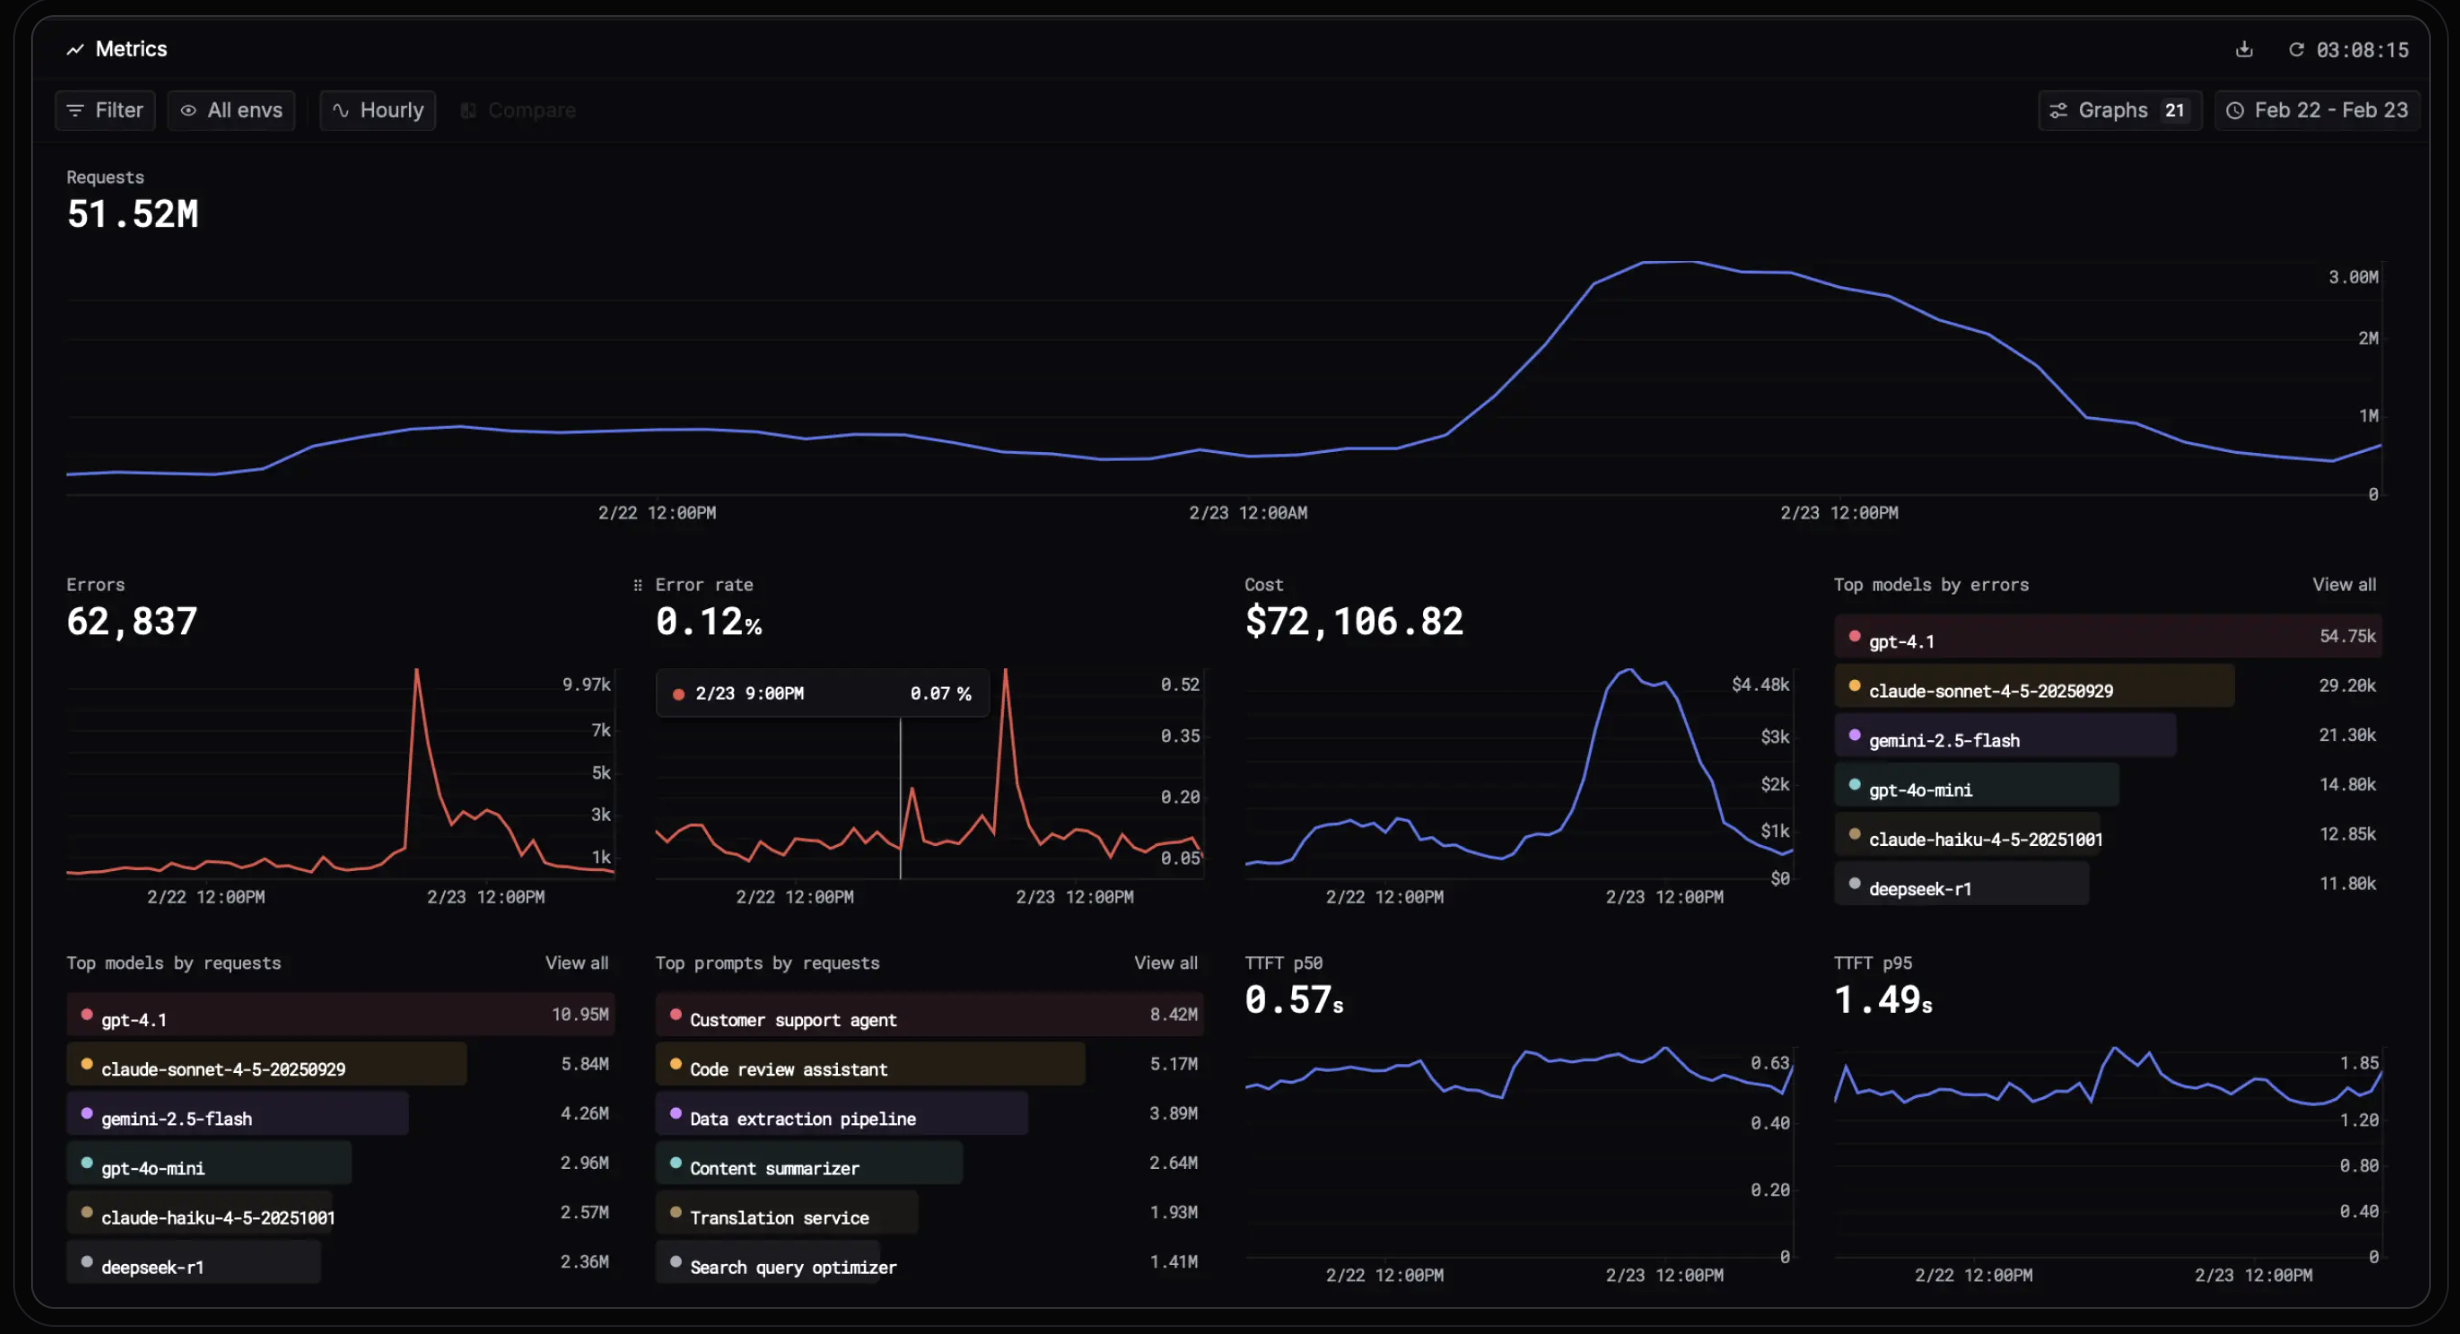
Datadog tells you the call to your model provider took 4.2 seconds and returned a 200. Respan tells you which prompt version produced it, which tool call looped, what the response cost in tokens, and whether the output was actually correct. Every LLM call, tool run, retrieval, and agent turn becomes a span in one trace with input, output, latency, and cost attached, so the number on the dashboard and the run behind it are one click apart.
Respan's gateway is what makes that arrive without an instrumentation project. One OpenAI-compatible endpoint reaches 1,000+ models, adding roughly 30-40ms of latency, and every request through it is logged and traceable from the first call. Route, observe, and evaluate every LLM call, on one platform instead of four.
What that gets you in production:
- See exactly what an agent did - Full trace trees over every prompt, tool call, and retrieval, searchable by latency, cost, quality, and custom metadata, with production sessions replayable in the playground.
- Measure quality with scores, not vibes - LLM judges, deterministic code checks, and human review compose into evaluators that score live traffic and versioned datasets built from real production traces.
- Know where every dollar goes - Spend broken down by model, key, customer, and workflow, with monitors that alert on breach and hard budget caps that block requests before spend runs away.
- Stay up when a provider degrades - Automatic failover, retries with backoff, load balancing across keys, and request caching, all configured at the gateway rather than in application code.
- Ship prompt changes without guessing - Versioning, a collaborative IDE, one-click deployment, and side-by-side experiments, so a quality regression maps to the change that caused it.
- Catch failures before customers report them - Error spikes grouped into incidents by contributing failure, plus behaviors that classify recurring patterns like frustration, jailbreak attempts, and escalations.
- Test what your agents block - Red teaming campaigns probe deployed agents for prompt injection, system-prompt leakage, and goal hijacking, graded by severity.
- Pass the security review - SOC 2, HIPAA, GDPR, and ISO 27001, with PII masking and log omission available.
Pricing: Free covers 100k logs, 1k scores, and unlimited seats at 7-day retention, which is enough to instrument a production agent rather than a demo. Team is $199 per month billed yearly for unlimited datasets, evaluators, and prompts, 10k scores, 30-day retention, and 8,400 requests per minute of proxy throughput.
Trace the model call, not just the host
Datadog shows you the request returned a 200. Respan shows you the prompt version, the tool call, the token cost, and the eval score behind it, on the same platform that routes the traffic. Free to get started.
2. New Relic
Hosts, containers, and agents are free. New Relic does not count them at all, which removes the single variable that drives most Datadog bills in autoscaling environments. What it counts instead is gigabytes ingested and how many engineers hold a full platform seat, with metrics, logs, traces, and events all landing in one store called NRDB and queried through NRQL.
That trade lands well for large deployments and badly for large teams. Standard caps at five full platform users, and the sixth engineer joining an on-call rotation forces a jump to Pro at $349 per seat annually. The other constraint is specific to AI workloads: LLM traces carry prompt and completion payloads that are large relative to typical spans, so ingest becomes harder to forecast exactly where teams need it most.
What it sees:
- APM with distributed tracing and code-level detail on the slow path
- Infrastructure, container, and Kubernetes metrics with no per-host charge
- Logs in context of the trace that produced them
- Browser, mobile, session replay, and synthetic checks
- An errors inbox grouping exceptions against releases
- Applied intelligence for incident correlation and dynamic thresholds
Pricing: Free includes 100 GB monthly ingest and one full platform user permanently, which is the most usable free tier among the full-stack platforms. Past that, data runs $0.40 per GB on Original or $0.60 on Data Plus, and seats run $49 for Core, $99 each up to five on Standard, then $349 on Pro. For a ten-engineer team the seat line dominates well before the data line does. Teams weighing this specific tradeoff should read the full New Relic alternatives breakdown.
3. Dynatrace
OneAgent installs once per host and discovers processes, services, and dependencies without manual configuration, then Davis traces root cause deterministically against that live topology. Where Datadog asks an engineer to query their way to an answer, Dynatrace produces the answer and expects you to verify it. Grail stores logs, metrics, traces, and events in one lakehouse queried through DQL.
OneAgent is proprietary and needs deep host access, so running OpenTelemetry alongside it does not make the deployment portable the way OTLP-first backends are. Billing also rounds to 15-minute intervals with a 4 GiB memory floor per host, which inflates the effective rate on small and ephemeral workloads past the headline number.
What it sees:
- APM with code-level profiling and end-to-end transaction tracing
- Infrastructure across hosts, containers, Kubernetes, and cloud services
- Log analytics with on-read parsing through DQL
- Real user monitoring and session replay across web and mobile
- Runtime vulnerability analytics and application protection
- Automated root cause through the Davis AI engine
Pricing: Everything draws against an unpublished minimum annual commitment at rate-card prices, so the published numbers describe the rate rather than the floor. Full-Stack Monitoring is $58 per month for an 8 GiB host, Infrastructure Monitoring $29, log ingest $0.20 per GiB, and RUM $2.25 per 1,000 sessions. Nothing on the rate card charges per user, which is the cleanest structural answer to a seat-heavy bill. The comparison runs deeper in our Dynatrace alternatives roundup.
4. Grafana Cloud
Mimir for metrics, Loki for logs, Tempo for traces, Pyroscope for profiles, all Apache 2.0 and all runnable on your own hardware at zero license cost. Grafana is the strongest exit guarantee on this list, because the stack that runs on Grafana Cloud is the same stack that runs in your cluster if the commercial relationship goes sideways. Most engineers already know the dashboards.
The cost is operational rather than financial. Mimir, Loki, and Tempo each answer to a different query language, so correlating a metric to a log to a trace means PromQL, LogQL, and TraceQL where Datadog has one search bar. Logs also bill in four separate parts, process, write, retain, and query, with traces and profiles metered on the first three, which makes forecasting harder than a single per-GB rate suggests.
What it sees:
- Metrics, logs, traces, and continuous profiling under one visualization layer
- Kubernetes monitoring, synthetics, and incident response modules
- Agent Observability for LLM generations, with evaluations and guards
- Adaptive telemetry for cardinality control, gated behind the Enterprise commit
Pricing: The free tier is the most generous in the category at 10k active series, 50 GB each of logs, traces, and profiles, and three users. Pro is a $19 monthly platform fee plus usage, with metrics from $6.50 per 1k series and logs at $0.05 per GB process, $0.40 write, and $0.10 retain. Enterprise starts at a $25,000 annual spend commit, which is where the cardinality controls that would have prevented the overage actually live.
5. Splunk Observability Cloud
Splunk Observability Cloud is the SignalFx lineage rebuilt into three per-host bundles under Cisco ownership. Its streaming architecture alerts in seconds rather than on batch cycles, and NoSample tail-based tracing captures full-fidelity traces before filtering rather than sampling at the head. The case for it is consolidation: observability and SIEM investigations share a contract and a vendor.
That case weakens fast if you are not already a Splunk shop. Host-based pricing starts at a 15-host minimum, Database Monitoring and Secure Application bill on top of whichever bundle you pick, and Cisco sells AppDynamics from the same catalog at $6 to $50 per vCPU with heavy overlap. Self-hosting is not available for Observability Cloud, so residency requirements are not solved here.
What it sees:
- Infrastructure, APM, RUM, synthetics, and database monitoring
- Full-fidelity trace ingest without head-based sampling
- Real-time streaming analytics on high-cardinality metrics
- Agent Observability across agents, models, and AI costs
Pricing: Infrastructure is $15 per host per month annually, App & Infrastructure $60, and End-to-End $75, with standalone APM at $55 per host. Synthetics run $1 per 10,000 uptime requests, which prices well against standalone synthetic monitoring tools once you are already paying for hosts. There is no free tier, only a trial.
6. Elastic Observability
Full-text search across logs is the strongest surface here, because Elastic Observability runs on Elasticsearch and inherits its query patterns. Three deployment paths cover most residency requirements, and self-managed carries no license fee at the basic level, which answers the constraint Datadog's SaaS-only architecture cannot. Teams already operating ELK get the shortest migration path on this list.
Elastic meters uncompressed, normalized, enriched volume measured at the end of the ingest pipeline, so billed gigabytes exceed both your raw source data and the resulting index. Estimates built from either come in low. Support above Standard also runs 5% to 15% of total consumption rather than a flat fee.
What it sees:
- Logs, metrics, and traces correlated in one store with Kibana on top
- APM with OpenTelemetry-first ingest and 350+ integrations
- Machine learning anomaly detection across any indexed field
- A dedicated LLM observability product and an Elastic Managed LLM
Pricing: Serverless Logs Essentials starts at $0.07 per GB ingested plus $0.017 per GB retained monthly, with Complete at $0.09 and $0.019. Metrics in time series mode price at 25% of the standard rate for both ingest and retention, which is a real lever if your volume is metrics-heavy rather than log-heavy.
7. Honeycomb
Honeycomb stores wide structured events and derives logs, metrics, and traces from them. A query can filter on user ID, build SHA, or feature flag without anyone having decided in advance that the field mattered, and without the cardinality penalty that makes those same queries expensive as Datadog custom metrics. BubbleUp surfaces which field correlates with an anomaly, and Agent Timeline renders LLM calls, tool invocations, and handoffs in one conversation view.
Check your trace depth before modeling cost. Billing meters events, and a trace with 150 spans counts as 150 events, so instrumentation granularity drives the bill in a way host counts never do. Traditional infrastructure metrics coverage is also thinner than the full-stack platforms above it, and Service Map is Enterprise-only.
What it sees:
- Arbitrary high-cardinality queries with no pre-aggregation or index planning
- Distributed tracing with OpenTelemetry-native ingest and no proprietary agent
- SLOs and triggers, with SLO count capped on Pro
- Agent Timeline for LLM and tool-call sequences
Pricing: Free covers 20M events and 100M metrics data points monthly, and Pro starts at $150 per month for 50M events scaling to 750M. Unlimited seats and unlimited querying on every tier including Free is the direct answer to any seat-gated platform, since the engineer who cannot afford a license is the one who cannot debug production.
8. SigNoz
SigNoz is an OpenTelemetry-native platform backed by ClickHouse, covering APM, logs, metrics, exceptions, and alerts in a single application that runs self-hosted or as managed cloud. Because instrumentation is standard OTel, routing existing collector output to it is a configuration change rather than an agent replacement, and it ships a migration tool that converts Datadog dashboards directly. There is no user-based pricing, no host-based pricing, and no premium rate for custom metrics.
The integration ecosystem is smaller than Datadog's thousand-plus catalog, so more of the collection work falls to you. Running the Community Edition at real volume also means someone on staff who understands ClickHouse operations, and that expertise is what you are actually paying for when you choose Cloud instead.
What it sees:
- APM and distributed tracing with advanced visualization above 10k spans
- Logs, infrastructure, Kubernetes, and container monitoring
- Cloud service correlation across AWS, Azure, and GCP
- LLM observability using OTel GenAI semantic conventions
- Frontend and mobile monitoring with Web Vitals
Pricing: Cloud starts at $49 per month, but that is a usage credit rather than a platform fee, covering roughly 163 GB of logs or traces before per-unit rates apply at $0.30 per GB for logs and traces and $0.10 per million metric samples. Enterprise starts at $4,000 per month, and the Community Edition is free to self-host. Startups under three years old with fewer than 30 employees qualify for $19 per month.
9. Chronosphere
Most telemetry is never queried, and Chronosphere built its product around that observation. The Control Plane aggregates, drops, and samples data before storage, and billing follows the useful data retained rather than raw ingest, hosts, or VMs. For a team whose Datadog bill is driven by volume rather than by capability, that inverts the equation instead of negotiating it.
Nothing about the commercial process is self-serve. There are no published rates, no free tier, and evaluation runs as a two-to-three-week pilot rather than a signup. Palo Alto Networks completed its acquisition in January 2026 and is integrating the platform alongside Cortex AgentiX, so packaging is still settling and standalone terms are worth confirming at quote.
What it sees:
- Metrics, logs, and traces with Differential Diagnosis across time periods
- 100% PromQL compatibility, so existing Prometheus rules and dashboards port over
- A Telemetry Pipeline with 70+ integrations that can feed other backends
Pricing: Custom quote only. The platform bills on useful telemetry retained after Control Plane shaping, using credits as a currency spanning metrics, logs, and traces, and the Telemetry Pipeline is priced separately on raw throughput. The savings are real but conditional: pipe everything through without configuring the shaping and you have bought a different invoice for the same data.
10. Coralogix
Telemetry is processed in flight through the Streama engine and written to your own S3 bucket in open Parquet, which makes retention effectively unlimited and archive queries free of rehydration charges. The TCO Optimizer routes each source to Frequent Search, Monitoring, or Compliance, so a CDN access log and a payment error stop costing the same thing. There are no tiers at Coralogix: RBAC, SAML SSO, audit trail, and 24/7 support come with every account.
Quota is enforced daily, and exceeding it without Pay-As-You-Go enabled blocks ingestion until 00:00 UTC, which is a hard stop rather than an overage. Unused units and tokens expire at term end with no carryover, refund, or credit, so over-committing costs real money in a way under-committing does not.
What it sees:
- Logs, metrics, traces, and RUM with routing by value before storage
- Data landing in your own bucket, with no per-host, per-user, or per-query fees
- An AI Center adding evaluators, guardrails, and token cost tracking
Pricing: Headline rates are $0.42 per GB for logs, $0.16 for traces, and $0.05 for metrics, but billing actually runs on units at $1.50 each, where one unit buys 1.3 GB of Frequent Search logs or 3 GB of Monitoring logs. The two presentations take some reading to reconcile, and the effective rate depends entirely on how aggressively you route.
11. SolarWinds Observability
SolarWinds sells into estates that are part legacy and part cloud-native, which is the segment Datadog serves least comfortably. Coverage spans applications, infrastructure, networks, databases, and digital experience, with network path analysis across SD-WAN, MPLS, ISP, and cloud edges that most of this list does not attempt. Both SaaS and self-hosted deployments are available from the same product line.
The product is built for IT operations and hybrid infrastructure teams rather than for engineers debugging a distributed application, and the AI-era coverage is thinner than the platforms built around traces. Node-based licensing on multi-year contracts is also a different commercial posture than month-to-month SaaS.
What it sees:
- Full-stack telemetry across apps, services, infrastructure, networks, and databases
- AIOps correlation surfacing probable root cause and blast radius
- Hop-by-hop network path performance across hybrid routes
- Database waits, execution plans, and query performance by release
- OpenTelemetry-native ingest with a public API
Pricing: Observability starts at $8 per node per month on multi-year contracts billed annually, with volume discounts on request and a 30-day trial. Self-Hosted allows node allocation across multiple instances, which matters if your estate is segmented by network boundary rather than by team.
12. Braintrust
Evaluation is the product rather than a feature attached to tracing. Datasets, experiments, scoring functions, and regression reports are all first-class in Braintrust, and its GitHub Actions integration fails builds on quality regressions with confidence intervals attached. Scoring composes LLM judges, autoevals, custom code scorers, and human review, running against test sets or live production traces.
It is not a replacement for infrastructure or application observability and does not present itself as one. Billing runs on processed data and scores rather than spans, which counts every byte of inputs, outputs, prompts, metadata, and attachments, so verbose agents and large RAG contexts consume quota faster than request count suggests. SAML SSO, BAA, uptime SLA, and S3 export are Enterprise-only, so compliance drives the tier decision more than volume does.
What it sees:
- Eval datasets, experiments, and side-by-side comparison reports
- Production traces feeding online scoring
- Release gates in CI rather than post-deployment dashboards
Pricing: Starter is free with $10 model credits, 1 GB processed data, and 10k scores at 14-day retention. Pro is a flat $249 per month rather than per seat, with 5 GB then $3 per GB and 50k scores then $1.50 per 1,000. Unlimited users on every tier takes seat negotiation out of procurement entirely.
13. Arize Phoenix
Arize captures AI systems as spans and monitors them for drift and degradation across both classical ML and LLM workloads. Phoenix, the open-source component, runs in a notebook, locally, or via Docker with no external dependencies, which makes it usable during development rather than only after deploy. Instrumentation uses OpenInference, built on OpenTelemetry, covering LangChain, LlamaIndex, Haystack, DSPy, and smolagents.
The evaluation layer is the shallower part of a product built for model monitoring first. Custom evaluators are supported; research-backed built-in metrics for faithfulness and hallucination are not. Billing also runs on two axes at once, spans and ingestion volume, which compounds and makes forecasting harder than a single meter, and retention caps at 30 days below Enterprise.
What it sees:
- LLM and classical ML spans under one schema
- Drift detection, trace clustering, and embedding visualization
- Local-first tracing during development without sending data anywhere
Pricing: AX Free is $0 with 25,000 spans, 1 GB of ingestion, and 15-day retention. AX Pro is $50 per month with 50,000 spans and 10 GB, with additional spans at $0.0008 each and extra ingestion at $3 per GB. Phoenix self-hosted is free, which is the realistic path for teams that want it in the development loop rather than as a production backend.
14. Sentry
If the question you actually ask Datadog every week is which deploy broke checkout, Sentry answers it faster and for a fraction of the price. It captures exceptions with stack traces and breadcrumbs, groups them into issues, and ties them to the release and commit that introduced them, with SaaS and self-hosted both available.
Sentry does not try to be a full replacement. There is no infrastructure monitoring and no host metrics, and its tracing covers transaction performance rather than a correlated view across services, logs, and metrics. Teams running distributed systems generally pair it with something broader rather than swapping Datadog out for it, which makes it a way to cut a bill rather than eliminate one.
What it sees:
- Exceptions with stack traces, breadcrumbs, and release attribution
- Frontend, backend, and mobile errors in one issue stream
- Transaction performance and session replay
Pricing: Developer is free with 5,000 errors and one user. Team is $26 per month billed annually with 50,000 errors and unlimited users, and Business is $80 adding SSO and 90-day data insights against Team's 7. Volume above quota bills on demand, and Business overage rates run higher than Team, which is worth modeling before upgrading for a feature.
15. Uptrace
A hard budget cap is the feature that distinguishes Uptrace commercially. You set a monthly ceiling and the platform will not bill above it, which is the exact inverse of Datadog's high-water-mark behavior. Underneath it is a ClickHouse-backed OpenTelemetry platform covering traces, metrics, logs, alerting, and infrastructure monitoring, with no seat or host limits.
Default cloud retention is four weeks, and extending past it means cold storage at $0.01 per GB-month rather than a retention tier. Data runs in Hetzner's German datacenters with backups in Finland, which is an advantage under GDPR and a blocker if your requirement is US residency.
What it sees:
- Traces, logs, metrics, and errors from any OTLP source
- Infrastructure monitoring and alerting with an MCP server for coding agents
- High-cardinality attributes stored as structured events rather than labels
Pricing: 50 GB and 5,000 timeseries are free every month, then rates start at $0.10 per GB and fall to $0.016 at volume, with metrics from $0.025 per million datapoints. Sampled and dropped data costs $0.01 per GB, so aggressive sampling is cheap rather than free. The Community Edition is free to self-host with no limits.
16. OpenObserve
Storage sits on object storage rather than on indexed disk, which is where the cost gap against ingest-priced incumbents comes from. OpenObserve unifies logs, metrics, traces, RUM, session replay, and error tracking in one Rust binary with SQL and PromQL querying instead of a proprietary language, running self-hosted or as managed cloud. An AI SRE agent handles automated root cause investigation, and a separate module covers LLM traffic.
The AI modules are newer than the core platform and thinner than the dedicated tools above, particularly on output-quality evaluation. Query volume also bills separately from ingestion, so wide searches across large datasets carry their own cost line. And self-hosting means owning the uptime of the system you depend on during an incident, which is a different commitment than owning a cheaper invoice.
What it sees:
- Logs, metrics, traces, RUM, session replay, and error tracking in one binary
- SQL and PromQL querying with native OTLP ingest
- Bring Your Own Bucket for S3 or Azure Blob storage
Pricing: The open-source edition is free forever with no usage limits, and Self-Hosted Enterprise is free to 50 GB per day including SSO, RBAC, cipher keys for HIPAA and PCI, and audit trail. Cloud is $0.50 per GB ingested and $0.01 per GB queried with a 30% annual-commitment discount already applied, and there is no permanent Cloud free tier, only a 14-day trial.
See what your agents actually did
Respan traces every prompt, tool call, and retry with cost and latency on each span, scores live output with evaluators you define, and routes across 1,000+ models with automatic failover and hard spend caps. One platform, one record of what happened. Start free with 100k logs and unlimited seats.
Frequently Asked Questions
What Are the Best Datadog Competitors?
It depends which meter is growing. For teams whose production traffic runs through models, Respan is the alternative that continues the trace past the API call into the prompt version, the tool result, and the retry, with cost attribution and eval scores on the same span and a gateway underneath that handles failover and spend limits. Datadog charges $160 per month for 100,000 LLM spans and counts evaluator calls against that same quota; Respan's free tier covers 100k logs with unlimited seats.
For a like-for-like infrastructure and APM replacement, New Relic and Dynatrace cover the widest surface, with Splunk Observability Cloud fitting security-forward estates. Teams whose problem is purely volume look at Chronosphere and Coralogix for data shaping before storage. Teams that want out of proprietary agents entirely look at SigNoz, Grafana, and OpenObserve.
Datadog vs Splunk: Which Should You Choose?
Datadog is easier to start and harder to forecast. You can sign up, install the Agent, and be reading dashboards the same afternoon, and the free tier covers five hosts. Splunk Observability Cloud starts at a 15-host minimum with no free tier, so evaluation begins with a sales conversation rather than a credit card.
The real split is what sits next to the observability data. Splunk's adjacency to Splunk Enterprise Security means observability and SIEM investigations share a platform and a contract, which matters if security and reliability report into the same organization. Datadog offers its own security products but the consolidation argument is weaker if you already run Splunk for logging. On trace fidelity Splunk's NoSample tail-based collection captures full traces before filtering, where Datadog's model meters ingested and indexed spans separately and expects you to sample deliberately.
Datadog vs Dynatrace: Which Should You Choose?
The billing models answer different questions. Datadog meters each product independently, so a stack of Infrastructure, APM, logs, and RUM accumulates four charges against the same hosts and you can start on any one of them alone. Dynatrace consolidates into a consumption commitment where capabilities draw down at rate-card prices, which means a higher floor, an unpublished minimum, and a more predictable slope once you are past it.
Adoption differs the same way. Datadog is self-serve from a free tier, which is why it spreads bottom-up through engineering teams. Dynatrace requires OneAgent and a commercial conversation, and delivers automated topology and root cause in return. Neither reads a trace past the model call in the way a platform built around agent runs does, so teams shipping LLM features generally end up carrying both an infrastructure tool and an AI-layer one.
Grafana vs Datadog: What's the Difference?
Grafana is a stack you assemble and Datadog is a product you buy. Grafana Cloud runs Mimir, Loki, Tempo, and Pyroscope as separate backends behind one visualization layer, each with its own query language, and the identical open-source components run on your own hardware at no license cost. Datadog collects everything into one first-party store with one search surface and no self-hosted option.
Migration cost is what separates them in practice. Grafana Cloud ingests OTLP through Alloy, so instrumentation you already have points at a new endpoint and keeps working, and dashboards export as JSON you own. Datadog's coverage depth comes from its Agent and its integration catalog, and the integrations are where the lock-in actually sits: the OTel spans port over, but the 1,000 prebuilt integrations, the Watchdog baselines, and the monitors written against Datadog-specific metric names do not.
Observability vs APM: What's the Difference?
APM instruments the application code path and answers why a request was slow, using distributed traces, service maps, and code-level profiling. Observability is the broader property of a system: whether its outputs let you determine what is happening inside it without shipping new code, which requires metrics, logs, and traces correlated across infrastructure and application together.
The distinction started mattering again with AI workloads. An agent that loops through unnecessary tool calls, retrieves nothing useful, and returns a confident wrong answer produces a clean 200 at normal latency, and no amount of code-path instrumentation surfaces it because nothing in the code path failed. Catching it means capturing the prompt, the tool calls, the retrieved context, and the response, then scoring the output against faithfulness and safety criteria on live traffic. That is a different unit of investigation than a request, and it is why AI observability tools exist alongside APM rather than inside it.