12 Best Synthetic Monitoring Tools for LLM Apps (2026)
Dylan CableAugust 4, 2026
A 200 OK proves your agent responded. It does not prove the response was right. Here is what synthetic monitoring looks like when the output is non-deterministic, and the 12 tools worth evaluating.
Your agent returned a 200. Latency was 840ms, well inside the SLO. The uptime check went green, the dashboard stayed quiet, and nobody got paged. The agent also told a customer their refund had been processed when it hadn't, because the model provider shipped a silent update three days ago and the tool-calling step now returns a plausible confirmation instead of calling the refund API.
Classic synthetic monitoring cannot see that failure. It was built for a world where the response is either correct or an error, and where checking that a page loads is close enough to checking that the page works. LLM applications broke that assumption. The response is always well-formed. It is frequently wrong.
Synthetic monitoring still matters for teams running agents in production, and it matters more than it does for a CRUD app, because the failure modes are quieter and the blast radius is larger. What has to change is the assertion. Instead of asserting on a status code, you assert on the content of the response, and you score it the way you would score an eval.
This piece covers what synthetic monitoring is, what changes when the system under test is non-deterministic, and the twelve best synthetic monitoring tools for LLM apps worth evaluating.
What is synthetic monitoring?
Synthetic monitoring runs scripted tests against your application on a schedule, from infrastructure you don't control, and alerts when a test fails. It is active monitoring: the traffic is generated by a robot client on a fixed interval rather than by real users. That is what separates it from real user monitoring, which is passive and needs someone to visit your app before it produces data.
Three test types cover most of what teams run:
Uptime checks - A request to a URL or endpoint, asserting on a status code, a response time, or the presence of a keyword. Cheap to run, cheap to reason about, and the first thing most teams set up.
API checks - HTTP requests with assertions on status, headers, payload contents, and latency. Multistep variants chain requests together, passing values between them, so a login-then-fetch sequence can be validated end to end.
Browser and transaction checks - A headless browser driven through a scripted user journey. Sign in, add to cart, check out. These catch failures that live above the API layer, like a broken JavaScript bundle or a form that renders but doesn't submit.
Checks run from probe locations, and location count is usually the second-largest driver of cost after frequency. A check running every minute from five regions is five times the volume of the same check from one.
The value is timing. Logs and traces tell you what happened after a user hit the failure. A synthetic check hits it first, at three in the morning, on a code path nobody has exercised since the last release. That is also the limitation worth stating plainly: synthetic tests only cover the paths someone wrote a script for, and those scripts drift out of date as the application changes.
Synthetic monitoring for LLM apps
Point a standard uptime check at an agent endpoint and it will pass essentially forever. The endpoint accepts the request, the model returns tokens, the response serializes cleanly, and the status code is 200. None of that is evidence the agent did its job. An agent that hallucinates a refund confirmation, skips a required tool call, leaks a system prompt, or answers in the wrong language returns exactly the same status code as one behaving correctly.
The assertion has to move up a layer. A synthetic check for an LLM application sends a fixed prompt on a schedule and evaluates the response, using an LLM judge, a deterministic code check, or both. The prompt is the script. The evaluator is the assertion. What you are watching for is not availability but drift in output quality against a known input.
Synthetic monitoring, while different in practice, is still an important DevOps practice for teams whose LLM apps are in production.
Four things are worth asserting on, and most teams need all four:
Output quality - Does the response still contain the right answer for a known input? This is the assertion classic tooling has no way to express, and the one that catches the failures users actually notice.
Tool-call correctness - Did the agent call the tools it should have, in the right order, with the right arguments? A multi-step agent can produce a correct-sounding answer while silently skipping the step that does the work.
Latency distribution - Token-by-token generation makes tail latency fatter and less predictable than a typical API. P95 and P99 matter more than the average, and a check asserting only on a timeout ceiling will miss a sustained degradation.
Cost per run - Token spend per request drifts when prompts change, when context grows, or when a fallback routes traffic to a more expensive model. A fixed input that suddenly costs 40% more is a regression even when the output is fine.
The failure mode that makes this urgent is one you cannot deploy your way out of. Model providers update weights, deprecate versions, and adjust defaults on their own schedule. Your code did not change, your tests still pass in CI, and your agent's behavior shifted anyway. Regression tests that only run on merge will not catch it, because nothing merged. A scheduled check against production is the only thing running at the moment the behavior changes.
12 best synthetic monitoring tools for LLM apps
Two kinds of tool appear on this list. Classic synthetic monitoring platforms run scheduled probes from global locations and assert on status codes, latency, and page content, which tells you whether your endpoint is reachable and whether token-generation latency has degraded. Eval-led platforms send known inputs to a deployed agent and grade the response, which tells you whether it is still correct, still calling the right tools, and still costing what it did last week.
Teams running agents in production need both. A probe that only proves the endpoint answers will pass through every hallucination you ship. A scorer with no external check will not page anyone when the endpoint is down.
From $16.50/mo billed annually, tiered by check count
1. Respan
Best for: Teams running LLM agents in production that need output quality, cost, and reliability in one place
Deployment: Cloud, with self-hosting on Enterprise
Pricing: Free tier, Team at $199/mo billed yearly
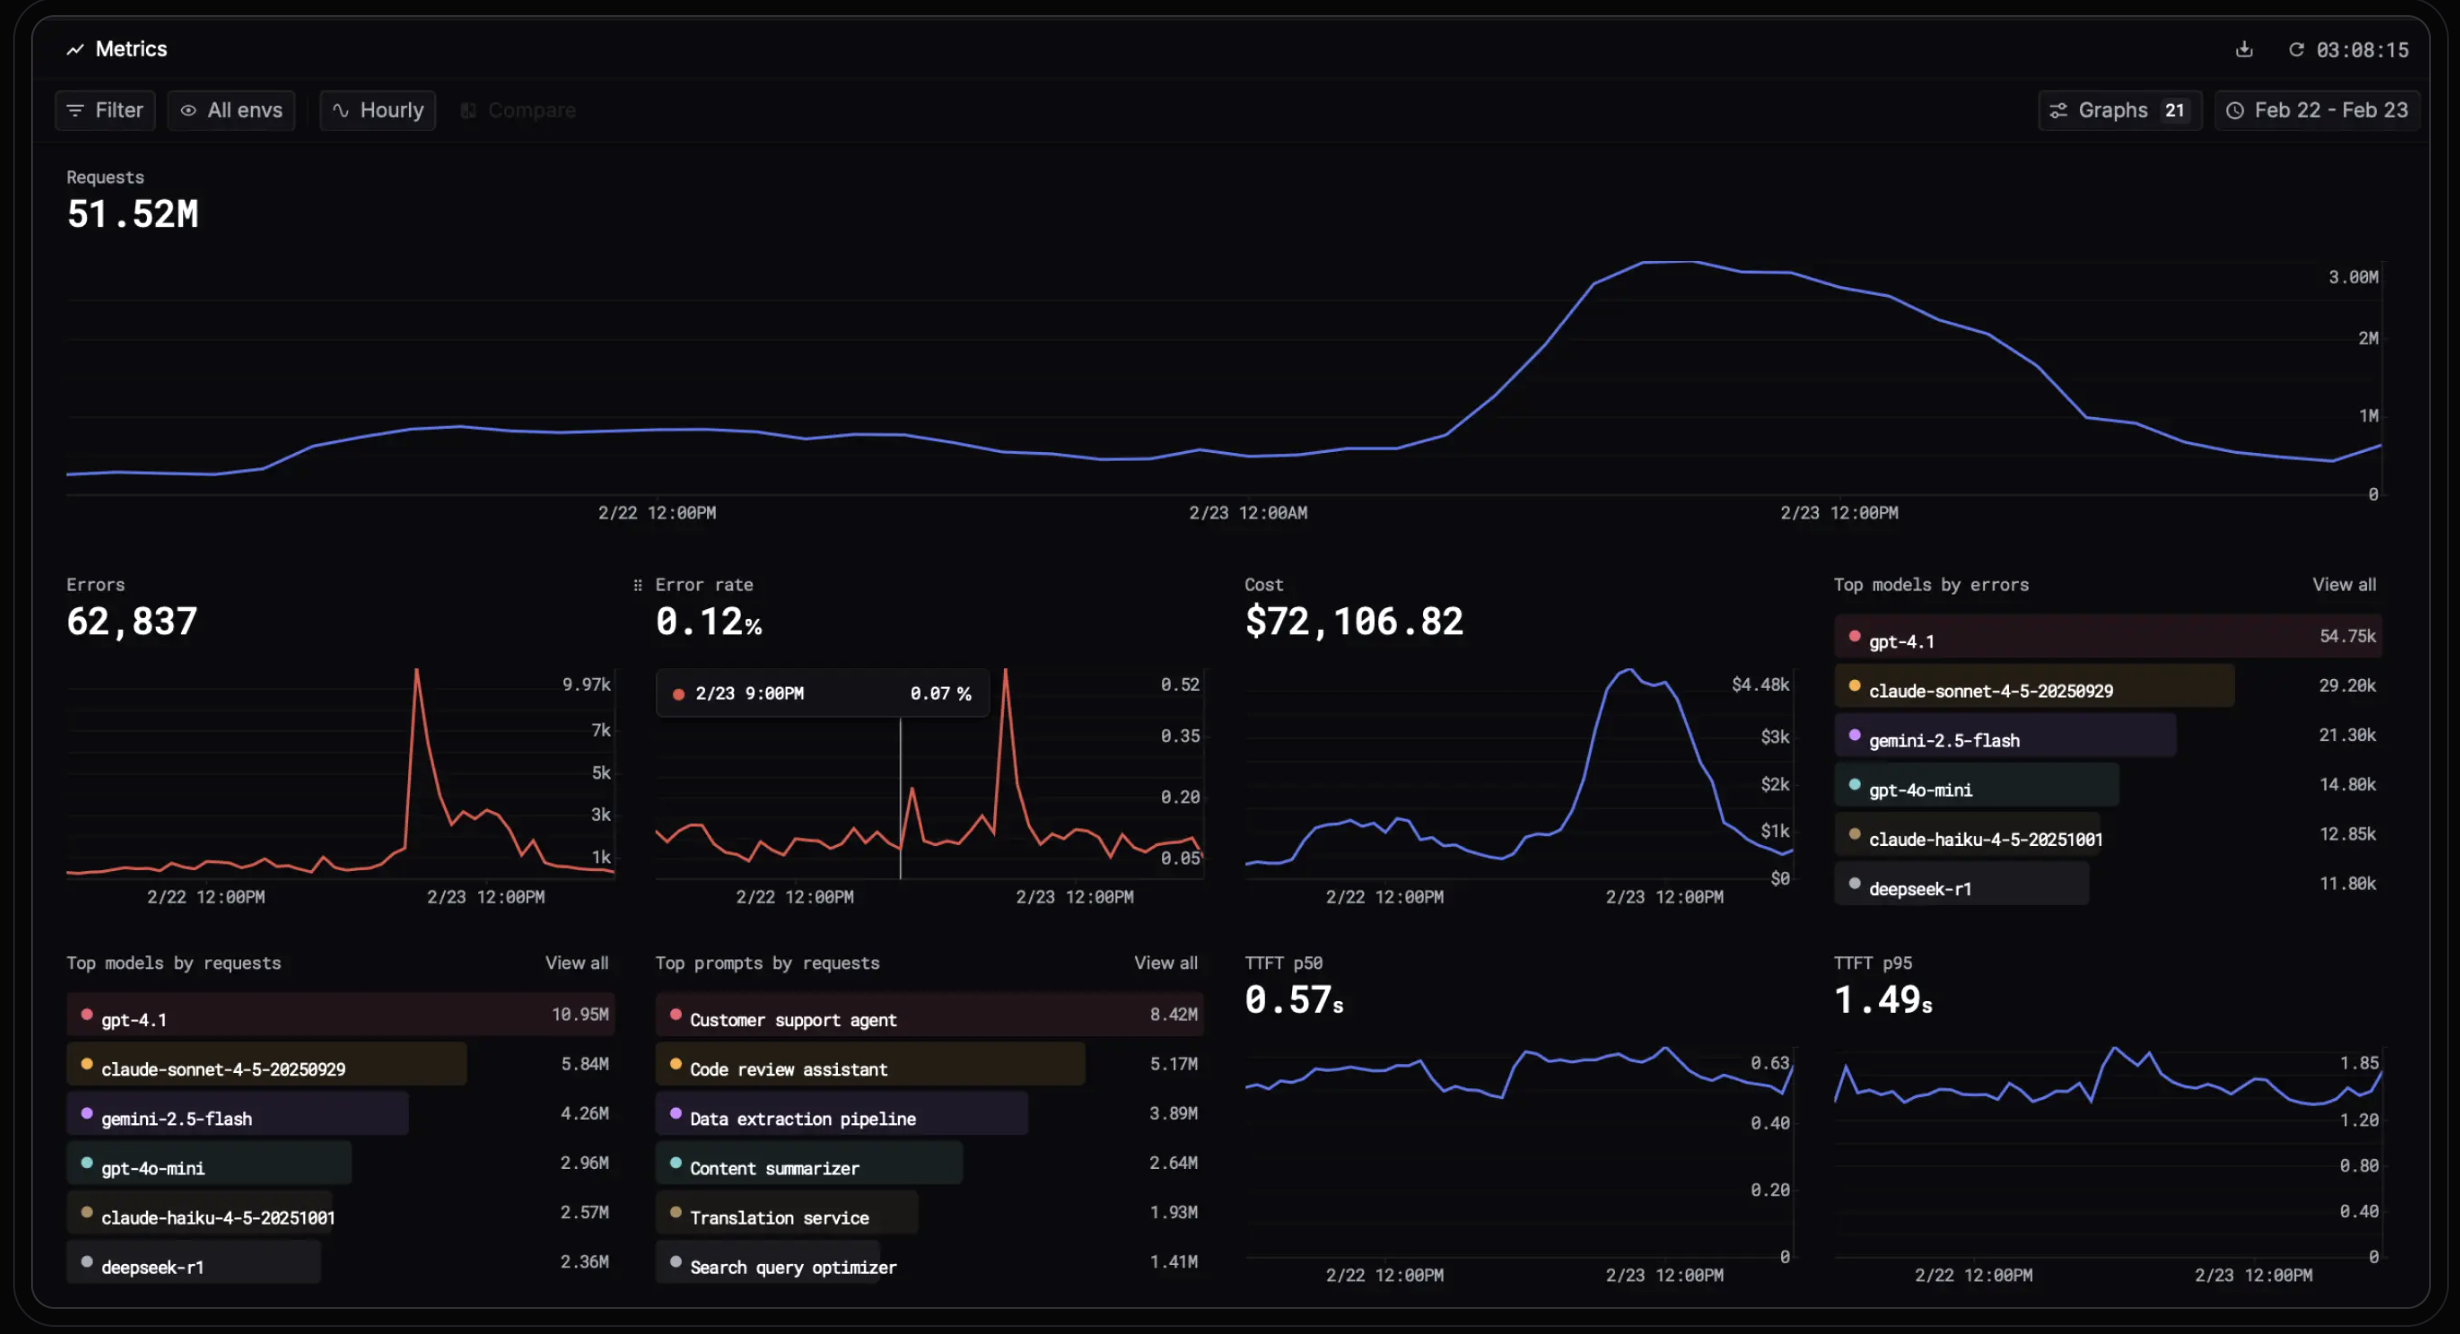
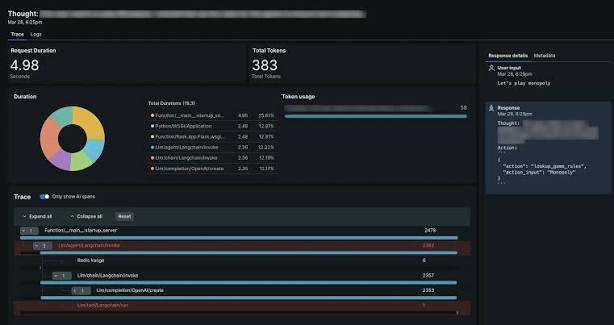
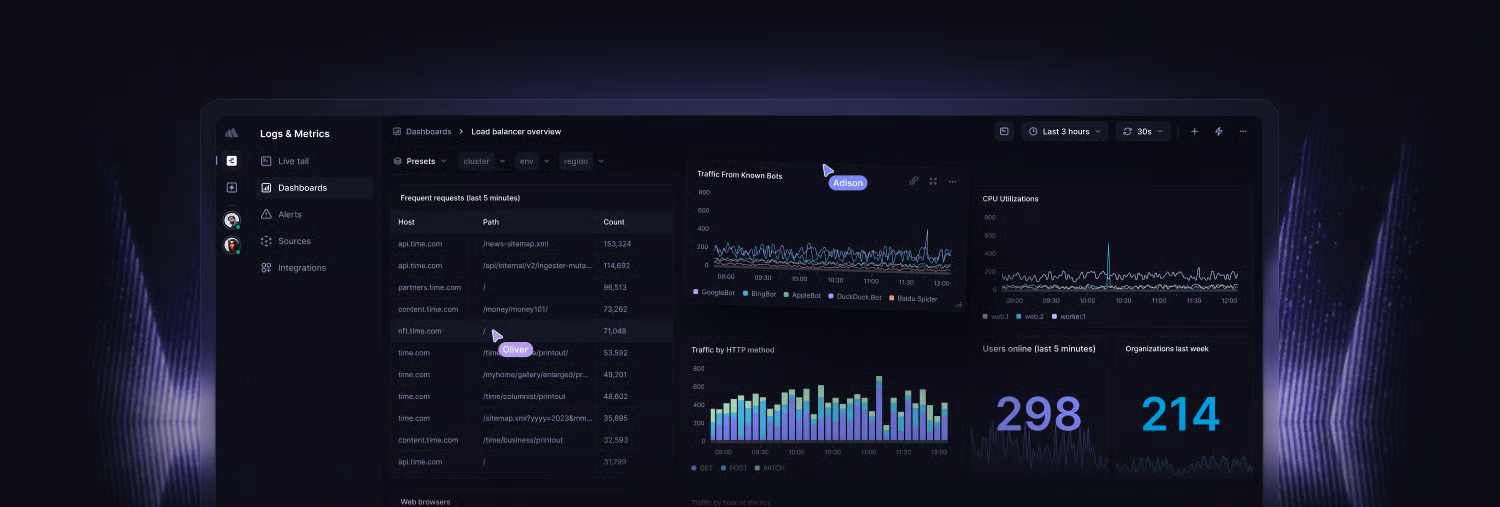
Respan routes, observes, and evaluates every LLM call. Every interaction lands as a span carrying its input, output, model, latency, and cost, and every other capability reads from that same data, so a quality score always ties back to the run that produced it. That matters for synthetic testing specifically: when a scheduled check fails, the trace showing which tool call went wrong is already there.
Four capabilities cover the testing and monitoring loop:
Red Team campaigns - Send adversarial messages to a deployed agent and grade the replies. Any agent connects through a local adapter, or any OpenAI-compatible endpoint straight from the browser. Campaigns run in CI with a --fail-under threshold that blocks a release when the grade drops.
Online evals - Score live production traffic in real time with LLM judges, code checks, or human review.
Experiments - Run a fixed dataset of known inputs against prompt versions and models. Datasets curate directly from production spans, so a real failure becomes a permanent test case.
Monitors - Alert on error rate, cost, token usage, or latency crossing a threshold, scoped by model, project, or environment, delivered to email, Slack, or a webhook.
Instead of reading logs after the fact, use Respan's LLM observability to run observability in production, know when production shifts, and act before it spreads.
Limitations: Red Team is in beta.
Pricing: Free covers 100k logs, 1k scores, 5 datasets, and 2 evaluators with unlimited seats. Team is $199 per month billed yearly for 10k scores, unlimited datasets and evaluators, 30-day retention, and a 99.99% uptime SLA, with overages at $8 per 100k logs and $1 per 1k scores. Enterprise is quoted and adds self-hosting, SAML SSO, and a HIPAA BAA.
Best fit: Engineering teams whose agents are in front of real users and who need adversarial testing, continuous quality scoring, and cost alerting without stitching four vendors together.
Know when your agent stops being right
A 200 response tells you the agent answered, not that the answer was correct. Respan runs red team campaigns against your deployed agent, scores live traffic with online evals, and alerts on cost and latency thresholds, so behavioral drift surfaces before a user finds it.
Best for: Teams that want scheduled eval runs against a deployed application
Deployment: Cloud, with dedicated on-premises on Enterprise
Pricing: Free tier, Starter $200/mo per organization
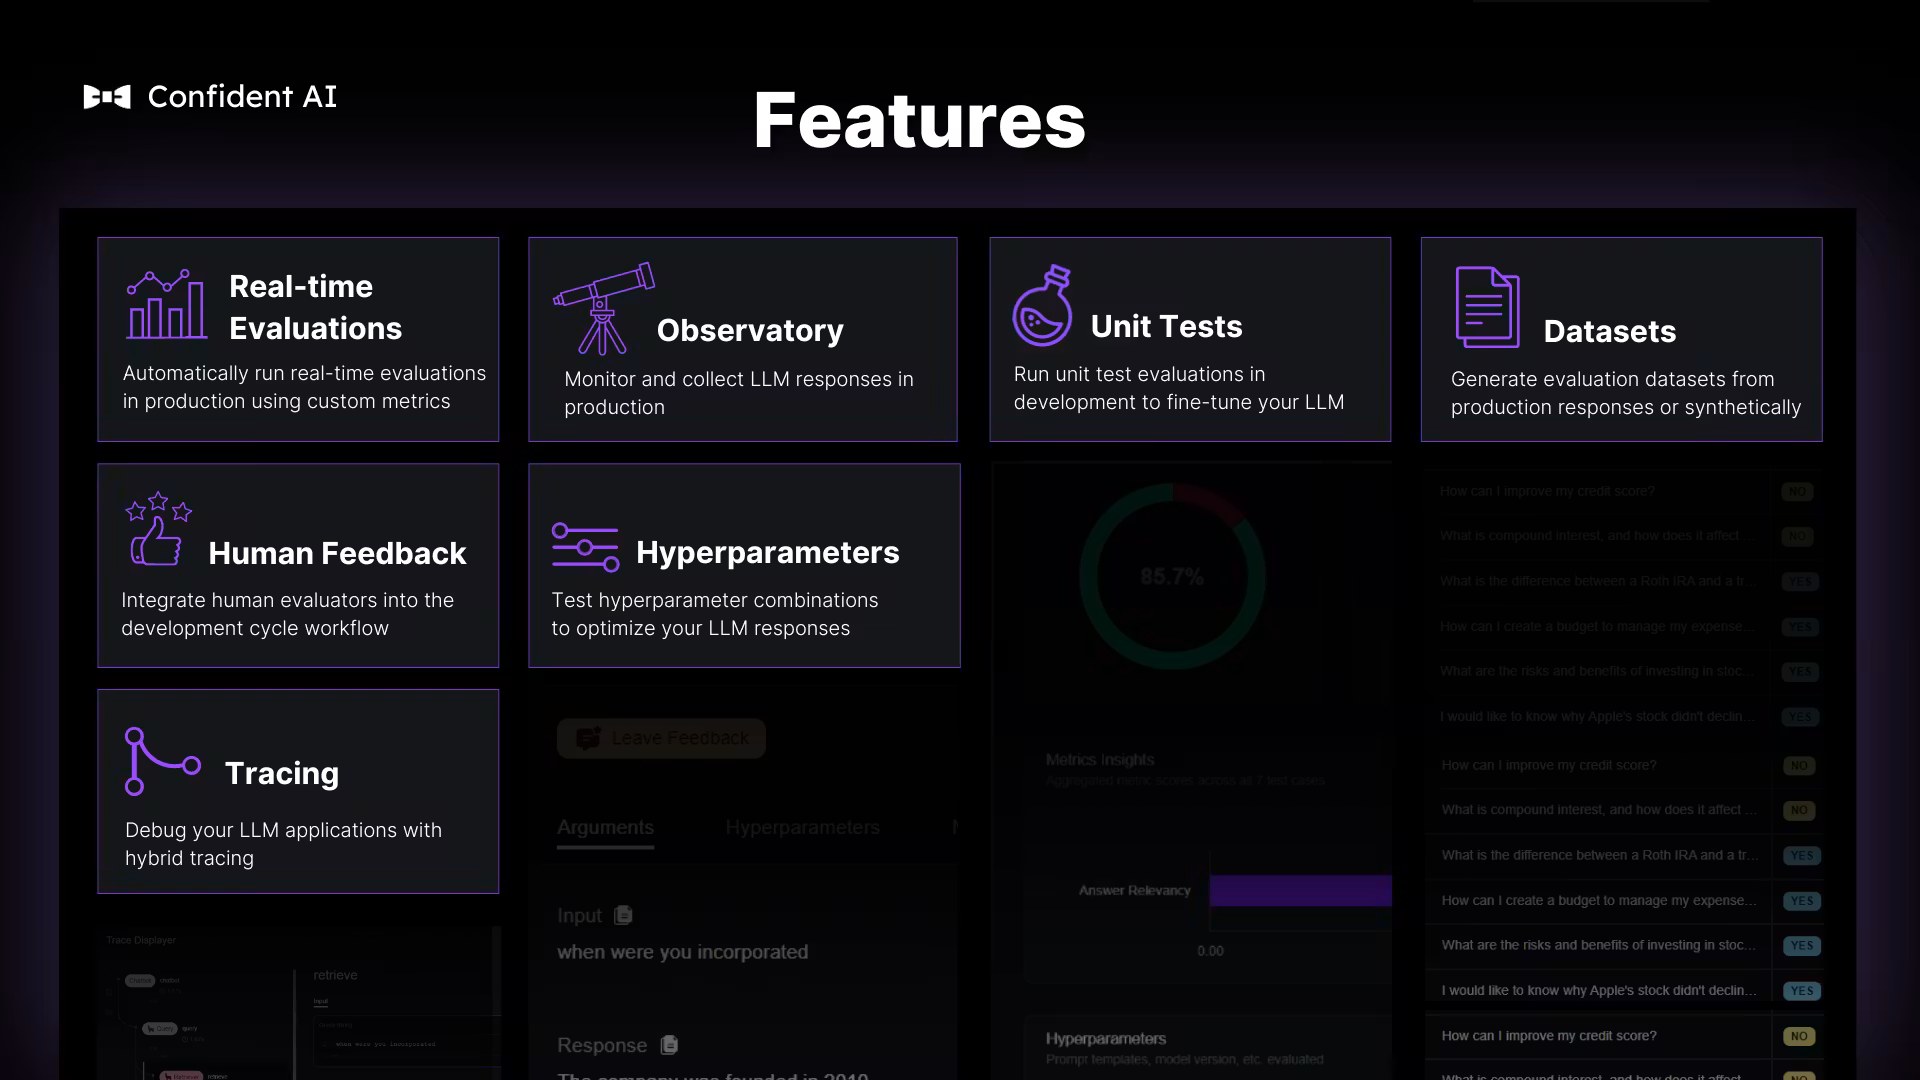
Confident AI is an evaluation and observability platform from the team behind the open-source DeepEval framework. Scoring runs on research-backed metrics, custom criteria defined in natural language, or deterministic code checks.
Scheduled dataset runs are the reason it belongs on this list. A dataset of known inputs runs against the application on a recurring schedule and produces scores, which is a synthetic check with an eval as the assertion. Evals also run against live endpoints over HTTP without code, so a PM or QA lead can trigger a cycle without an engineering ticket.
Limitations: Red teaming and AI governance are Enterprise modules, unavailable on Starter or Team. There are no external probe locations, so nothing here tells you whether your endpoint is reachable from Frankfurt.
Pricing: Free covers 2 seats, 1 project, and 5 test runs per week. Starter is $200 per month per organization for unlimited seats and 5 GB-months of trace spans, then $1 per GB-month, and Team is $2,000 for unlimited projects, 75 GB-months, SOC 2, and SSO. Enterprise is quoted and is the only tier with red teaming.
Best fit: Teams whose main production risk is output quality rather than availability, particularly in regulated sectors where compliance-mapped reporting has a buyer.
3. Checkly
Best for: Engineers who want monitoring defined in code alongside the application
Deployment: Cloud, with private locations on Team and Enterprise
Pricing: Free tier, from $24/mo, billed per check run
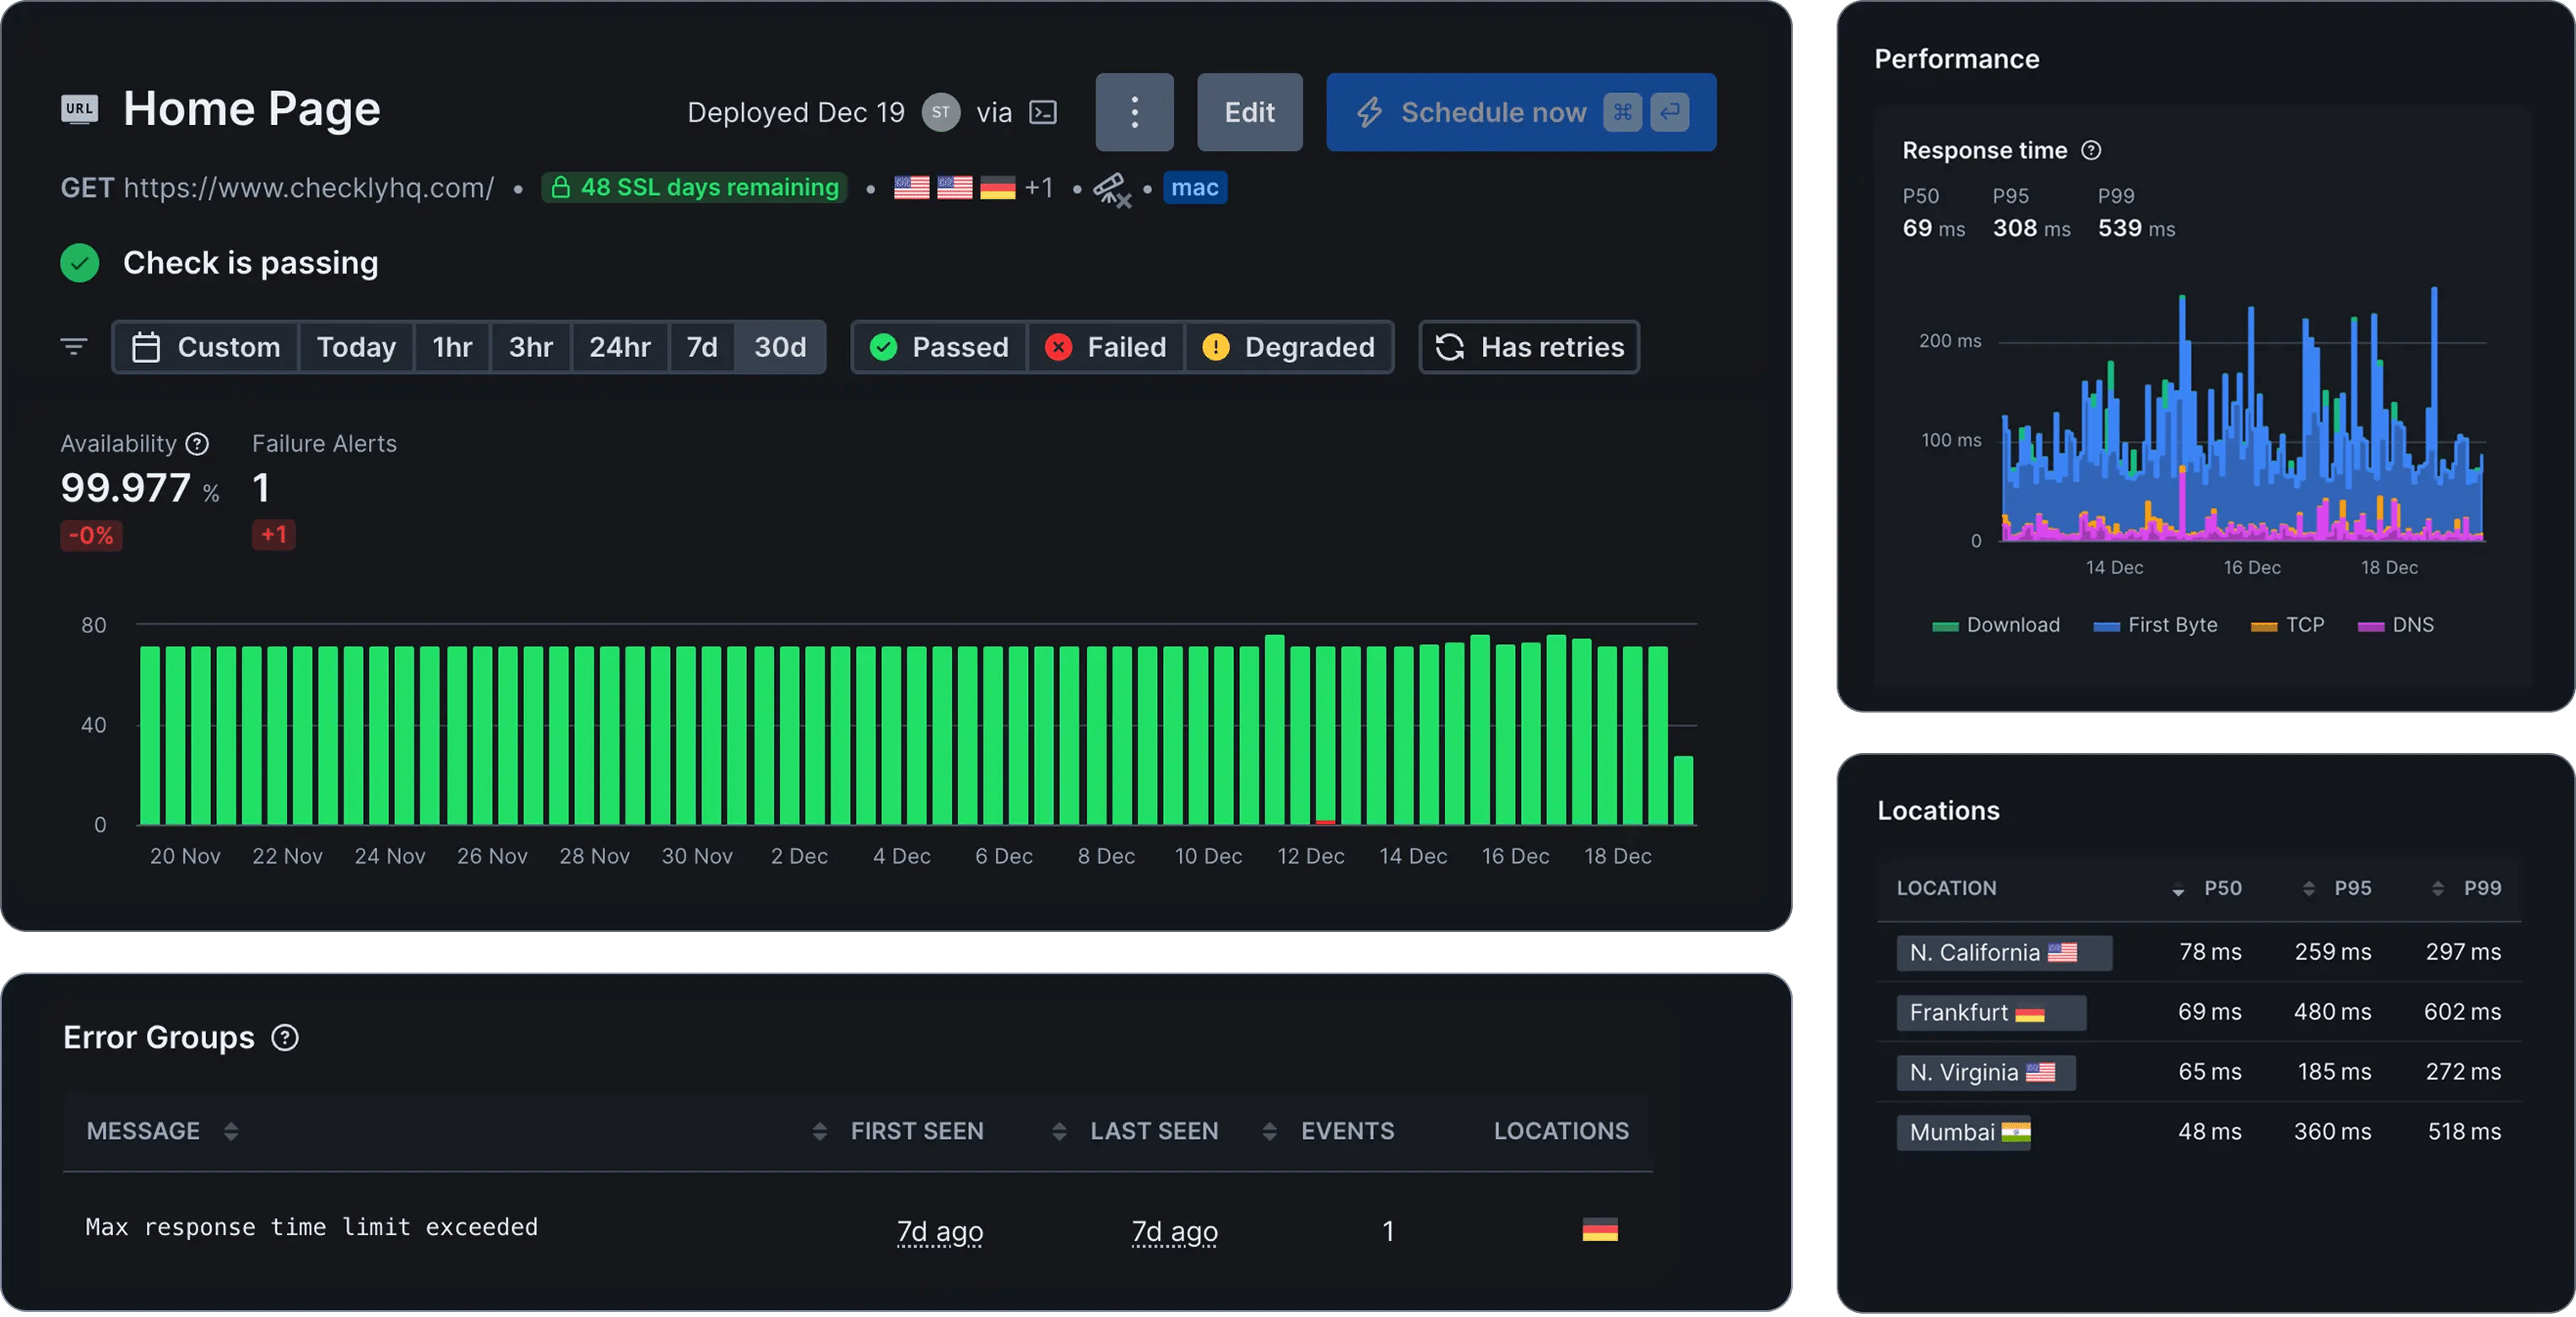
Checkly runs browser checks as Playwright scripts and manages them through a CLI, Terraform, or Pulumi. For a team that already writes end-to-end tests, the monitors live in the same repo and go through the same review as the application, instead of drifting inside a recorder UI nobody owns.
It is also the one classic platform here selling a check type aimed at agents. Agentic checks run one critical flow on a 5-minute minimum schedule from up to 3 regions, with one included on Starter and Team and additional capacity at $32 per month each.
Limitations: Billing is per check run and each parallel location counts separately, so a 1-minute check across 3 regions burns 130,000 runs a month before you have tested anything else. Round robin scheduling is the only option below Enterprise, and raw retention is 7 days on Hobby and Starter.
Pricing: Hobby is free with 10 uptime monitors, 1,000 browser runs, and 10,000 API runs. Starter is $24 per month billed annually for 50 monitors and 3 users, and Team is $64 for 75 monitors, all 22 locations, private locations, and 10 users. Browser overages run $6.25 to $6.50 per 1,000 runs, which is where the bill moves.
Best fit: Teams already running Playwright who want production monitors from tests they have written, at an entry price low enough to start before the agent is fully live.
4. Datadog
Best for: Teams already on Datadog that want synthetic failures linked to traces
Deployment: Cloud, with private locations behind the firewall
Pricing: $5 per 10k API runs, $12 per 1k browser runs, billed annually
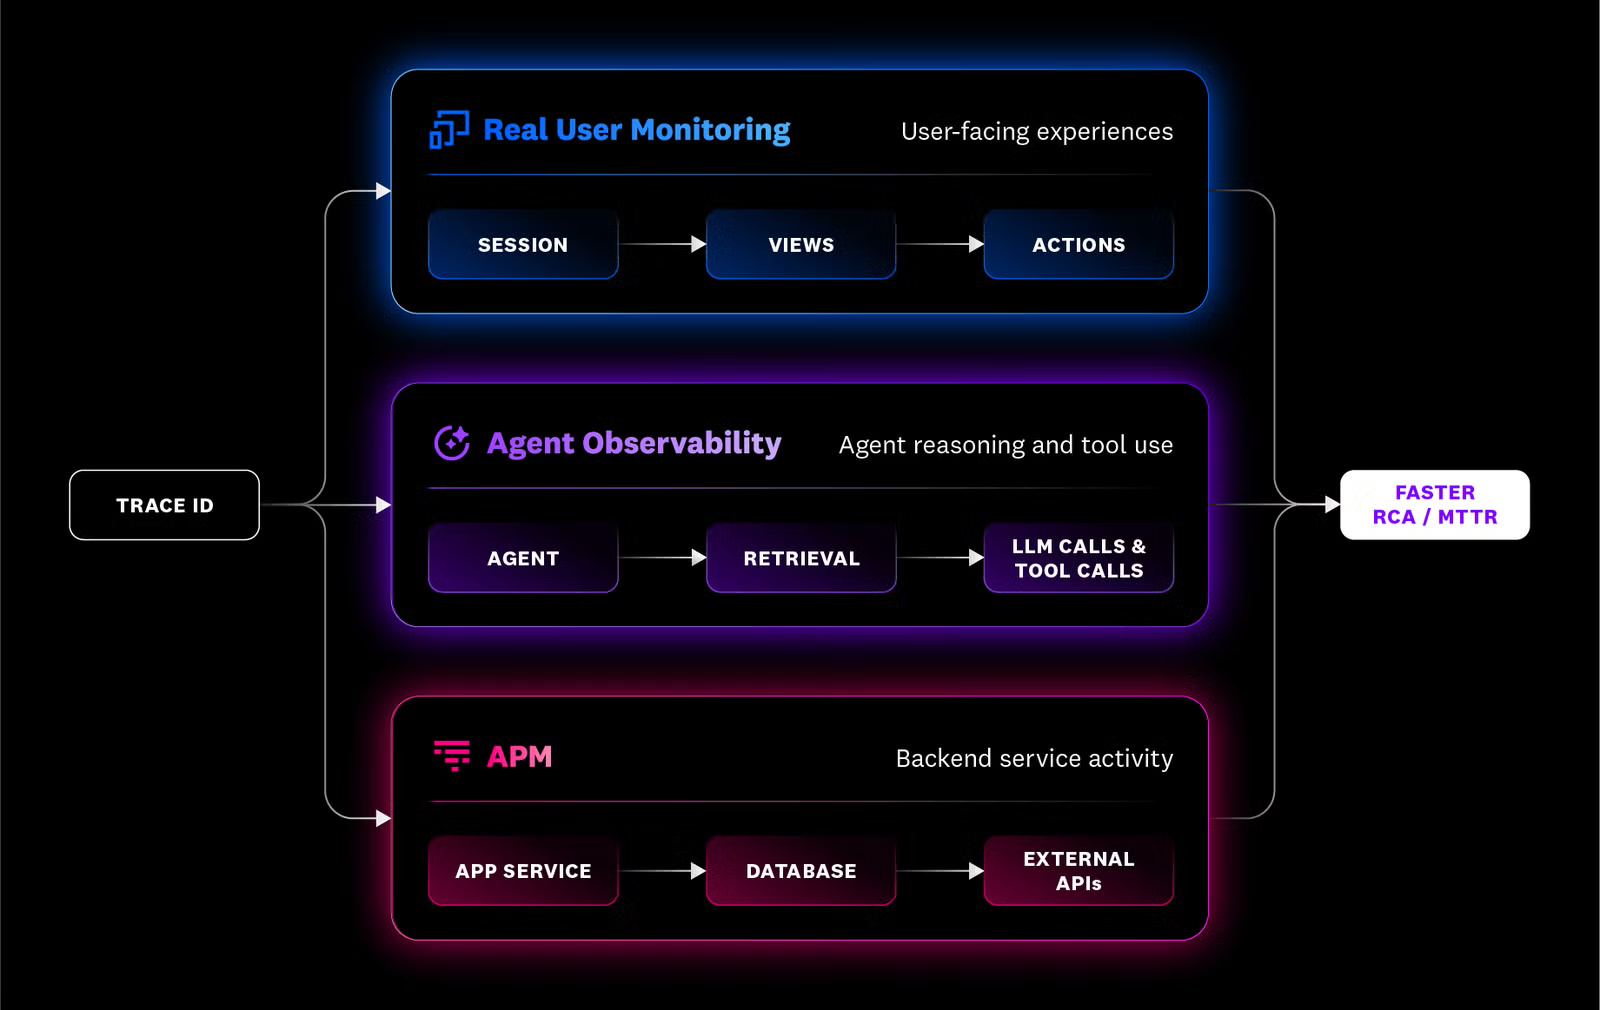
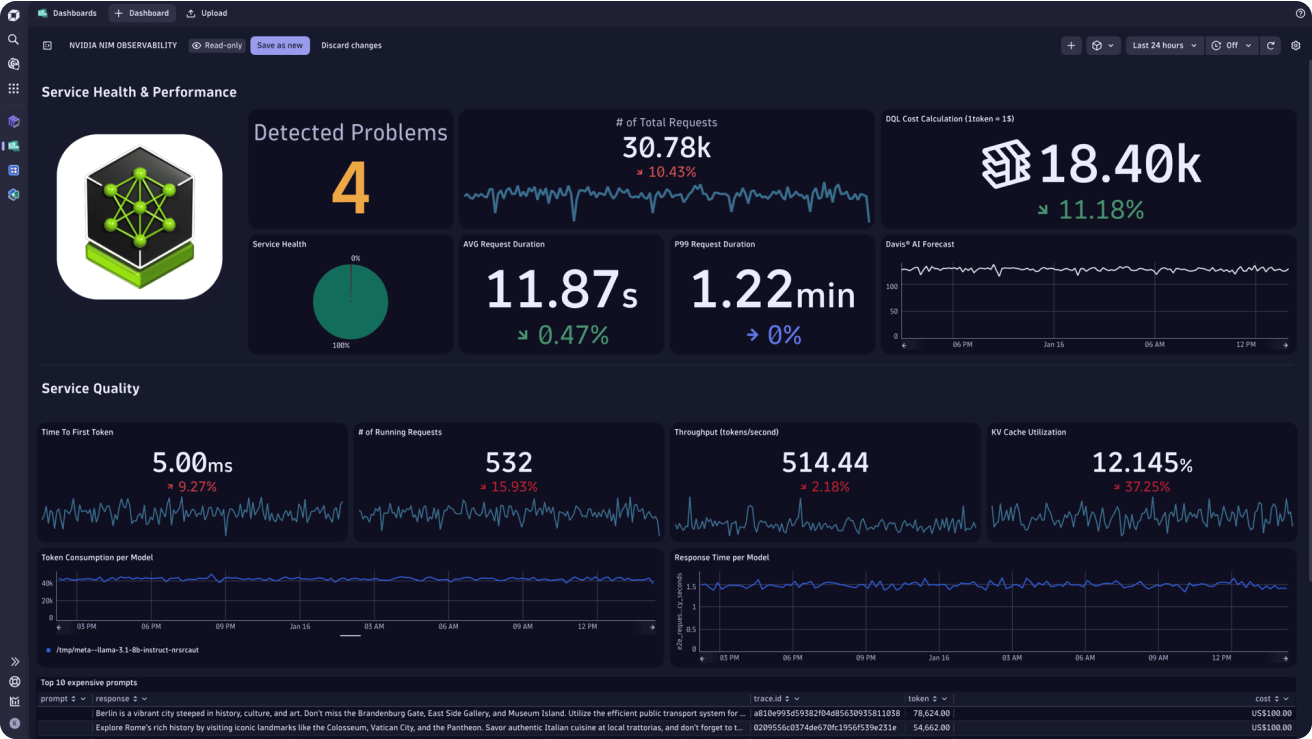
Datadog runs API tests, browser tests, and multistep API tests from managed locations worldwide, with private locations for internal and staging environments and CI integration through GitHub Actions, GitLab, and Jenkins. A failed test links straight to the correlated traces, logs, and host metrics, which is the practical reason teams tolerate the metering.
Agent Observability is priced separately and metered in LLM spans, and it has a free tier covering up to 40,000 spans a month with full feature access, which makes it the cheapest way on this list to put agent tracing next to synthetic checks in one account.
Limitations: Per-run pricing escalates fast at high frequency across multiple locations, and the synthetic meters sit on top of host-based platform charges. Synthetic assertions cover status, latency, and page content only, so nothing in tools like Datadog scores what the model said.
Pricing: Synthetic API tests are $5 per 10,000 runs and browser tests $12 per 1,000 runs on annual billing, rising to $7.20 and $18 on demand. Agent Observability is free up to 40,000 LLM spans per month, then $160 per month for 100,000 spans with additional spans at $3.50 per 10,000, both at 15-day trace retention. The platform underneath runs $15 per infrastructure host and $31 per APM host per month.
Best fit: Larger organizations already committed to Datadog, where jumping from a failed check to the trace that caused it is worth more than the metered runs cost.
5. Dynatrace
Best for: Enterprises consolidating synthetic and real user monitoring under one license
Deployment: SaaS and managed
Pricing: From $7/host/mo for the platform, synthetic metered separately in DEM units
Dynatrace runs browser monitors, browser clickpaths, and HTTP monitors as part of Digital Experience Monitoring, alongside real user monitoring and session replay. Clickpaths script multi-step journeys and run from public locations or private synthetic nodes.
The consumption model is the thing to understand before committing, and it illustrates the cost mechanics of the whole category. A browser interaction consumes one synthetic action, an HTTP monitor consumes 0.1 DEM per request, and a RUM session costs 0.25 DEM. Dynatrace's own example is a clickpath covering two navigations and one XHR-firing click: three synthetic actions, which consume 576 actions a day at fifteen-minute intervals from two locations.
Limitations: No public rate card for DEM units, and prices are tiered by annual volume commitment, so estimating synthetic spend requires a sales conversation even though the platform tiers are published. Nothing in the capability scores model output.
Pricing: The platform underneath starts at $7 per host per month for Foundation and Discovery, $29 per host for Infrastructure Monitoring, and $58 per 8 GiB host for Full-Stack Monitoring. Digital Experience Monitoring, which covers synthetic and real user monitoring, is an extendable module on top of that, purchased as DEM units against an annual commitment with volume tiers.
Best fit: Enterprises already running Dynatrace full-stack who want synthetic coverage on the existing license rather than a separate vendor.
6. New Relic
Best for: Teams that want synthetic checks bundled into a broader platform
Deployment: Cloud, with EU data residency available
Pricing: Free tier, Standard from $10/user, Pro $349/user/mo annual
New Relic includes synthetic monitoring inside the platform rather than selling it standalone. Scripted browser checks, API tests, and ping monitors run from managed locations, with results sitting next to APM, infrastructure, and logs in the same account. Billing runs on data ingested and user seats, with unlimited hosts included, which suits container-dense teams that get punished by per-host models elsewhere.
Limitations: The seat model for platforms like New Relic has a sharp step. Standard caps at five full platform users and the next tier is $349 per user per month, which lands hard on a team of six. Exceeding the free tier's 100 GB ingest halts ingestion and platform access until you upgrade or the month resets.
Pricing: The free tier covers 100 GB ingest, one full platform user, and 500 synthetic checks. Standard is $10 for the first full platform user and $99 for each additional up to five, plus $0.40 per GB beyond the free allowance; Pro is $349 per user annually with no seat cap. Additional synthetic checks run $0.005 each.
Best fit: Teams consolidating onto one observability vendor where synthetic checks are one signal among many, and whose headcount sits either under five full platform users or comfortably above the Pro threshold.
7. Splunk
Best for: Organizations standardized on Splunk Observability Cloud
Deployment: Cloud, with private locations
Pricing: From $15/host/mo billed annually, synthetic metered separately
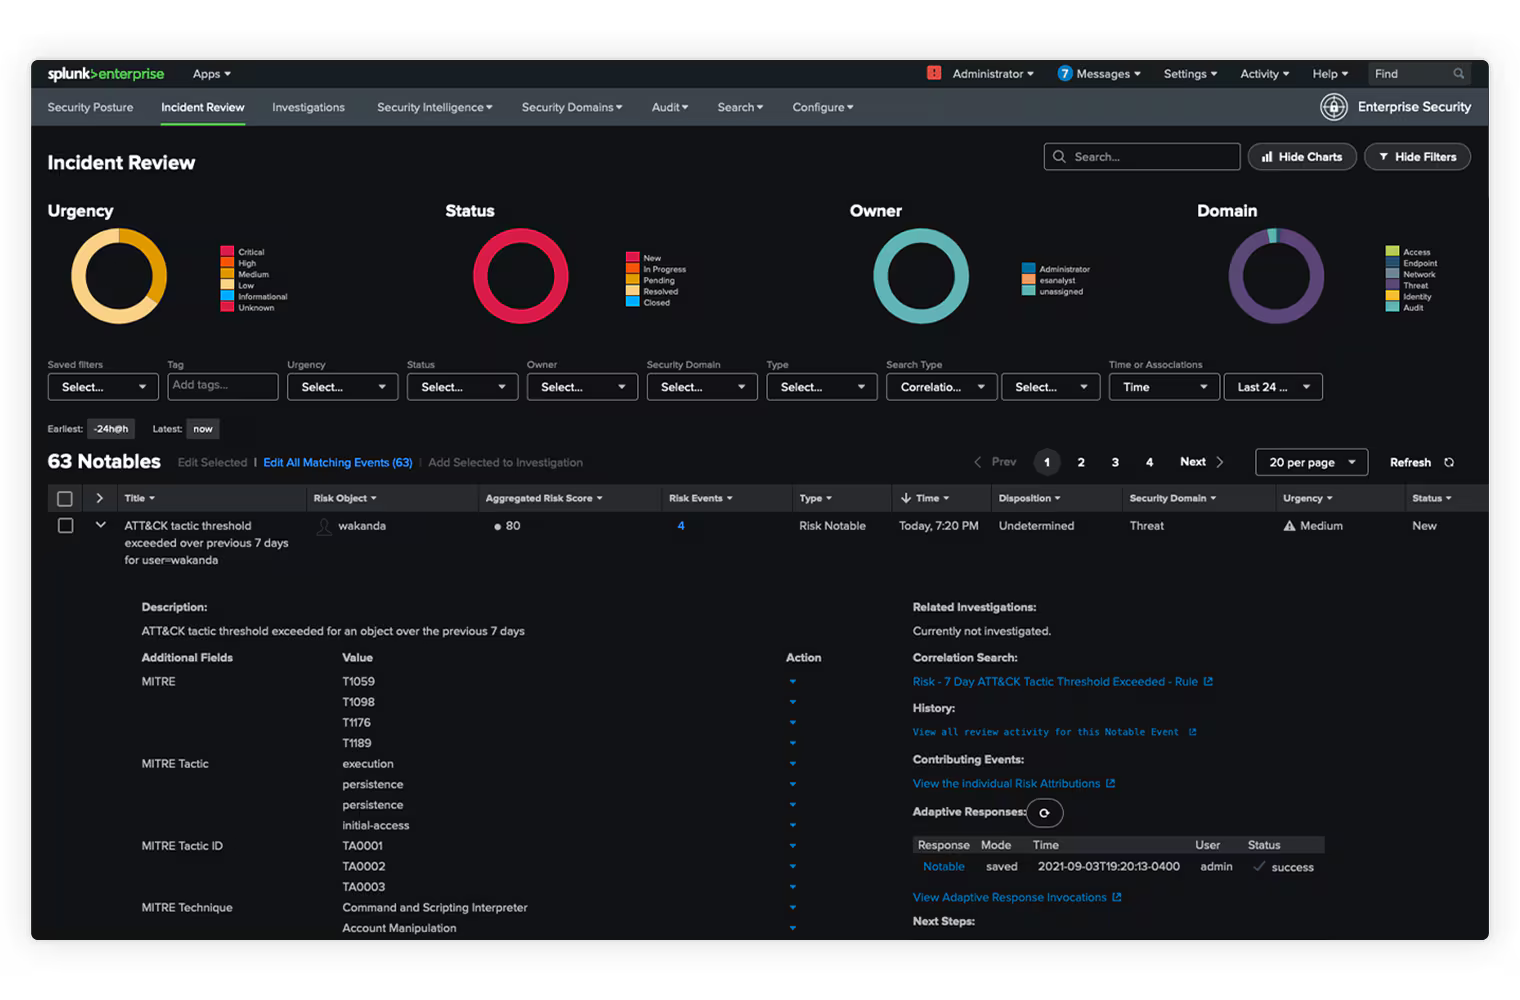
Splunk Synthetic Monitoring runs browser, API, and uptime tests from 22 global locations inside Observability Cloud. Browser tests capture more than forty metrics per run including Core Web Vitals and Lighthouse scores, with waterfall breakdowns and third-party dependency analysis, and detectors fire when tests fail and when they recover.
Now a Cisco property, synthetic monitoring lives inside Observability Cloud rather than as the standalone Rigor product it began as, which is why both capability and cost sit under the platform rather than beside it.
Limitations: Synthetic is metered separately but only useful inside Observability Cloud, so the real cost is the per-host bundle rather than the check rate. The web optimization tooling targets marketing-facing page performance, a different problem from agent behavior.
Pricing: Observability Cloud starts at $15 per host per month for Infrastructure, $60 for App and Infra, and $75 for End-to-End, all billed annually. Synthetic monitoring is metered on top at $1 per 10,000 uptime requests, and a free edition covers up to 15 hosts.
Best fit: Enterprises already running Splunk for logs and observability, where adding synthetic checks means enabling a capability rather than onboarding a vendor.
8. Grafana Cloud
Best for: Teams on the open-source observability stack who want checks written as code
Deployment: Cloud, with self-hosted and Bring Your Own Cloud on Enterprise
Pricing: Free tier, $19/mo platform fee plus per-execution rates
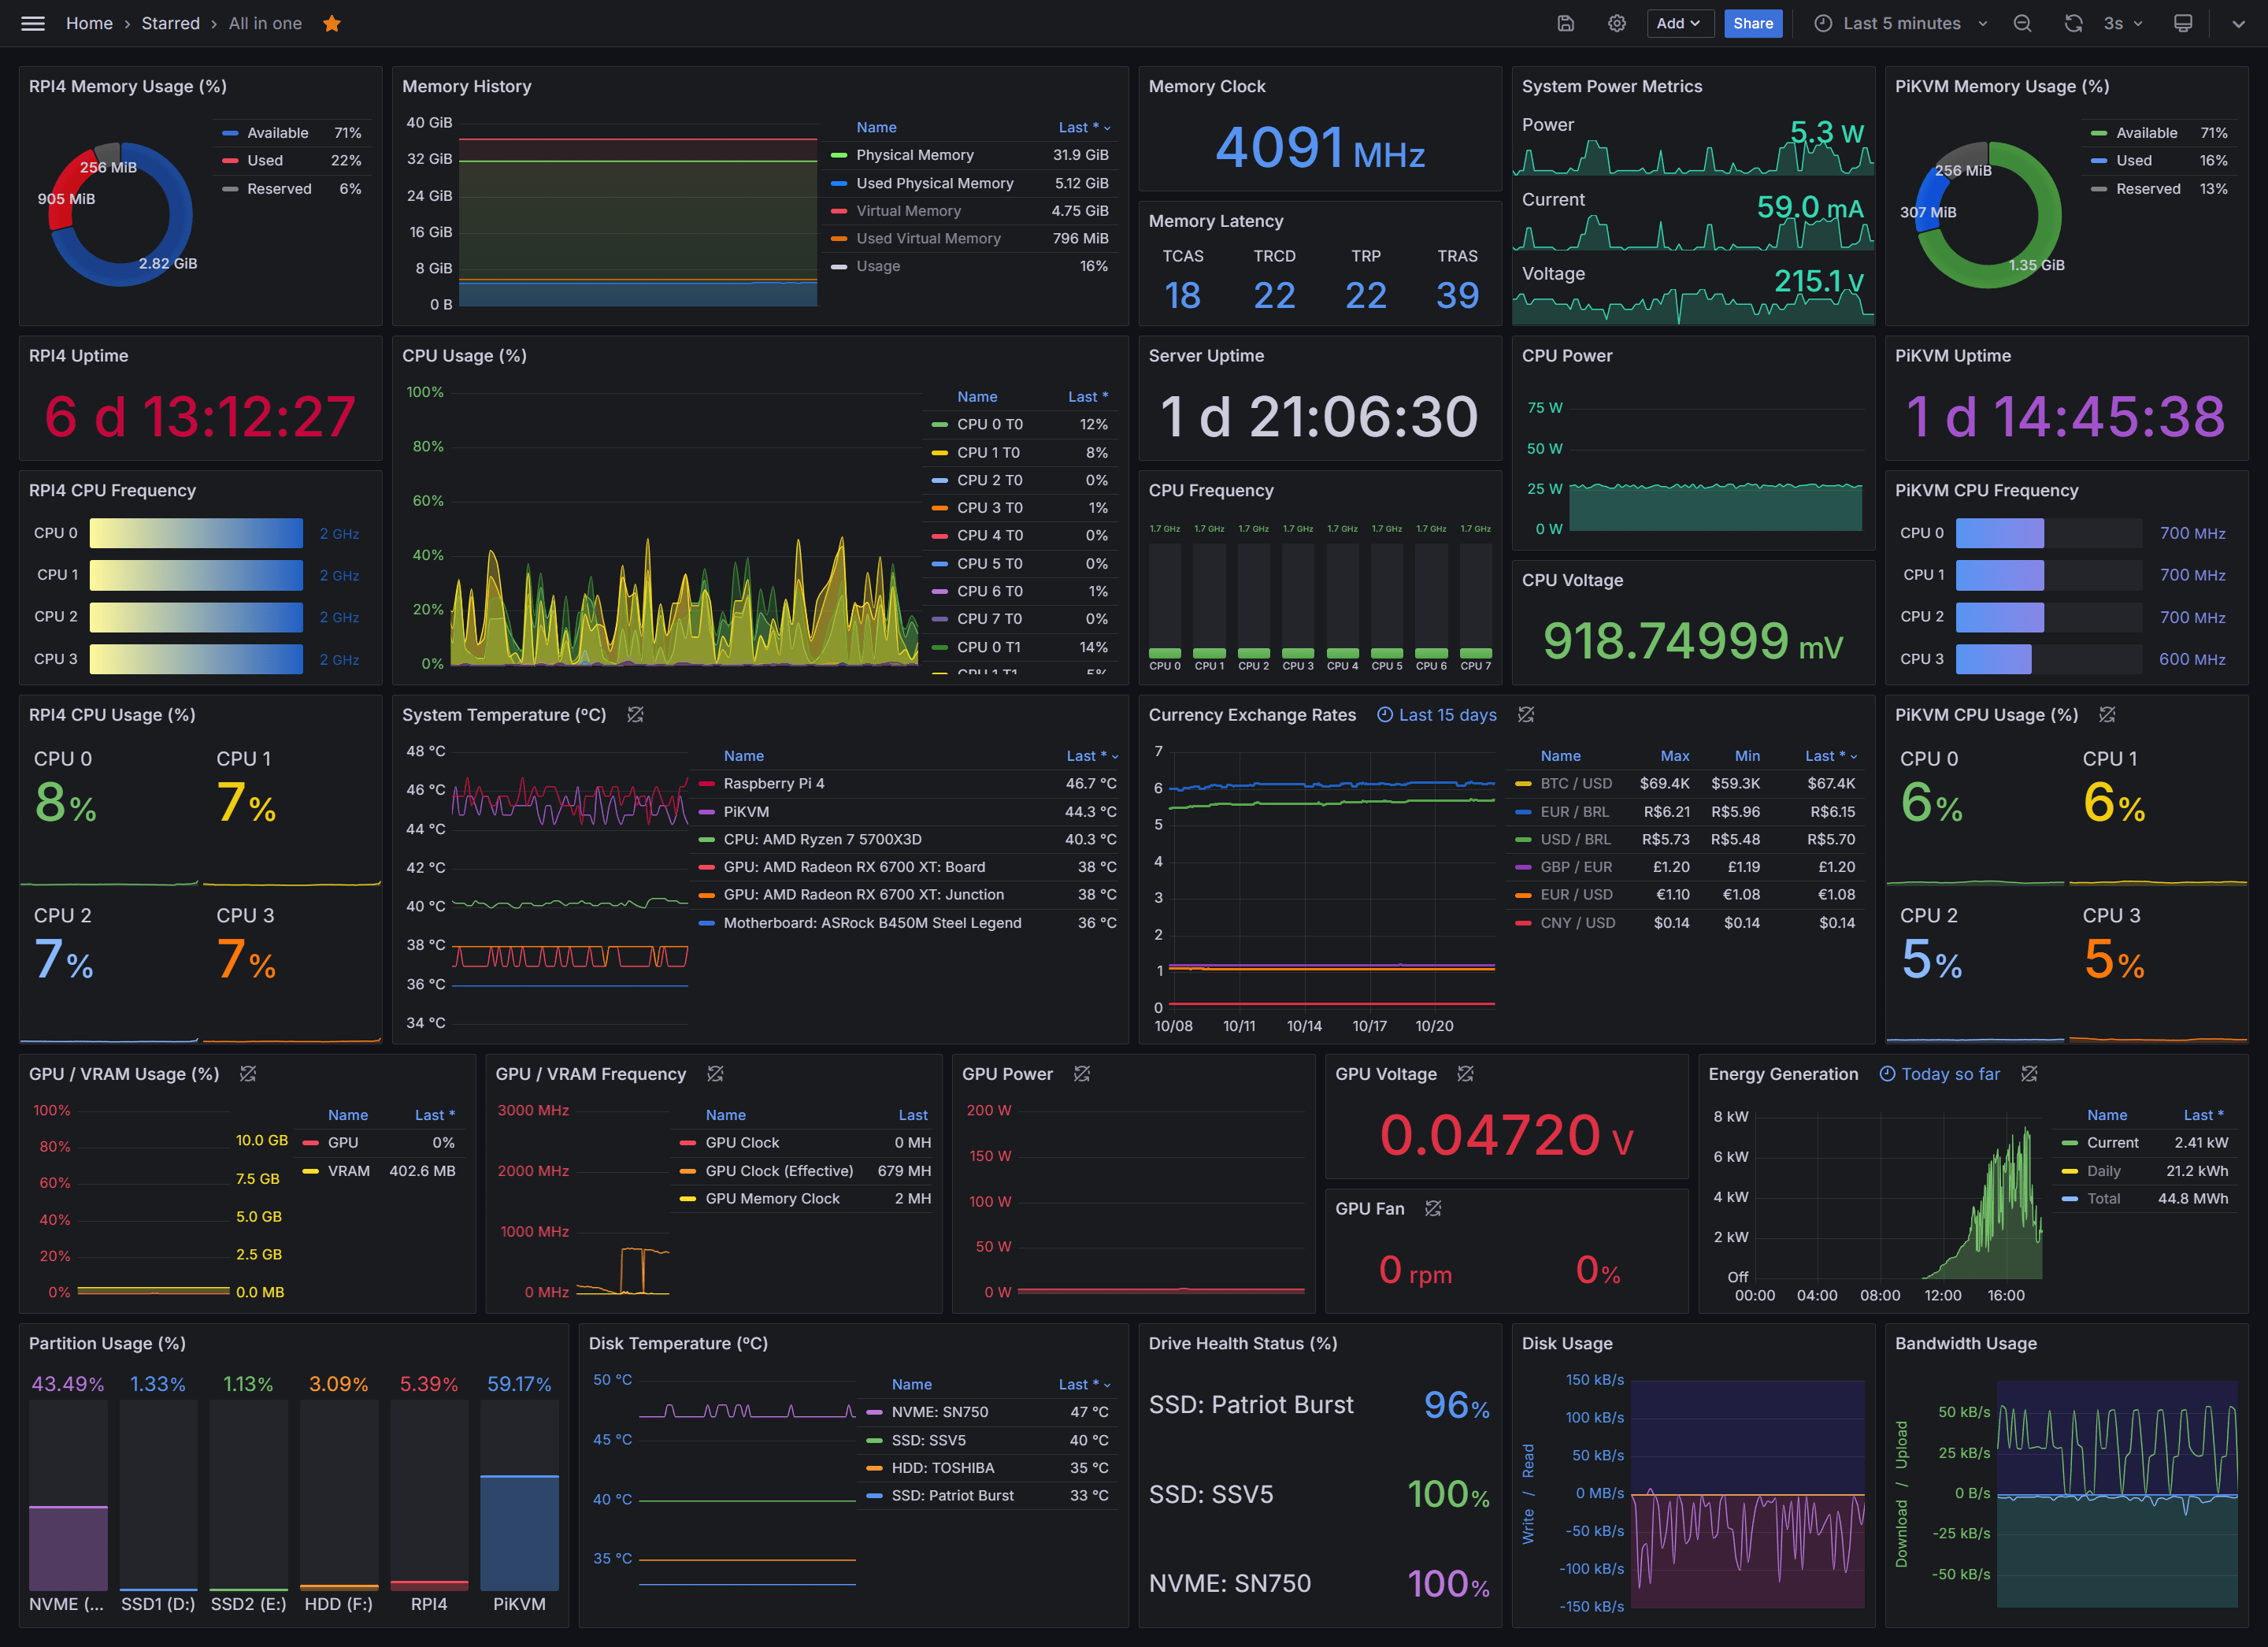
Grafana Cloud splits synthetics into separately metered API and browser testing. Checks cover HTTP, ping, DNS, TCP, and traceroute, plus MultiHTTP checks for multi-step flows and k6 scripted checks that define the same thing in code. Results land beside metrics, logs, and traces, and the stack is OpenTelemetry-native with a self-hosted escape hatch.
The billing unit rewards short tests and punishes long ones. An execution is one test running in one probe location for one minute of runtime, so a 1.5-minute test across five locations consumes ten executions per run.
Limitations: Cost modeling is genuinely hard, since executions scale with test duration as well as frequency and location count, and metrics, logs, traces, and visualization users all meter separately. Nothing scores model output.
Pricing: The free tier covers 100,000 API test executions and 10,000 browser test executions per month. Pro is a $19 monthly platform fee plus $5 per 10,000 API executions and $50 per 10,000 browser executions above that. Enterprise starts at a $25,000 annual spend commitment.
Best fit: Teams already running Prometheus, Loki, and Grafana who want checks in the same pane and are comfortable modeling consumption pricing.
9. Better Stack
Best for: Small teams that want uptime checks, on-call, and status pages on one bill
Deployment: Cloud, with US, EU, and Singapore data regions
Pricing: Free tier, $29 per responder per month billed annually
Better Stack bundles uptime monitoring, on-call scheduling, incident management, and status pages into a single product, priced per responder rather than per seat. Team members are free and unlimited; you pay for the people who get paged. For a small team that would otherwise buy a monitor, a pager, and a status page separately, that consolidation is the whole pitch.
Transaction monitoring runs hosted Playwright checks at $1 per 100 Playwright minutes, which is the cheapest scripted browser testing on this list by a wide margin. Uptime checks go down to 30-second frequency, with multi-location verification before an incident fires.
Limitations: Not HIPAA compliant, which rules it out for teams handling PHI. Pricing is modular to the point of fragmentation, with separate meters for monitors, heartbeats, telemetry bundles, status page features, and reporting, so the real monthly cost rarely resembles the $29 headline. Nothing scores model output.
Pricing: Free covers 10 monitors and heartbeats, 1 status page, and 3 GB of logs at 3-day retention. A responder license is $29 per month billed annually, or $34 monthly, and includes unlimited phone and SMS alerts. Additional monitors run $21 per 50, extra heartbeats $17 per 10, and telemetry bundles start at $25 per month for 40 GB each of logs, traces, and metrics.
Best fit: Startups and small engineering teams consolidating three tools into one, where the agent is one service among several and availability alerting matters more than output scoring.
10. Catchpoint
Best for: Enterprises measuring performance across the internet stack, not just their own endpoints
Deployment: Cloud
Pricing: From $10,000/yr, no free tier
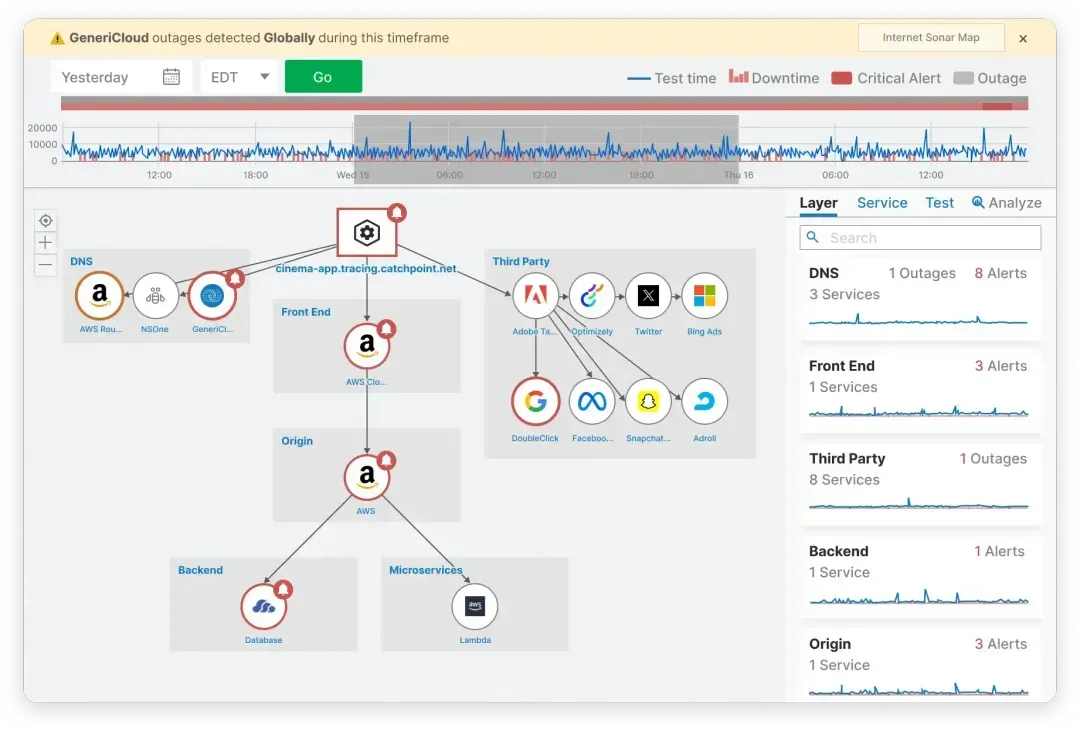
Catchpoint extends synthetic testing past the application into DNS, CDN, BGP, ISP, last-mile, and endpoint measurement. What the price buys is the agent network: more than 3,000 global test agents including vantage points inside wireless and backbone networks, an order of coverage above the twenty-odd locations most platforms offer.
Limitations: No free tier and no self-serve option, so the effective floor is roughly $830 a month, the highest entry point here. The network-layer measurement that justifies the price has little bearing on whether an agent answered correctly.
Pricing: The Expert Plan starts at $10,000 per year with unlimited users and SSO, covering real user monitoring, user journeys, and synthetic testing. Full Internet Performance Monitoring is quoted, and professional services are typically a separate line item.
Best fit: Large organizations whose revenue depends on global reachability, where a regional ISP or DNS fault costs more per hour than the contract does per year.
11. Apica
Best for: Regulated enterprises that need on-premises or hybrid deployment
Deployment: SaaS, on-premises, or hybrid
Pricing: Free tier, paid pricing on quote
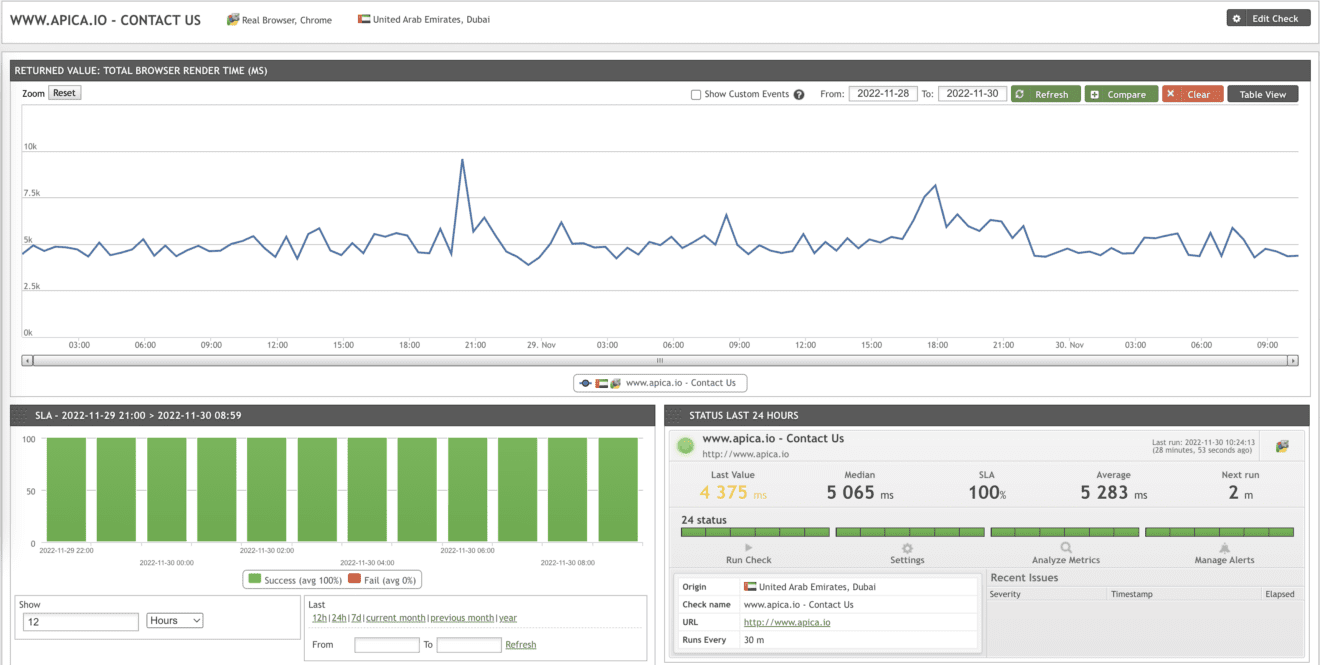
Apica runs synthetic monitoring inside Ascent, its telemetry data management platform. Checks cover websites, applications, APIs, FTP and mail servers, and IoT endpoints, and a scripting tool builds multi-step journeys without writing code. The same scripts drive load tests, so a journey validated in production doubles as a pre-release performance test.
Deployment flexibility is why it appears on enterprise shortlists. SaaS, on-premises, and hybrid are all supported, which matters when checks run against systems no public probe can reach.
Limitations: Only the free tier has published limits, and everything above it is a custom quote with no rate card, which makes budgeting a sales exercise. Synthetic monitoring is one capability inside a telemetry pipeline product rather than the product itself.
Pricing: Ascent Freemium is free with no credit card, covering 1 TB per month of telemetry processing, unlimited users and dashboards, 25 agents, and 30-day retention. Paid tiers are quoted.
Best fit: Banking, healthcare, and public-sector teams that need checks running inside their own perimeter and a procurement process that can absorb a custom quote.
12. Pingdom
Best for: Teams that need cheap external uptime checks and nothing more
Deployment: Cloud, 100+ probe locations
Pricing: From $16.50/mo billed annually, tiered by check count
Pingdom is a SolarWinds product covering uptime checks, page speed monitoring, and transaction monitoring from more than a hundred global locations. Synthetic and real user monitoring are sold as separate subscriptions, and every tier includes unlimited users, so the cost is driven entirely by check volume rather than headcount.
The tier ladder is the constraint worth understanding. Uptime checks and advanced checks are rationed at different rates, and transaction scripts consume advanced slots. The entry tier gives you 10 uptime checks and 1 advanced check, and the ratio stays roughly 10:1 all the way up, so a team wanting five scripted user journeys is buying capacity for 50 uptime checks it will never use.
Limitations: Advanced check scarcity makes multi-step testing expensive relative to the headline price. Transaction checks run as infrequently as every five minutes at the low end. No output scoring, no API-level assertions on payload contents, and no CI integration comparable to the code-first tools here.
Pricing: Synthetic Monitoring starts at $16.50 per month billed annually, or $198 per year, covering 10 uptime checks, 1 advanced check, and 50 SMS alerts. Real User Monitoring is a separate $198 per year for 100,000 pageviews, and running both is $396 per year. Tiers scale to 30,000 uptime checks, and the 14-day trial includes both products.
Best fit: Small teams that want to know when a URL stops responding, at the lowest entry price on this list, and are getting quality signal from somewhere else entirely.
Add output scoring to your monitoring stack
Every classic tool above tells you the endpoint responded. Respan tells you whether the response was right, scoring live traffic and scheduled campaigns against your deployed agent, with cost and latency alerting on the same span data.
Start with what you are actually trying to catch, because the two groups on this list answer different questions and the wrong pick produces green dashboards through real incidents.
Assertion type - Status codes and latency, or output quality. If your failure mode is a plausible wrong answer, a probe asserting on HTTP 200 will never fire.
Billing unit - Check runs, test executions, DEM units, GB-months, or seats. The unit determines which axis makes your bill grow, and the answer is usually frequency multiplied by locations.
Frequency floor - How often a check can run. Minimum intervals range from 10 seconds to 5 minutes depending on tool and tier, and drift you catch in five minutes is drift a user already hit.
Private locations - Whether checks can run against internal or staging environments behind a firewall. Usually gated to higher tiers.
CI integration - Whether tests run on deploy with a threshold that blocks a release, not just on a schedule after it ships.
Alert routing - Where failures go, and whether thresholds can be scoped narrowly enough to avoid paging on a single flaky run.
The pattern worth avoiding is buying one tool and assuming it covers both jobs. A probe network will tell you the agent is reachable while it hallucinates, and an eval platform will score outputs beautifully while the gateway in front of it is returning 503s to everyone.
Synthetic monitoring vs real user monitoring
Active vs passive monitoring
Synthetic monitoring is active. It generates its own traffic on a fixed schedule from infrastructure you configure, so it produces data whether or not anyone is using the application. Real user monitoring is passive. It instruments the client and reports what actual users experienced, which means it produces nothing until someone shows up.
That difference decides when each one tells you something. A synthetic check runs at 3am against a code path nobody has touched since Friday. RUM cannot see that path until a user walks it.
What each one catches
Synthetic monitoring catches regressions before users hit them, covers paths that are critical but low-traffic, and gives a clean baseline because the input is identical every run. That last property is what makes it work for LLM applications at all: holding the prompt constant is the only way to attribute an output change to the model rather than the question.
Real user monitoring catches everything your scripts did not anticipate. Real prompts, real devices, real network conditions, real edge cases. For an LLM application, RUM is where you find out that a quarter of users are asking something nobody wrote a test for.
The limitation is symmetrical. Synthetic only covers what someone scripted, and scripts drift out of date as the application changes. RUM only reports what already happened to someone.
Why LLM teams need both
Run scheduled checks against a fixed set of known-good inputs to detect drift, and score live production traffic to find out what users are actually asking. The scheduled checks give you an alertable baseline. The production scoring gives you the next generation of test cases, because a failing real trace is the best synthetic input you will ever write.
Respan supports both patterns from the same span data, so a failure found in live traffic becomes a dataset entry that runs on every subsequent campaign.
Frequently Asked Questions
What is the difference between synthetic monitoring and uptime monitoring?
Uptime monitoring is one kind of synthetic monitoring. It sends a request to a URL and checks whether the response arrives and returns an acceptable status code. Synthetic monitoring covers that plus API checks with assertions on payload contents, browser checks that drive scripted user journeys, and, for LLM applications, scored checks that evaluate the content of a model response.
How often should synthetic checks run?
For availability checks on revenue-critical endpoints, every one to five minutes is typical, and the floor is set by your tool and tier. For scored LLM checks, hourly or daily is usually enough, because you are watching for behavioral drift rather than outages, and every run costs tokens on top of the platform charge. The tradeoff is direct: frequency multiplied by location count is what your bill scales with.
Can synthetic monitoring test AI agents?
Yes, but only if the assertion evaluates the response rather than the status code. Classic synthetic tools can confirm an agent endpoint is reachable and measure its latency. Confirming the agent still answers correctly, still calls the right tools, and still costs what it did last week requires an evaluator scoring the output, which is what eval-led platforms provide.
Does synthetic monitoring replace evals?
No. Evals measure output quality against a dataset, usually in development or CI. Synthetic monitoring is a scheduling and alerting pattern that runs checks against production and pages someone when they fail. For an LLM application the two combine: the eval is the assertion, and the synthetic schedule is what makes it run in production instead of only on merge.
How much does synthetic monitoring cost?
Entry pricing ranges from free tiers through roughly $200 per month for eval-led platforms up to $10,000 per year for enterprise IPM vendors with no self-serve option. Comparing headline prices is misleading because the billing units differ. Check runs, test executions, weighted DEM units, GB-months, and per-seat licensing all scale differently, and the honest estimate comes from modeling your own frequency, location count, and test duration against each vendor's unit.