
A team of six engineers hits the wall in the same place every time. Five of them sit on New Relic's Standard edition at $10 for the first full platform user and $99 for each one after. The sixth engineer joins the on-call rotation, Standard caps at five full platform users, and the only way forward is Pro at $349 per user per month on an annual commitment. The bill goes from $406 to $2,094 overnight, and nothing about the application changed.
That cliff is why most searches for New Relic alternatives start. The second reason shows up a quarter later, when an agent feature ships and the traces coming back describe HTTP calls to an inference endpoint rather than the prompt, the tool calls, and the retry that ran unattended all weekend.
Cost and coverage are the two axes that matter, and they pull in different directions. Cheaper tools tend to cover less. Broader tools tend to bill on more meters.
The ten New Relic alternatives below are ordered from the platforms that cover the widest observability surface down to the infrastructure and error-tracking tools that do one slice well, with pricing, deployment options, and coverage for every one.
What Is New Relic and What Does It Do?
New Relic is a full-stack observability platform that collects metrics, logs, traces, and events into a single data store called NRDB and queries them with a proprietary language, NRQL. It launched as an application performance monitoring tool and expanded outward from there. Every signal lands in one pool metered by the gigabyte, with a separate per-seat charge layered on top.
What Is New Relic Used For?
Teams use New Relic to find out why a request got slow and which change caused it. Here are the capabilities most teams actually run:
- APM with distributed tracing - Transaction traces across services, with code-level detail on the slow path.
- Infrastructure monitoring - Host, container, and Kubernetes metrics, with unlimited hosts included at no extra charge.
- Log management - Ingest, search, and logs-in-context alongside the trace that produced them.
- Digital experience monitoring - Browser, mobile, session replay, and synthetic checks.
- Error tracking - An errors inbox that groups exceptions and ties them to releases.
- AIOps and alerting - Dynamic thresholds, anomaly detection, and incident correlation.
The unusual part of the model is that hosts, containers, agents, and cloud functions are all free. New Relic does not count them. What it counts is how much telemetry you send and how many engineers can look at it.
New Relic Pricing
New Relic bills on two meters that most teams feel: user seats and data ingest. The free tier is real and is the most generous in the category, covering 100 GB of ingest per month, one full platform user, unlimited basic users, 500 synthetic checks, and 8-day default retention with no credit card required.
Seats are the meter that decides who can debug production:
- Basic users - Free and unlimited on every edition, with access to dashboards, queries, alerts, and instrumentation.
- Core users - $49 per user per month across all paid editions, adding error tracking, logs, and IDE telemetry through CodeStream.
- Full platform users - $10 for the first user and $99 for each additional on Standard, capped at five; $349 per user annually or $418.80 month to month on Pro with no cap; quoted on Enterprise.
Data runs $0.40 per GB past the free 100 GB on the original option, or $0.60 per GB on Data Plus, which buys up to 90 days of extended retention, advanced log obfuscation, historical export, and, on Enterprise, the FedRAMP Moderate and HIPAA eligibility regulated teams need.
The 10 Best New Relic Alternatives
New Relic Alternatives Compared
| Platform | Pricing model | Starting price | Deployment | Best for |
|---|---|---|---|---|
| Respan | Usage-based, per log and score | Free, then $199/mo | Cloud | Teams running LLM apps and agents in production |
| Datadog | Per host, per GB, per product | $15/host/mo | SaaS | Widest integration catalog in one product |
| Dynatrace | Consumption, per memory-GiB-hour | $58/mo per 8 GiB host | SaaS, managed, self-hosted | Automated root cause across a live topology |
| Splunk Observability Cloud | Per host, per component | $15/host/mo | SaaS | Observability and SIEM under one contract |
| Honeycomb | Event volume | Free, then $150/mo | SaaS, Private Cloud on Enterprise | High-cardinality tracing without seat fees |
| Grafana | Usage-based plus platform fee | Free, then $19/mo | Cloud, self-host, BYOC | Open-source stacks and dashboard portability |
| Elastic Observability | Per GB or provisioned resources | $0.07/GB ingested | Serverless, hosted, self-managed | Search-heavy log workloads |
| Sentry | Event volume | Free, then $26/mo | SaaS, self-hosted | Error tracking for application teams |
| Zabbix | Free software, paid support | Free, support from €245/mo | Self-hosted, Zabbix Cloud | Infrastructure and network monitoring at zero license cost |
| Nagios | Free core, node-based license | Free, XI from ~$1,995 | Self-hosted | Host and service checks on owned hardware |
1. Respan
- Deployment: Cloud
- Pricing: Free, then $199/month
- Compliance: SOC 2, HIPAA with BAA, GDPR, ISO 27001
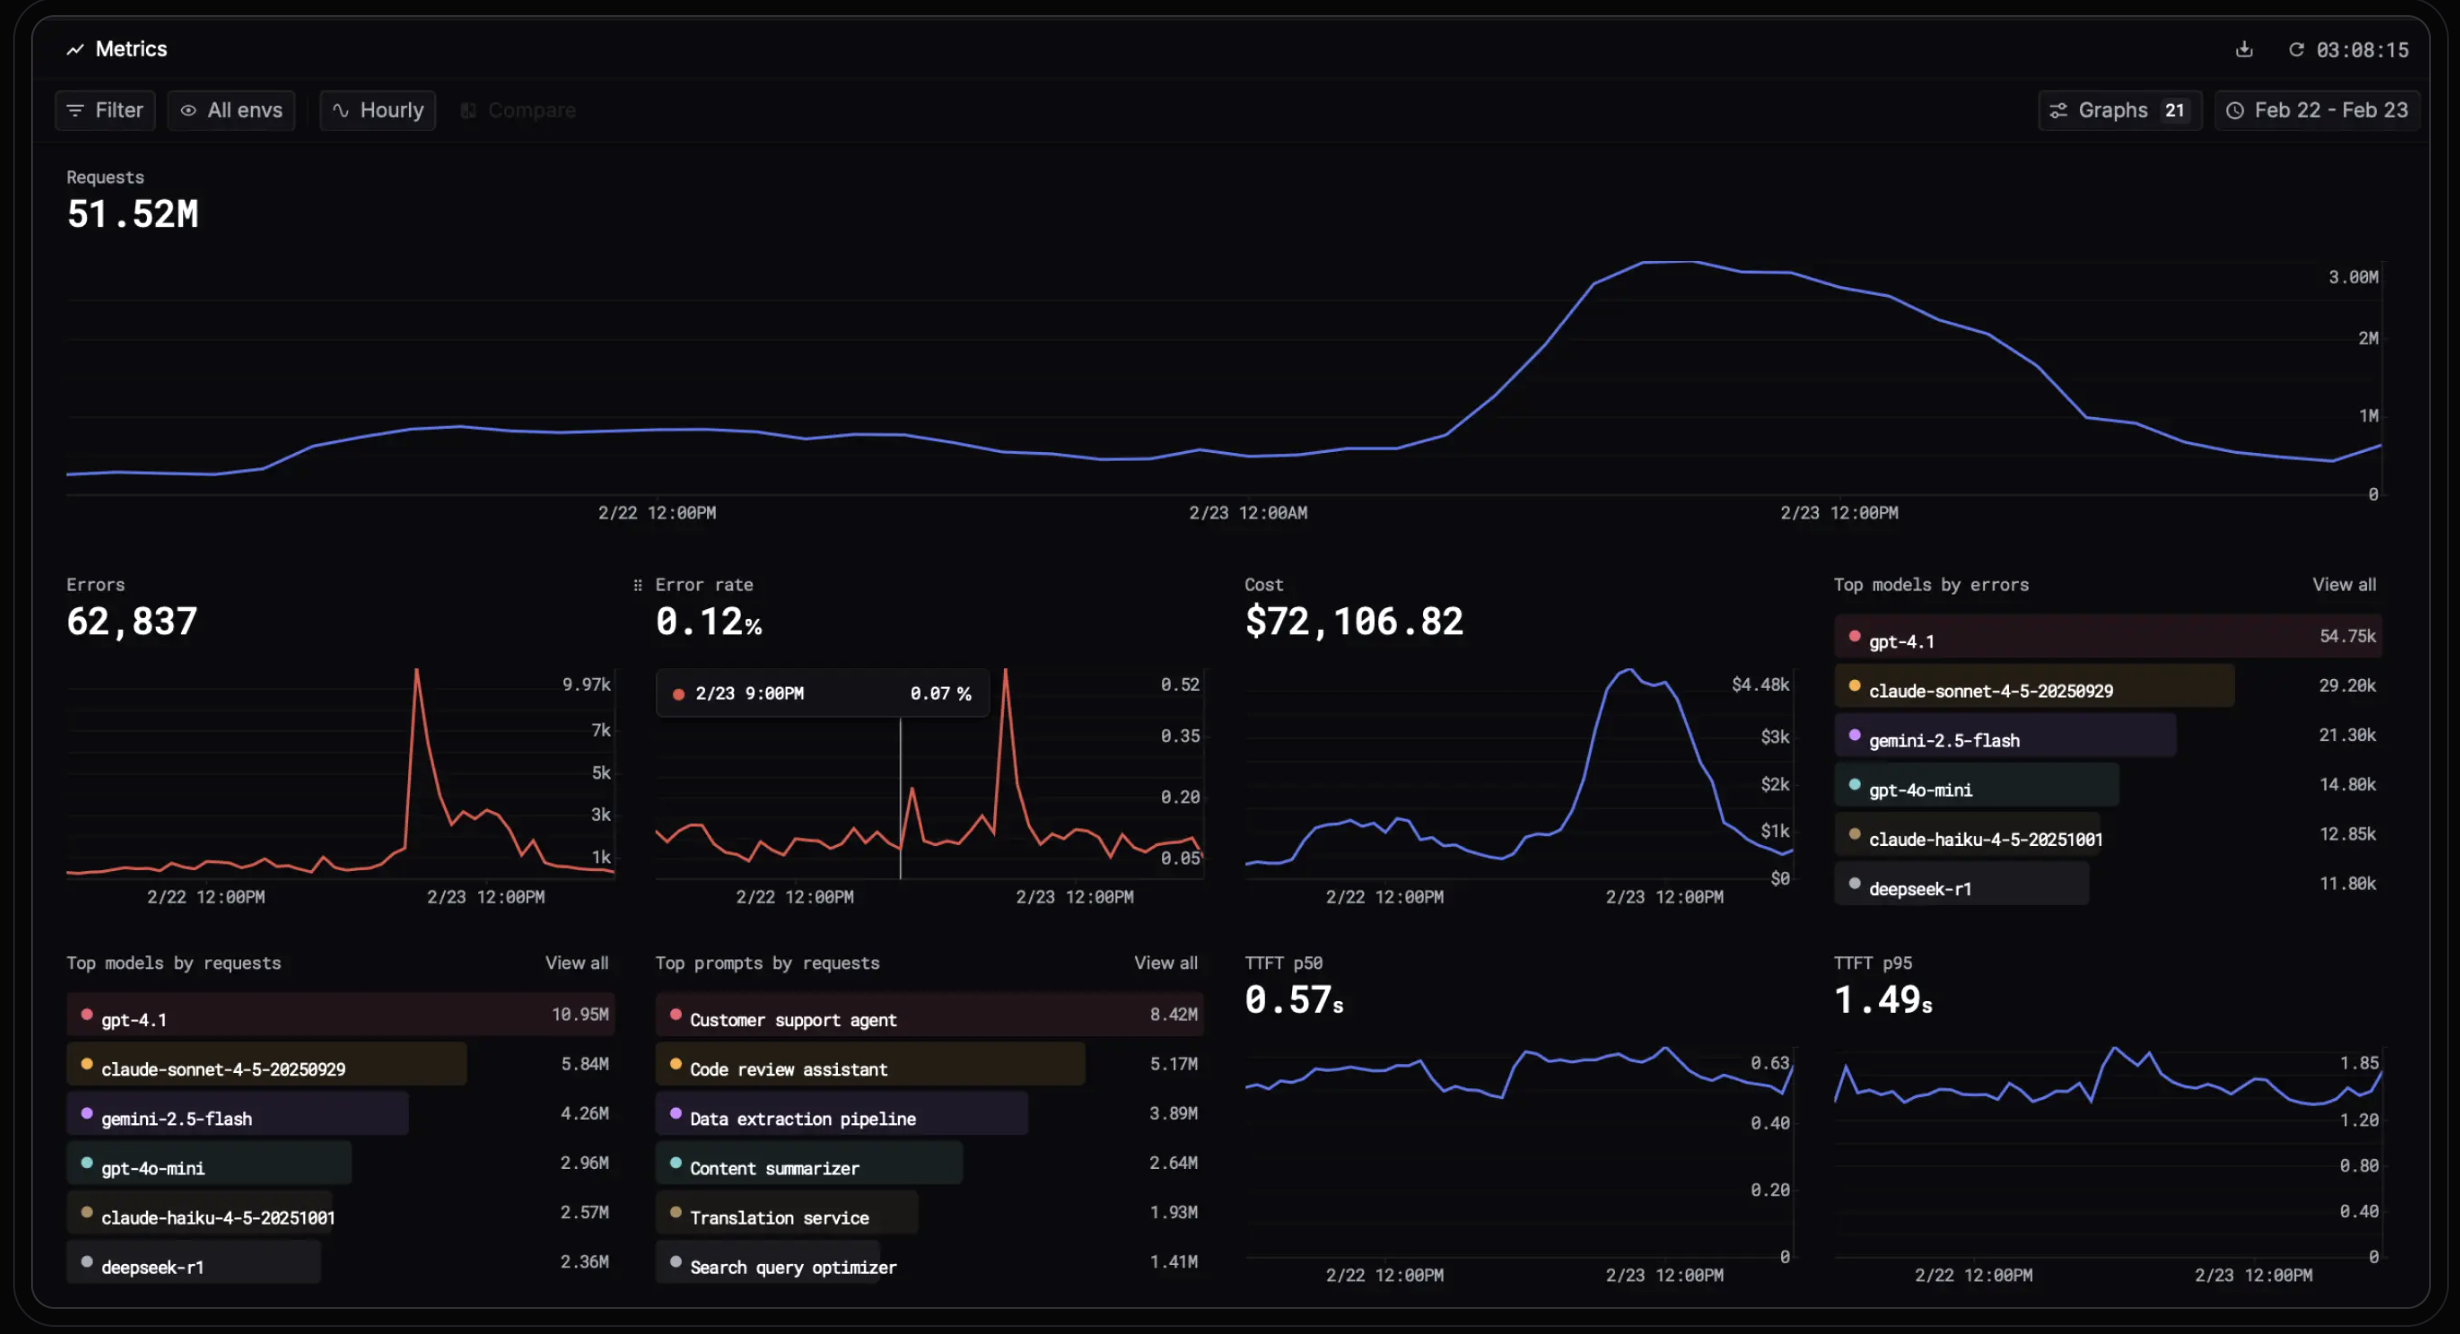
New Relic tells you a call to your inference provider took 4.2 seconds and returned a 200. It does not tell you which prompt version produced it, which tool call looped, what the response cost in tokens, or whether the output was correct. Respan covers that layer on the same platform that routes the traffic, so every metric traces back to the run behind it.
The gateway is the way in. One endpoint reaches 1,000+ models with automatic failover, spend controls, and caching, adding about 10ms at P95. Every call through it is logged and traceable from the first request, so observability arrives without a separate instrumentation project.
What that gets you in production:
- See exactly what an agent did - Full trace trees over every prompt, tool call, and response in a multi-step run, searchable by latency, cost, quality, and custom metadata, with production sessions replayable in the playground.
- Measure quality with scores, not vibes - Rule-based checks and LLM-as-a-judge scoring live traffic in real time, with versioned datasets built from production traces and compared against a baseline.
- Know where every dollar goes - Token spend broken down by user, tenant, model, and workflow, with monitors and alerts on the numbers that move.
- Ship prompt changes without guessing - Versioning, a collaborative IDE, one-click deployment, and release management, so a quality regression maps to the change that caused it.
- Stay up when a provider degrades - Automatic retries and failover across providers, load balancing, and caching, all configured at the gateway rather than in application code.
- Catch failures before users report them - Error spikes tied to contributing failures, plus behaviors that surface recurring patterns across agent interactions.
- Test what your agent blocks - Red teaming against deployed agents to see what gets through, on your terms.
- Pass a security review - SOC 2, HIPAA with BAA, GDPR, and ISO 27001, with PII masking and log omission available.
Pricing: Free covers 100k logs, 1k scores, and unlimited seats at 7-day retention. Team is $199 per month billed yearly, lifting datasets, evaluators, and prompts to unlimited, extending retention to 30 days. Enterprise adds SAML, a HIPAA BAA, and a 99.99% uptime SLA.
Best fit: Teams past the prototype stage running LLM applications and agents in production, where reliability, cost, and output quality all have to be measurable in one place.
See exactly what your agents did
New Relic tells you the call returned a 200. Respan shows you the prompt, the tool calls, the token cost, and the eval score behind it, so a bad output traces back to the step that caused it. Free to start, no credit card required.
2. Datadog
- Deployment: SaaS, CloudPrem for logs
- Pricing: From $15/host/month
- OpenTelemetry: OTLP ingest alongside the Datadog Agent
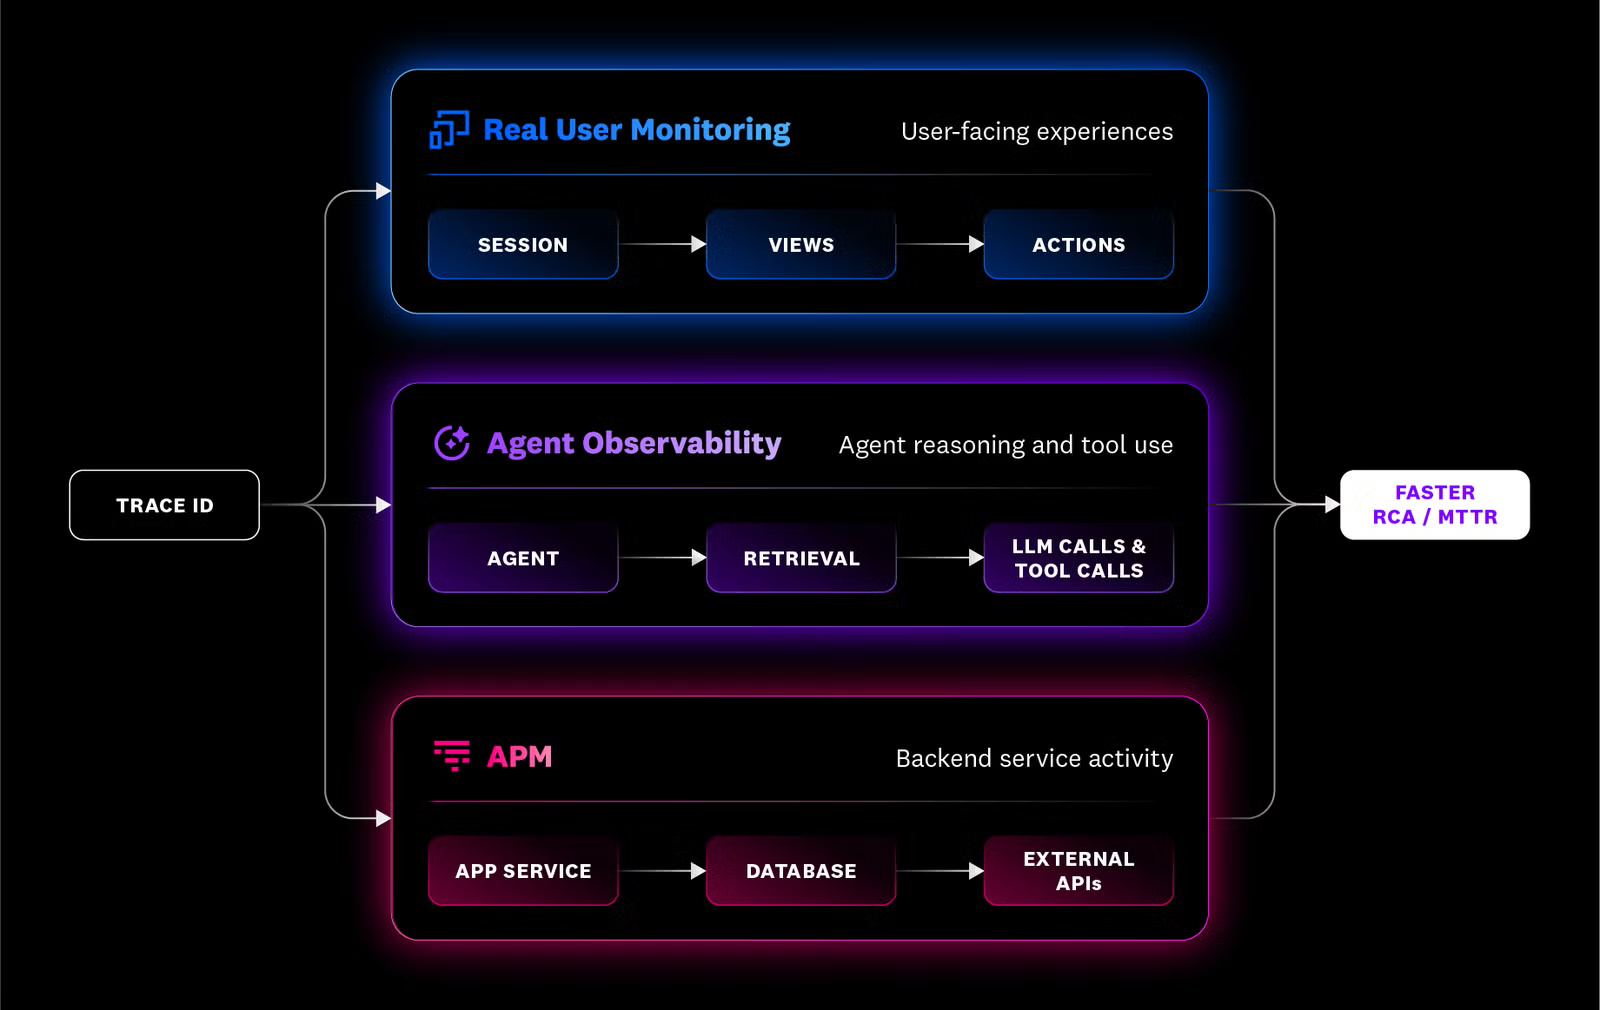
Datadog covers infrastructure, APM, logs, RUM, synthetics, and security behind one interface with over 1,000 integrations. If your incidents start in Kubernetes rather than in application code, it will feel more natural than New Relic's application-first view.
Run the host math before you commit. Datadog meters hourly, discards the top 1% of hours, and bills the full month at the peak of what remains, so one five-day traffic spike sets the rate for all thirty days. In Kubernetes the billing unit is the node, not the pod, and a misconfigured agent running as a sidecar counts every pod as a host.
Pricing: Infrastructure Pro is $15 per host per month annually and $18 on demand, with Enterprise at $23 and $27. APM is $31 per host with Infrastructure attached and $36 standalone, rising to $40 and $47 for APM Enterprise. Logs ingest at $0.10 per GB and index at $1.70 per million events. The free tier covers five hosts at 1-day retention.
Best fit: Teams leaving New Relic over seat costs rather than total spend. Datadog removes the per-user problem and replaces it with several usage meters, which is worth doing if headcount is growing faster than host count and not if the reverse is true.
3. Dynatrace
- Deployment: SaaS, managed, self-hosted
- Pricing: From $58/month per 8 GiB host
- OpenTelemetry: OTLP ingest alongside OneAgent
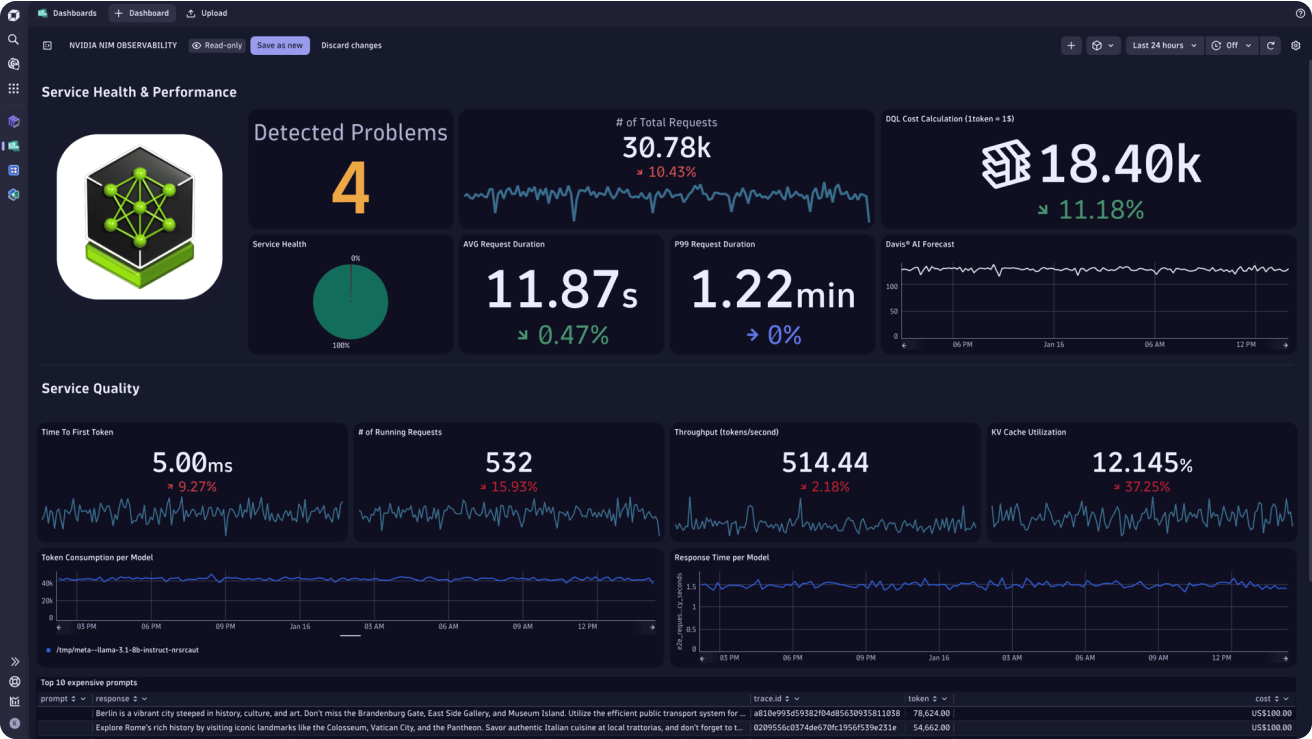
Dynatrace installs OneAgent once per host and discovers topology on its own, then Davis traces root cause deterministically against that live dependency graph. If your estate is large enough that querying your way to an answer does not scale, that automation is the reason to look.
Two constraints come with using Dynatrace: 1. OneAgent is proprietary and needs deep host access, so running OTel alongside it does not make the deployment portable. 2. And billing rounds to 15-minute intervals with a 4 GiB memory floor per host, which inflates the effective rate on small and ephemeral workloads well past the headline number.
Pricing: Full-Stack Monitoring is $58 per month for an 8 GiB host at $0.01 per memory-GiB-hour, with Infrastructure Monitoring at $29 and Foundation & Discovery at $7. Kubernetes Platform Monitoring is $1.40 per pod and free on Full-Stack hosts. Logs ingest at $0.20 per GiB. Nothing on the rate card charges per user.
Best fit: Enterprise operations teams where APM depth justifies a proprietary agent. The absence of seat pricing makes it the cleanest answer to New Relic's cost model for large teams, provided you model host memory carefully first.
4. Splunk
- Deployment: SaaS
- Pricing: From $15/host/month
- OpenTelemetry: Splunk distribution of the OTel Collector
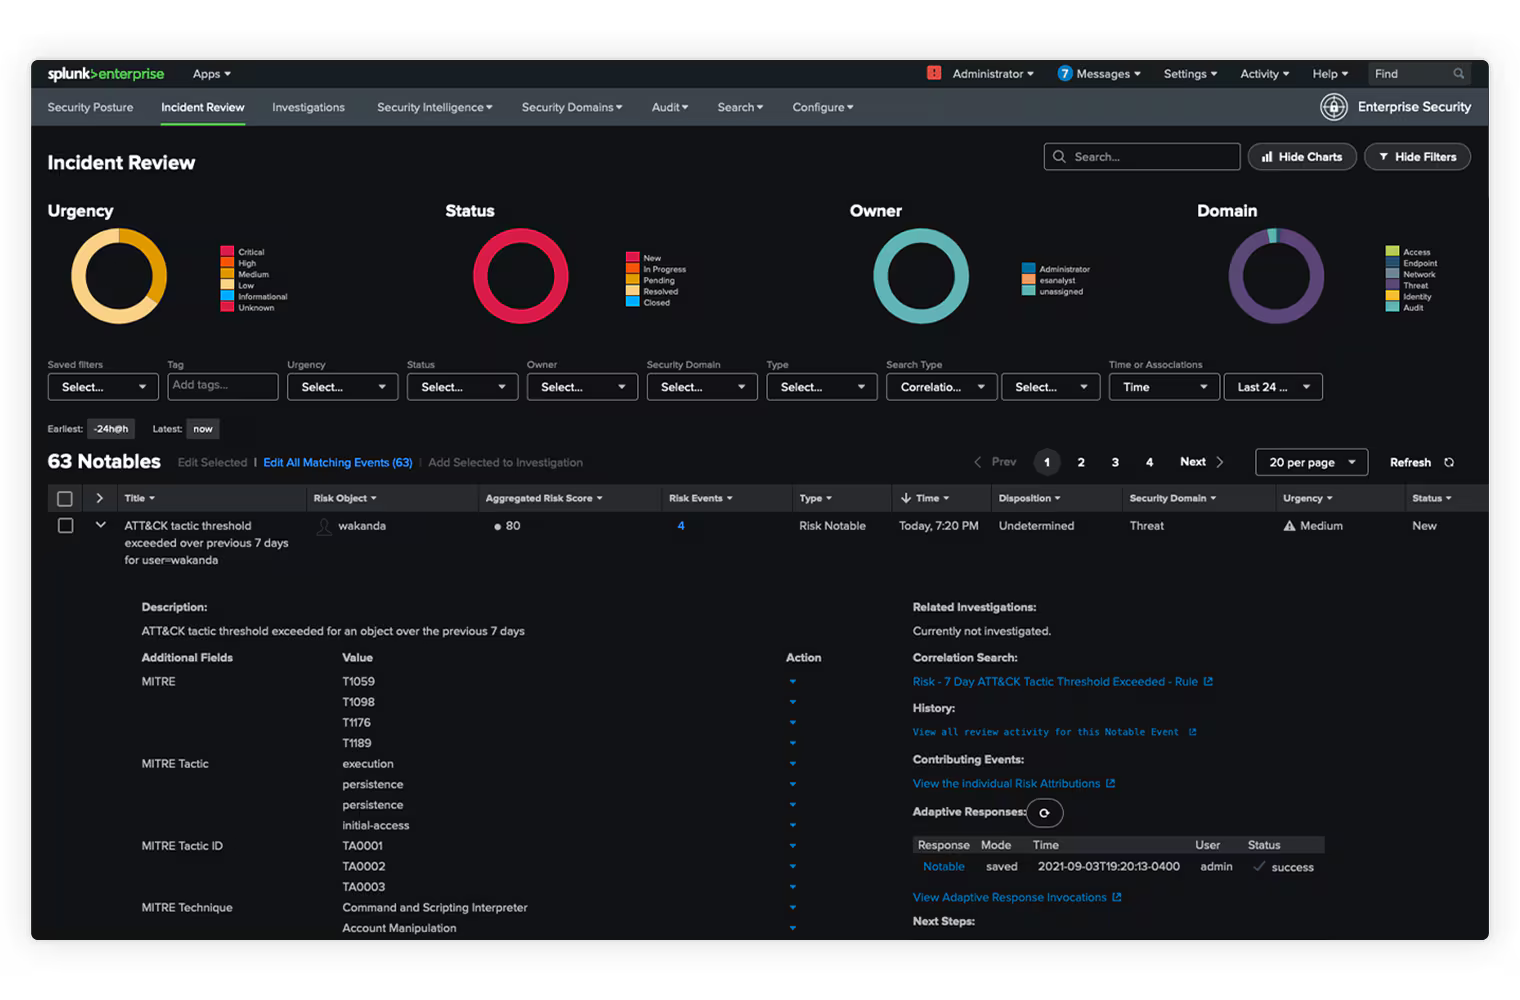
Splunk Observability Cloud covers infrastructure, APM, RUM, synthetics, and database monitoring, with NoSample tracing that collects full trace data rather than sampling. The case for it is consolidation: it sits under Cisco alongside Splunk Enterprise Security, so observability and security investigations can share a contract.
That case weakens fast if you are not already a Splunk shop. Each SKU meters separately per host, and Database Monitoring bills on top of whichever bundle you pick. Self-hosting is not available for Observability Cloud, so if data residency is what is pushing you off New Relic, this does not solve it.
Pricing: Infrastructure starts at $15 per host per month billed annually, App & Infrastructure at $60, and End-to-End at $75. Standalone APM is $55 per host. RUM bills at $14 per 10,000 sessions, synthetics at $1 per 10,000 uptime requests, and Database Monitoring at $75 per instance.
Best fit: Organizations already running Splunk for security that want one vendor across both. Coming to it fresh for observability alone means inheriting the platform's complexity without the consolidation payoff.
5. Honeycomb
- Deployment: SaaS, Private Cloud on Enterprise
- Pricing: Free, then from $150/month
- OpenTelemetry: Native, no proprietary agent
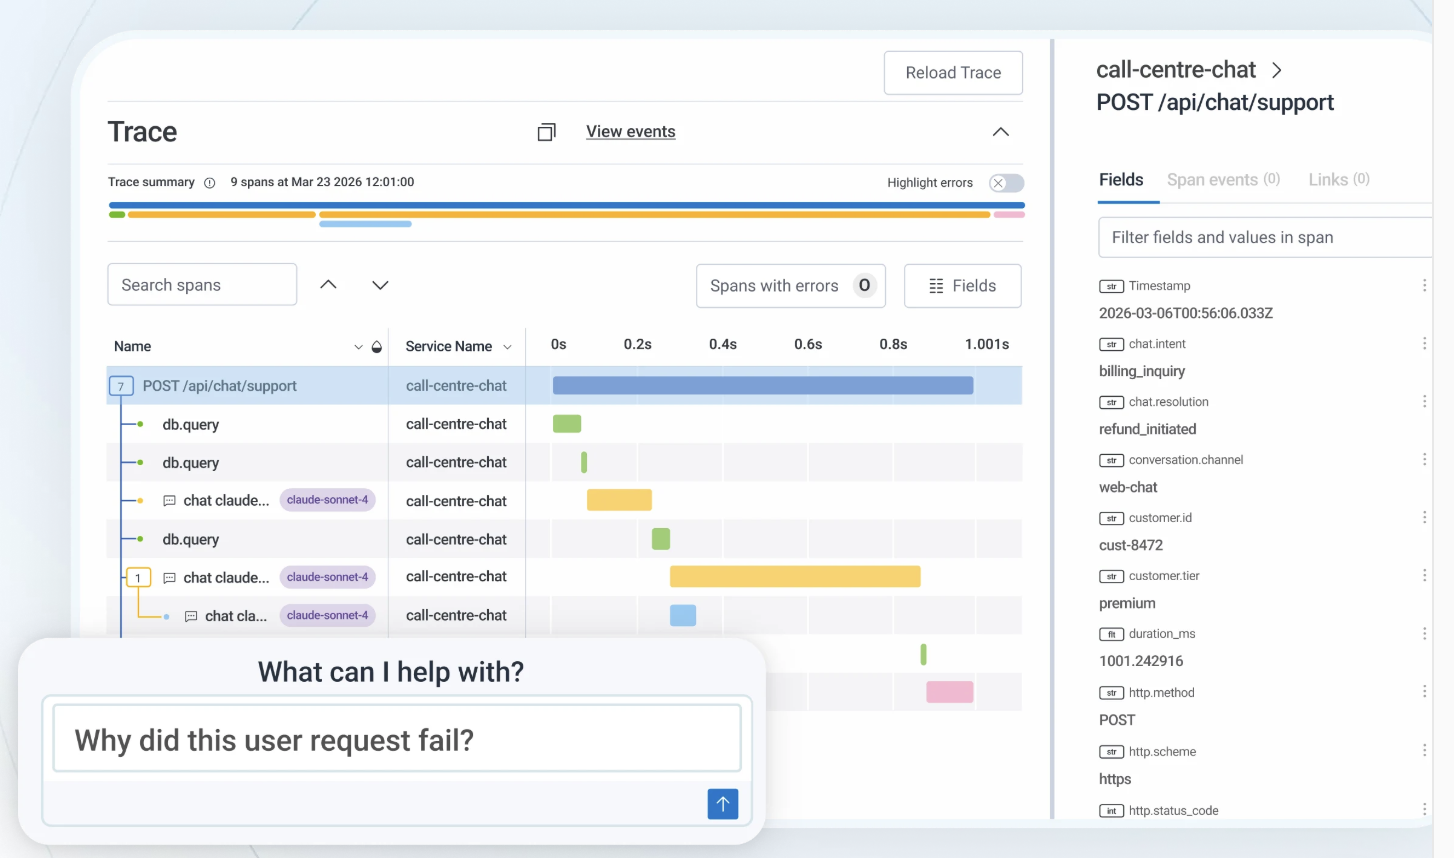
Honeycomb stores wide events and derives logs, metrics, and traces from them, so a query can filter on any field without someone having decided in advance that the field mattered. Unlimited seats and unlimited querying on every plan, including Free, make it the most direct answer on this list to New Relic's seat problem.
Check your trace depth before modeling cost. Pricing meters events, and a trace with 150 spans counts as 150 events, so instrumentation granularity drives the bill in a way host counts never do. The product also leads with tracing, and teams whose daily workflow is log search will find that surface thinner than New Relic's.
Pricing: Free covers 20M events and 100M metrics data points monthly. Pro starts at $150 per month for 50M events, scaling to 750M events and 3.75B data points with SSO and two SLOs. Enterprise is custom with a base of 10 billion events per year, Service Map, and Private Cloud. Events and logs carry fixed 60-day retention.
Best fit: Tracing-led teams debugging distributed services, particularly where the reason for leaving New Relic is that half the engineers cannot afford a seat to investigate anything.
6. Grafana
- Deployment: Cloud, self-hosted, Bring Your Own Cloud
- Pricing: Free, then from $19/month
- OpenTelemetry: OTLP-compatible via Alloy
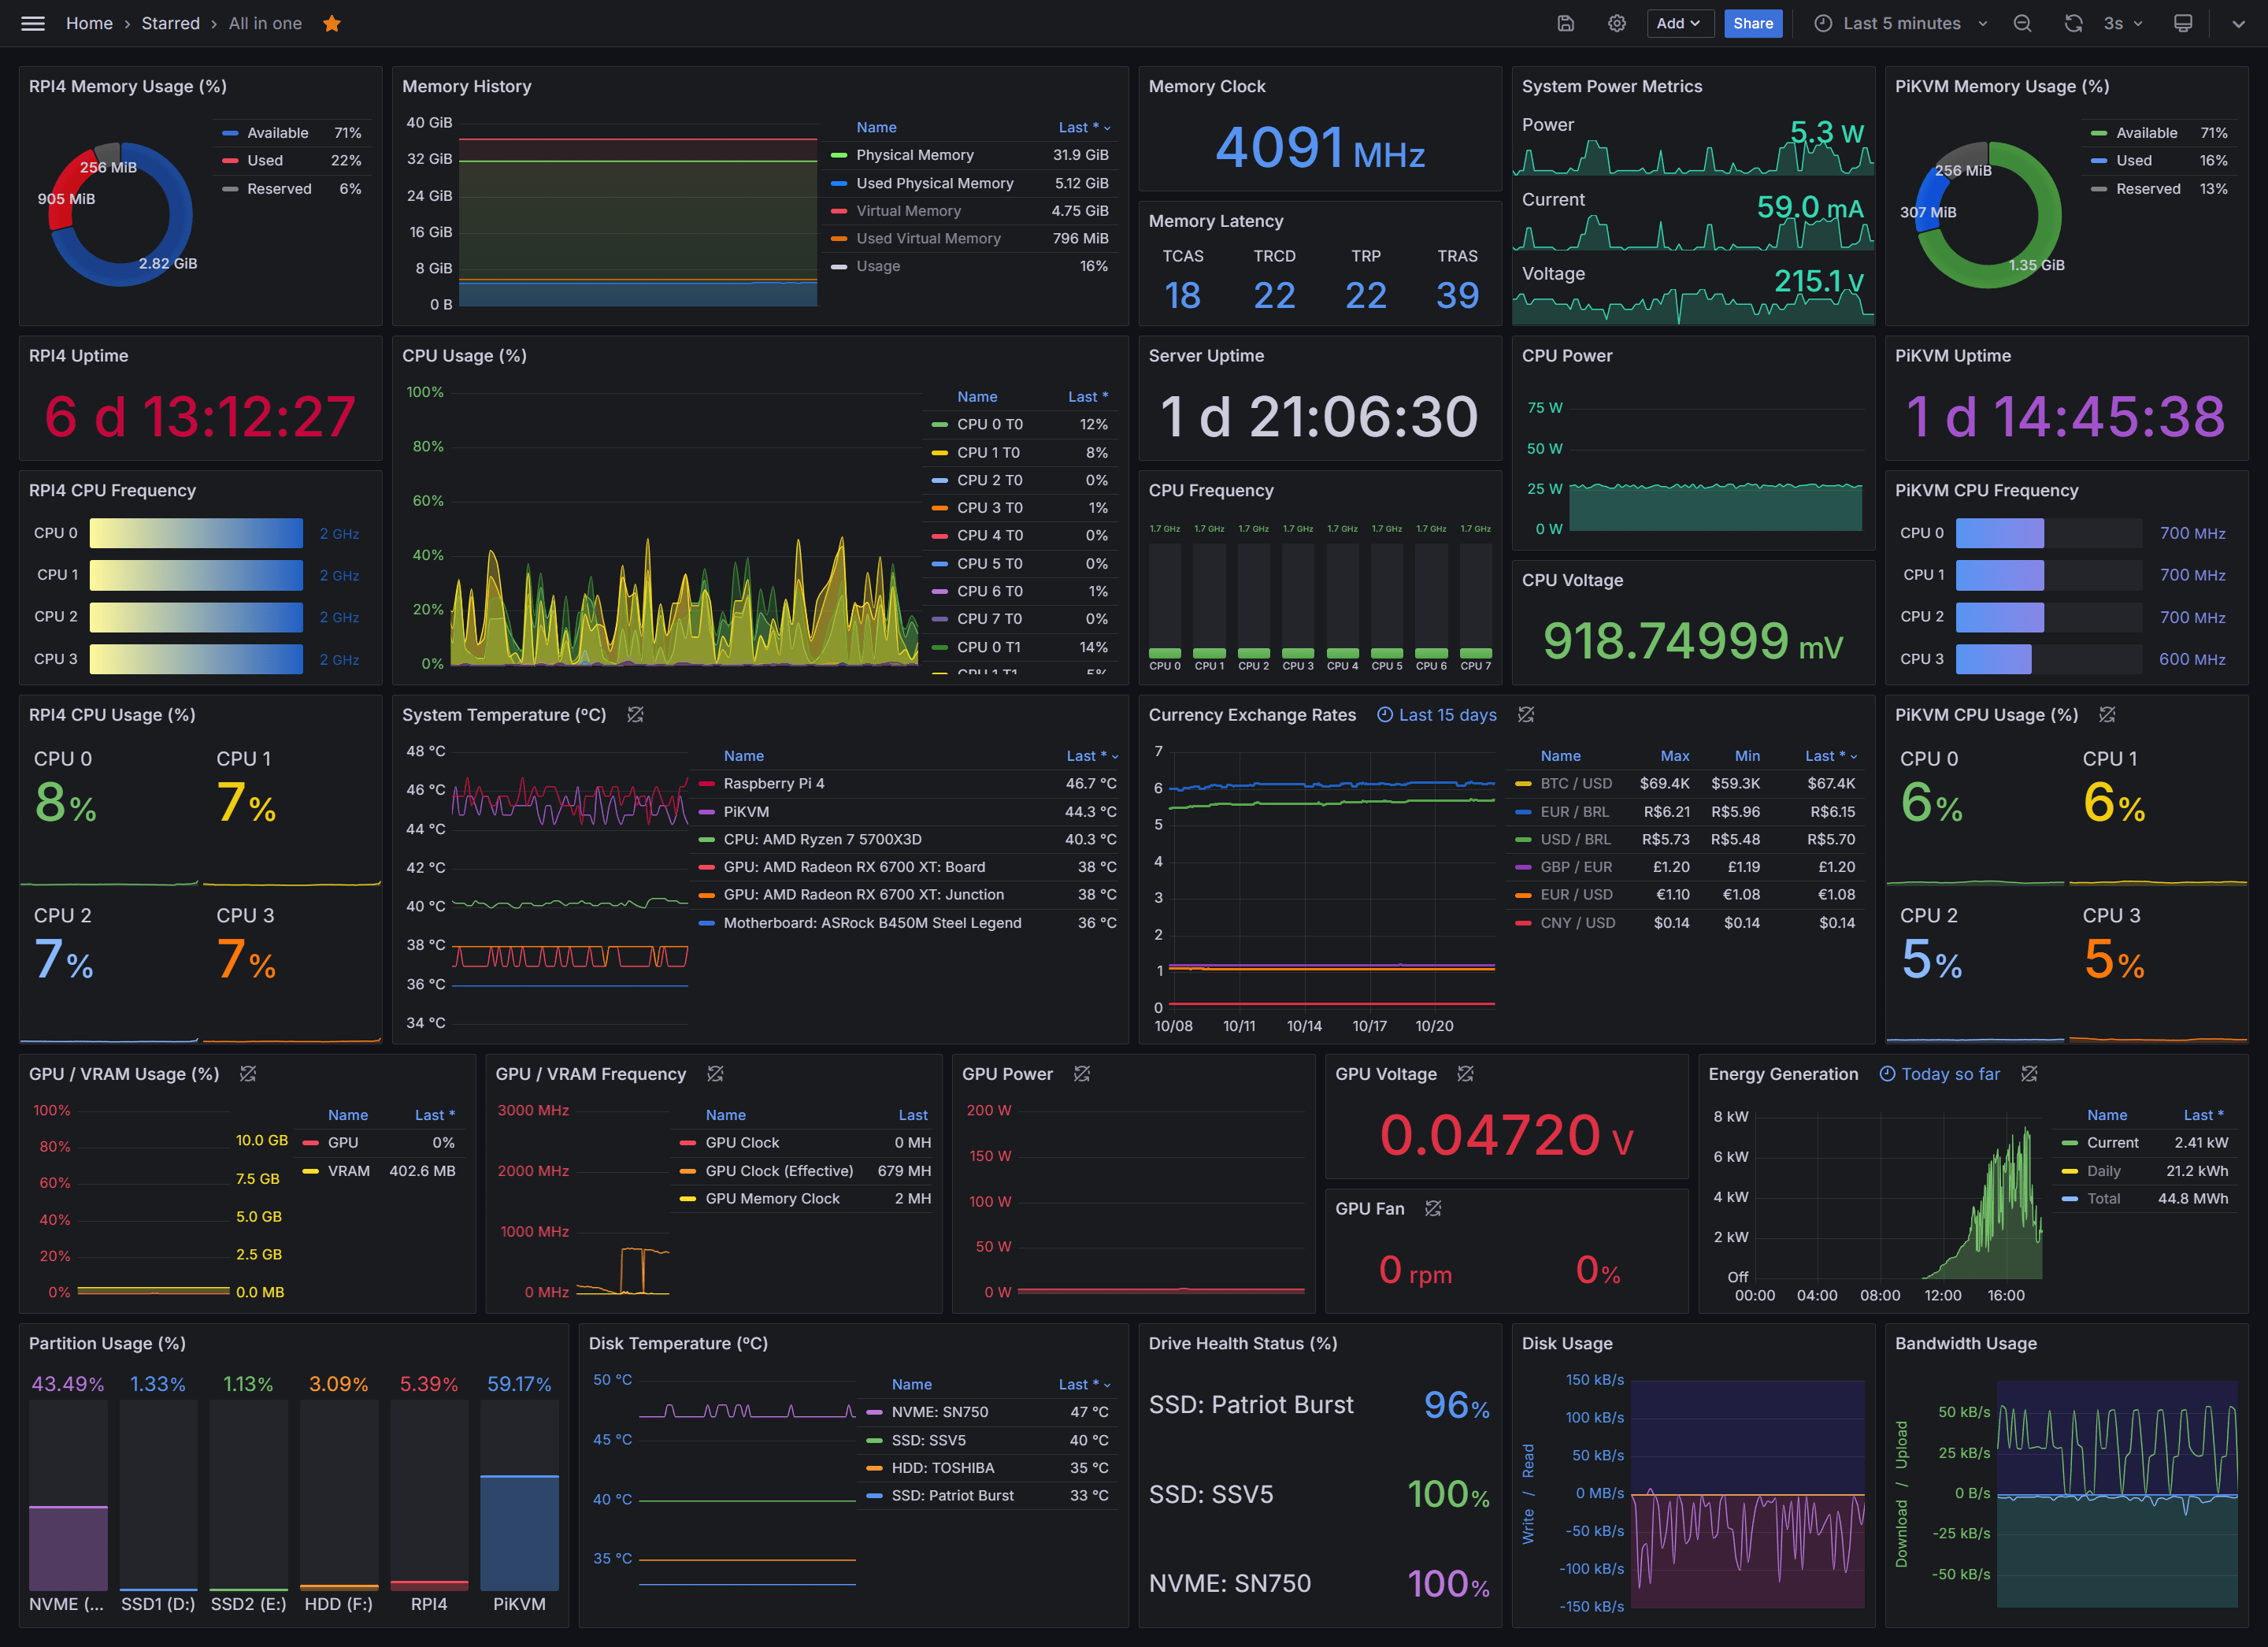
Grafana runs Loki for logs, Mimir for metrics, Tempo for traces, and Pyroscope for profiling, all under Apache 2.0. The same stack that runs on Grafana Cloud runs on your own hardware at zero license cost, which is the strongest exit guarantee on this list. Most teams already know the dashboards.
Self-hosting with Grafana is a platform engineering commitment, not a deployment decision. You are operating three backends with independent scaling characteristics and owning the uptime of your own monitoring. On Cloud, cardinality drift moves the bill month to month, and the adaptive telemetry features that control it sit behind the Enterprise commit.
Pricing: Free is $0 permanently with 14-day retention across all signals and community support. Pro starts at $19 per month plus usage with volume discounts, adding 8x5 email support and lifting retention to 13 months for metrics and 30 days for the rest. Enterprise starts at a $25,000 per year spend commit and adds premium support, custom retention, and Federal Cloud or Bring Your Own Cloud deployment.
Best fit: Teams that want the option to walk away with their dashboards intact. Take the Cloud tier if you want that option without exercising it yet.
7. Elastic Observability
- Deployment: Serverless, Cloud Hosted, self-managed
- Pricing: From $0.07/GB ingested
- OpenTelemetry: Elastic Distributions of OpenTelemetry
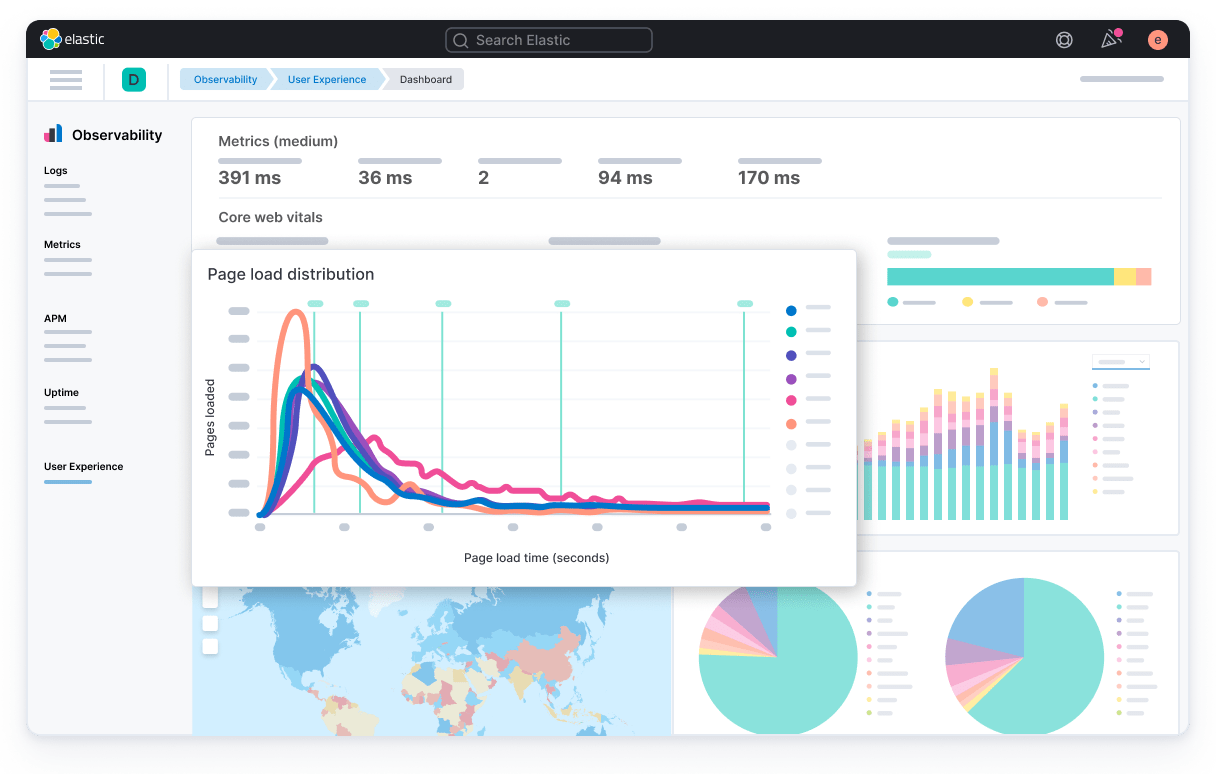
Elastic Observability runs on Elasticsearch, which makes ad hoc log search its strongest workflow. Three deployment paths cover most residency requirements, and self-managed carries no license fee, so it answers the constraint New Relic's SaaS-only architecture cannot.
One billing detail matters more than the headline rate: Elastic meters uncompressed data measured at the end of the ingest pipeline, before compression. Billed volume will run higher than both your raw source data and the resulting index, so estimates built from either will come in low. Self-managed clusters also need someone on staff who understands shard management.
Pricing: Serverless Logs Essentials is $0.07 per GB ingested plus $0.017 per GB retained monthly, and Complete is $0.09 and $0.019. Egress is free to 50 GB. Cloud Hosted baselines run $99 for Standard, $114 for Gold, $131 for Platinum, and $184 for Enterprise on a 120 GB two-zone configuration, scaling with provisioned RAM and storage.
Best fit: Search-heavy log workloads where residency rules out SaaS. Without Elasticsearch operators on staff, the managed tiers are the realistic option.
8. Sentry
- Deployment: SaaS, self-hosted
- Pricing: Free, then from $26/month
- OpenTelemetry: Supported through the Sentry SDKs
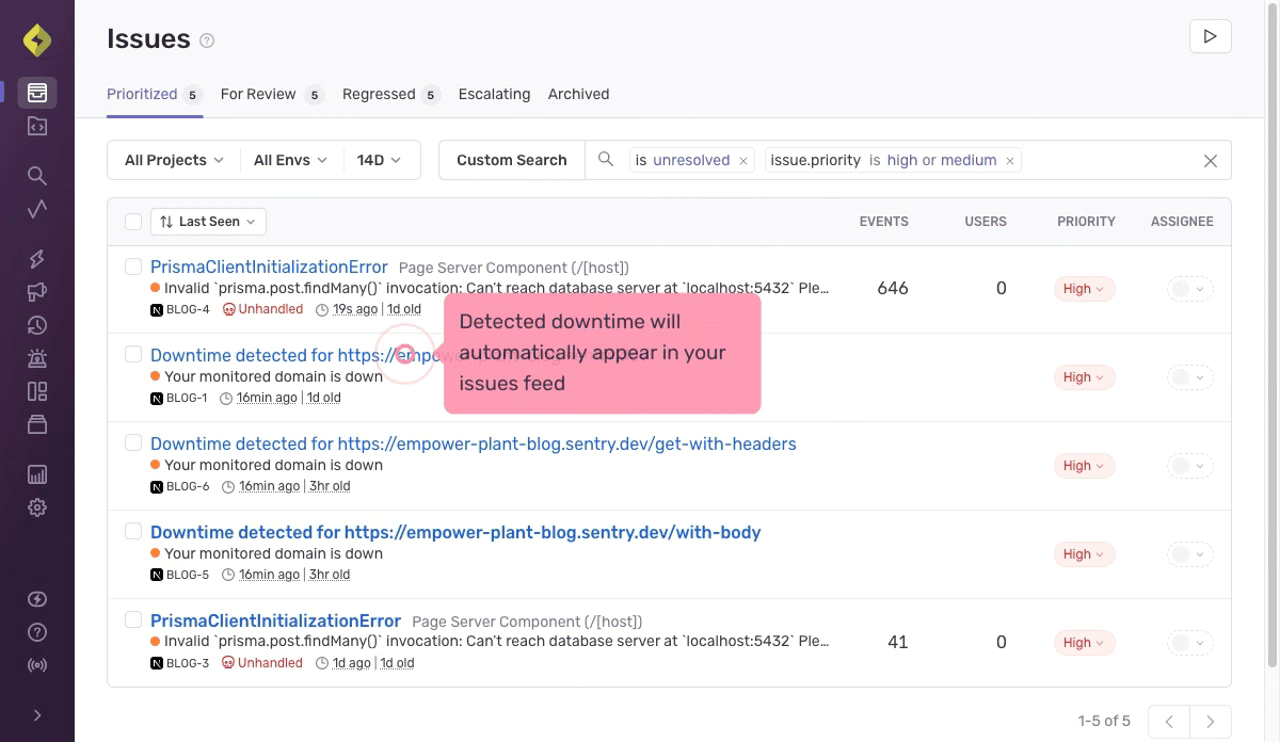
Sentry captures exceptions with stack traces and breadcrumbs, groups them into issues, and ties them to the release and commit that introduced them. If the question you actually ask New Relic every week is which deploy broke checkout, Sentry answers it faster and for a fraction of the price.
Though, Sentry is not a full replacement and does not try to be. It doesn't offer infrastructure monitoring or host metrics, and its tracing covers transaction performance rather than a correlated view across services, logs, and metrics. Teams running distributed systems generally pair it with something broader rather than swapping New Relic out for it.
Pricing: Developer is free with 5,000 errors and one user. Team is $26 per month billed annually and includes 50,000 errors with unlimited users. Business is $80 and adds SSO, custom dashboards, and 90-day data insights against Team's 7. Volume above quota bills on demand, and Business overage rates run higher than Team.
Best fit: Application and frontend teams whose infrastructure monitoring is already handled elsewhere. As a partial swap it can cut a New Relic bill meaningfully without losing the workflow that mattered.
9. Zabbix
- Deployment: Self-hosted, Zabbix Cloud
- Pricing: Free software, support from €245/month
- License: AGPLv3 from version 7.0
Zabbix monitors hosts, networks, services, and cloud resources through agents, SNMP, IPMI, JMX, and HTTP checks, and ships as one edition with every feature included. No license fee, no per-host charge, and data lands in your own database on your own infrastructure.
With Zabbix, budget for the setup rather than the software. Templates and tuning are administrator work, and teams arriving from a hosted product feel the learning curve. Zabbix is also built around metrics, checks, and triggers rather than traces, so it will tell you a service is unhealthy without telling you which request path made it slow.
Pricing: The software is free. Support runs Silver at €245 per month billed annually with 8x5 and 1-day response, Gold from €660 with 4-hour response, and Platinum, Enterprise, and Global on custom quotes with 24x7 coverage down to 1-hour response. Zabbix Cloud prices by New Values Per Second, from $50 per month at 50 NVPS to $5,000 at 10,000 NVPS.
Best fit: Infrastructure teams with sysadmin capacity that need full data ownership. Pair it with something that covers the application layer rather than asking it to cover both.
10. Nagios
- Deployment: Self-hosted
- Pricing: Core free, XI from around $1,995
- License: GPL for Nagios Core
Nagios Core polls hosts and services, evaluates state, and alerts, with a plugin ecosystem covering nearly anything checkable from a shell. It is free under the GPL with no node limit, and a large share of on-premises monitoring still runs on it. Nagios XI adds a web interface, configuration wizards, and vendor support on the same engine.
Nagios' architecture predates cloud-native infrastructure and it shows. Nagios is state-based rather than telemetry-based, with no distributed tracing, no code-level visibility, and no native handling of ephemeral or auto-scaling workloads. Configuration on Core is file-based and labor-intensive.
Pricing: Core is free. Nagios XI licenses are perpetual and priced by monitored node count, with Standard starting around $1,995 for a node-limited license and Enterprise running higher for unlimited-node deployments. Nagios does not publish full list pricing, so anything past a small deployment means a sales conversation and reseller quotes are the practical reference.
Best fit: Stable, long-lived infrastructure on owned hardware where a perpetual license beats a subscription. If you are moving off New Relic for application visibility, this is not the tool that replaces it.
Add the layer your APM tool can't see
Any tool on this list will monitor your services. None of them show you the prompt, the tool call, and the token cost behind an agent run. Respan does, on the same platform that routes the traffic. Free to start, no credit card.
Frequently Asked Questions
Is New Relic an Observability Platform or an APM Tool?
Both, and the distinction is starting to matter again. New Relic began as APM and expanded into a full observability platform covering metrics, logs, traces, infrastructure, and digital experience monitoring, all in one data store. That is genuine observability for services and hosts.
The gap opens on AI workloads. APM tools instrument the code path, and an agent's failure modes live outside it: a prompt version that regressed, a tool call that looped, a model that returned a confident wrong answer at normal latency with a 200 status. Respan covers that layer with full trace trees over prompts and tool calls, evaluators scoring production traffic in real time, and token cost attributed by user and workflow, on the same platform that routes the calls. Teams running both conventional services and LLM features generally need both kinds of visibility.
Datadog vs New Relic: Which Should You Choose?
Datadog is stronger on infrastructure and integration breadth, with over 1,000 integrations and an infrastructure-first interface that suits Kubernetes and microservices work. New Relic is stronger on cost predictability for large teams, because unlimited hosts and containers are included and only data and seats meter.
The decision usually comes down to which dimension is growing faster. If headcount is growing and host count is stable, Datadog's per-host model at $15 to $23 for infrastructure plus $31 for APM costs less than New Relic's $349 Pro seats. If host count is exploding in an auto-scaling cluster and the team is small, New Relic's model wins, because Datadog's high-water mark billing charges the month at your peak node count.
Who Are New Relic's Main Competitors?
Respan competes for the observability workload that New Relic's APM model does not reach, covering LLM and agent traffic with tracing, evaluations, cost attribution, and a gateway in one platform. Datadog is the closest direct competitor on feature overlap and market position, with both bundling APM, logs, infrastructure, and RUM in one SaaS product. Dynatrace competes on automated root cause in enterprise estates, and Splunk Observability Cloud competes where security and observability consolidate.
Beyond the direct set, Honeycomb competes on high-cardinality tracing with no seat fees, Grafana and Elastic compete on open-source foundations and deployment flexibility, and Sentry competes for the error-tracking slice. Zabbix and Nagios compete at the infrastructure layer on license cost.
What Are the Best Alternatives to New Relic?
Start with what you are replacing. Teams running LLM applications and agents alongside conventional services should look at Respan first, since it covers prompt-level tracing, output quality scoring, token cost attribution, and gateway routing that APM tools do not reach, with a free tier that includes unlimited seats and a $199 per month Team plan.
For a like-for-like APM and infrastructure replacement, Datadog and Dynatrace cover the widest surface, with Splunk Observability Cloud fitting security-forward estates. Honeycomb answers the seat-cost problem directly with unlimited seats on every plan. Grafana and Elastic suit teams that want self-hosting or open data formats. Zabbix and Nagios cover infrastructure monitoring at zero license cost for teams with the operational capacity to run them.
Splunk vs New Relic: How Do They Compare?
Splunk Observability Cloud prices per host and per component, starting at $15 per host per month for Infrastructure, $60 for App & Infrastructure, and $75 for End-to-End. New Relic prices by ingest and seats. For a small team on many hosts, New Relic is cheaper. For a large team on few hosts, Splunk is.
The real differentiator is what sits next to it. Splunk's strength is log search at scale through SPL and the adjacency to Splunk Enterprise Security, so observability and SIEM investigations share a platform. New Relic's is a single correlated data store with logs in context of the trace that produced them. Neither offers self-hosting for these products.
New Relic vs Dynatrace: Which Is Better for APM?
Dynatrace goes deeper on automated APM. OneAgent instruments a host once and discovers topology on its own, and Davis traces root cause deterministically against the Smartscape dependency graph rather than asking an engineer to query their way there. For large estates where manual investigation does not scale, that automation is the product.
New Relic gives engineers more direct control over the data. NRQL queries anything in NRDB, and the workflow assumes a curious developer rather than an ops team consuming automated findings. Pricing splits along the same line: Dynatrace charges nothing per user and $58 per month for an 8 GiB Full-Stack host, while New Relic charges $349 per Pro seat and nothing per host. Dynatrace also offers managed and self-hosted deployment, which New Relic does not.
New Relic vs Honeycomb: What's the Difference?
Honeycomb stores wide events and derives logs, metrics, and traces from them. New Relic stores each signal and correlates them. In practice that means Honeycomb can filter on any field in an event without prior indexing decisions, which is what makes high-cardinality debugging fast, while New Relic gives broader out-of-the-box coverage across infrastructure, synthetics, browser, and mobile.
Seats are the sharpest contrast. Honeycomb includes unlimited seats and unlimited querying on every plan including Free, and bills on event volume from $150 per month for 50M events on Pro. New Relic charges $349 per Pro full platform user. A ten-engineer team pays Honeycomb nothing extra for access and pays New Relic $3,490 per month before any data charges.
New Relic vs Zabbix: Which Fits Your Stack?
Zabbix is free, self-hosted, and built around checks, metrics, and triggers for infrastructure and network devices. New Relic is SaaS, priced on ingest and seats, and built around application telemetry with distributed tracing. They answer different questions: Zabbix tells you a host or service is unhealthy, New Relic tells you which code path made a request slow.
Choose Zabbix when data residency is non-negotiable, license cost has to be zero, and the team has sysadmin capacity to run and template it. Choose New Relic when application-level visibility is the requirement and nobody wants to operate the monitoring stack. Teams running both AI features and conventional infrastructure often end up with an infrastructure tool plus a platform that covers application and LLM traffic, rather than stretching either one across both.
Nagios vs New Relic: How Do They Differ?
Nagios Core polls hosts and services, evaluates state, and alerts, all on your own hardware under a GPL license with no node limit. Nagios XI adds a web interface, configuration wizards, and support on a perpetual node-based license starting around $1,995. New Relic collects continuous telemetry into a hosted store and lets you query it after the fact.
The architectural gap matters more than the price gap. Nagios is state-based and predates cloud-native infrastructure, so it has no distributed tracing, no code-level visibility, and no native handling of ephemeral or auto-scaling workloads. It remains a reasonable fit for stable infrastructure on owned hardware. It is not a replacement for New Relic's APM, and teams that need both typically run Nagios underneath something that covers the application layer.