
A request to your AI feature passes through an API gateway, an auth service, a planner, two tool calls, and a model call. It comes back in 900 milliseconds with a 200 status, and every service reports healthy. The answer the user got was still wrong.
Distributed tracing follows a single request across every service it touches and records how long each step took and whether it failed. When a microservice is slow or throwing errors, that record usually points straight at it.
A model call is different, because it can finish on time with no error and still produce the wrong answer. Timing and status look normal on that span, so they can't tell you what went wrong. To find the cause, the trace also needs the prompt, what the tools returned, what the call cost, and whether the output was any good.
Recording that detail is what the best distributed tracing tools for LLMs need to do on top of the basics.
What is distributed tracing?
Distributed tracing records the path a single request takes through a distributed system, across every service, database query, message queue, and external API it touches. Each operation becomes a span, and spans that share a trace ID assemble into one trace showing which operations ran and how long each one took.
In a monolith, a stack trace or a single log file usually covers a whole request. Once that request is split across services, each service logs only its own slice, often on a different host and owned by a different team. The trace ID connects those slices, because it's generated when the request first enters an instrumented service and passed along to every service after it.
A span carries a name, start and end timestamps, a status, a reference to its parent span, and attributes describing what happened. The first span in a request is the root, and every downstream call nests under it as a child, which is how a stream of separate records turns into a tree. Agents follow the same structure, with each model call, tool run, retrieval, and handoff recorded as its own span, and that application of the idea to AI systems is what LLM tracing covers.
How does distributed tracing work?
A trace starts the moment a request reaches the first instrumented service. That service creates a trace ID and a root span, passes the trace context along with every outbound call, and each downstream service adds child spans until the response goes back out. Separately from the request itself, every service ships its finished spans to a backend, which reassembles them by trace ID.
Instrumentation
Instrumentation is the code that creates spans. Automatic instrumentation from OpenTelemetry wraps common HTTP servers and clients, database drivers, and messaging clients, so spans appear without changes to application code. Manual instrumentation fills in what those libraries can't see, such as a pricing calculation or a retry loop you want to show up as its own step.
For LLM calls, instrumentation that follows the OpenTelemetry GenAI semantic conventions records the model, the provider, and input and output token counts on each span, and can capture prompt and completion content when you opt in. That opt-in deserves a deliberate decision, since the content is usually what you need when an output is wrong, and it's also the part likely to contain user data.
Context propagation
A span only joins the right trace if its service knows the trace ID and the ID of the span that called it, so that information travels with the request. Over HTTP and gRPC, the W3C Trace Context standard carries it in a traceparent header containing a version, a 32-hex-character trace ID, a 16-hex-character parent span ID, and flags that include the sampling decision.
Synchronous calls get this largely for free once instrumentation is in place. Asynchronous hops are where traces tend to break. A message published to Kafka or SQS needs the trace context injected into its headers, and the consumer needs to extract it, or the work on the other side shows up as a separate trace with no link to the request that caused it.
Collection and export
Instrumented services don't send each span the moment it ends. The SDK batches finished spans and exports them over OTLP, OpenTelemetry's wire protocol, either straight to a backend or to an OpenTelemetry Collector running as a sidecar, a DaemonSet, or a standalone service.
The Collector is where pipeline decisions usually live. It can batch and retry exports, drop or redact attributes before data leaves your network, apply sampling, and send the same stream of spans to more than one backend. Because of that last capability, service spans and LLM spans can go to different tools from the same pipeline.
Sampling
High-traffic systems produce more spans than anyone wants to store, so sampling decides which traces to keep. Head-based sampling makes that decision at the root span, and the decision propagates in the trace context so every service agrees. It's cheap and simple, but it's made before anything interesting has happened, so a rare error can be discarded along with the routine traffic around it.
Tail-based sampling waits until a trace finishes and keeps it based on what it contains, such as an error status or a duration above a threshold. What you give up is memory and complexity, since a Collector has to buffer complete traces before deciding.
For LLM workloads, keep in mind that a wrong answer can carry an OK status and a normal duration, so tail rules built only on errors and latency may drop the traces you need. Rules keyed on model or span-type attributes, or keeping every LLM span while sampling service spans, can close that gap.
Visualization
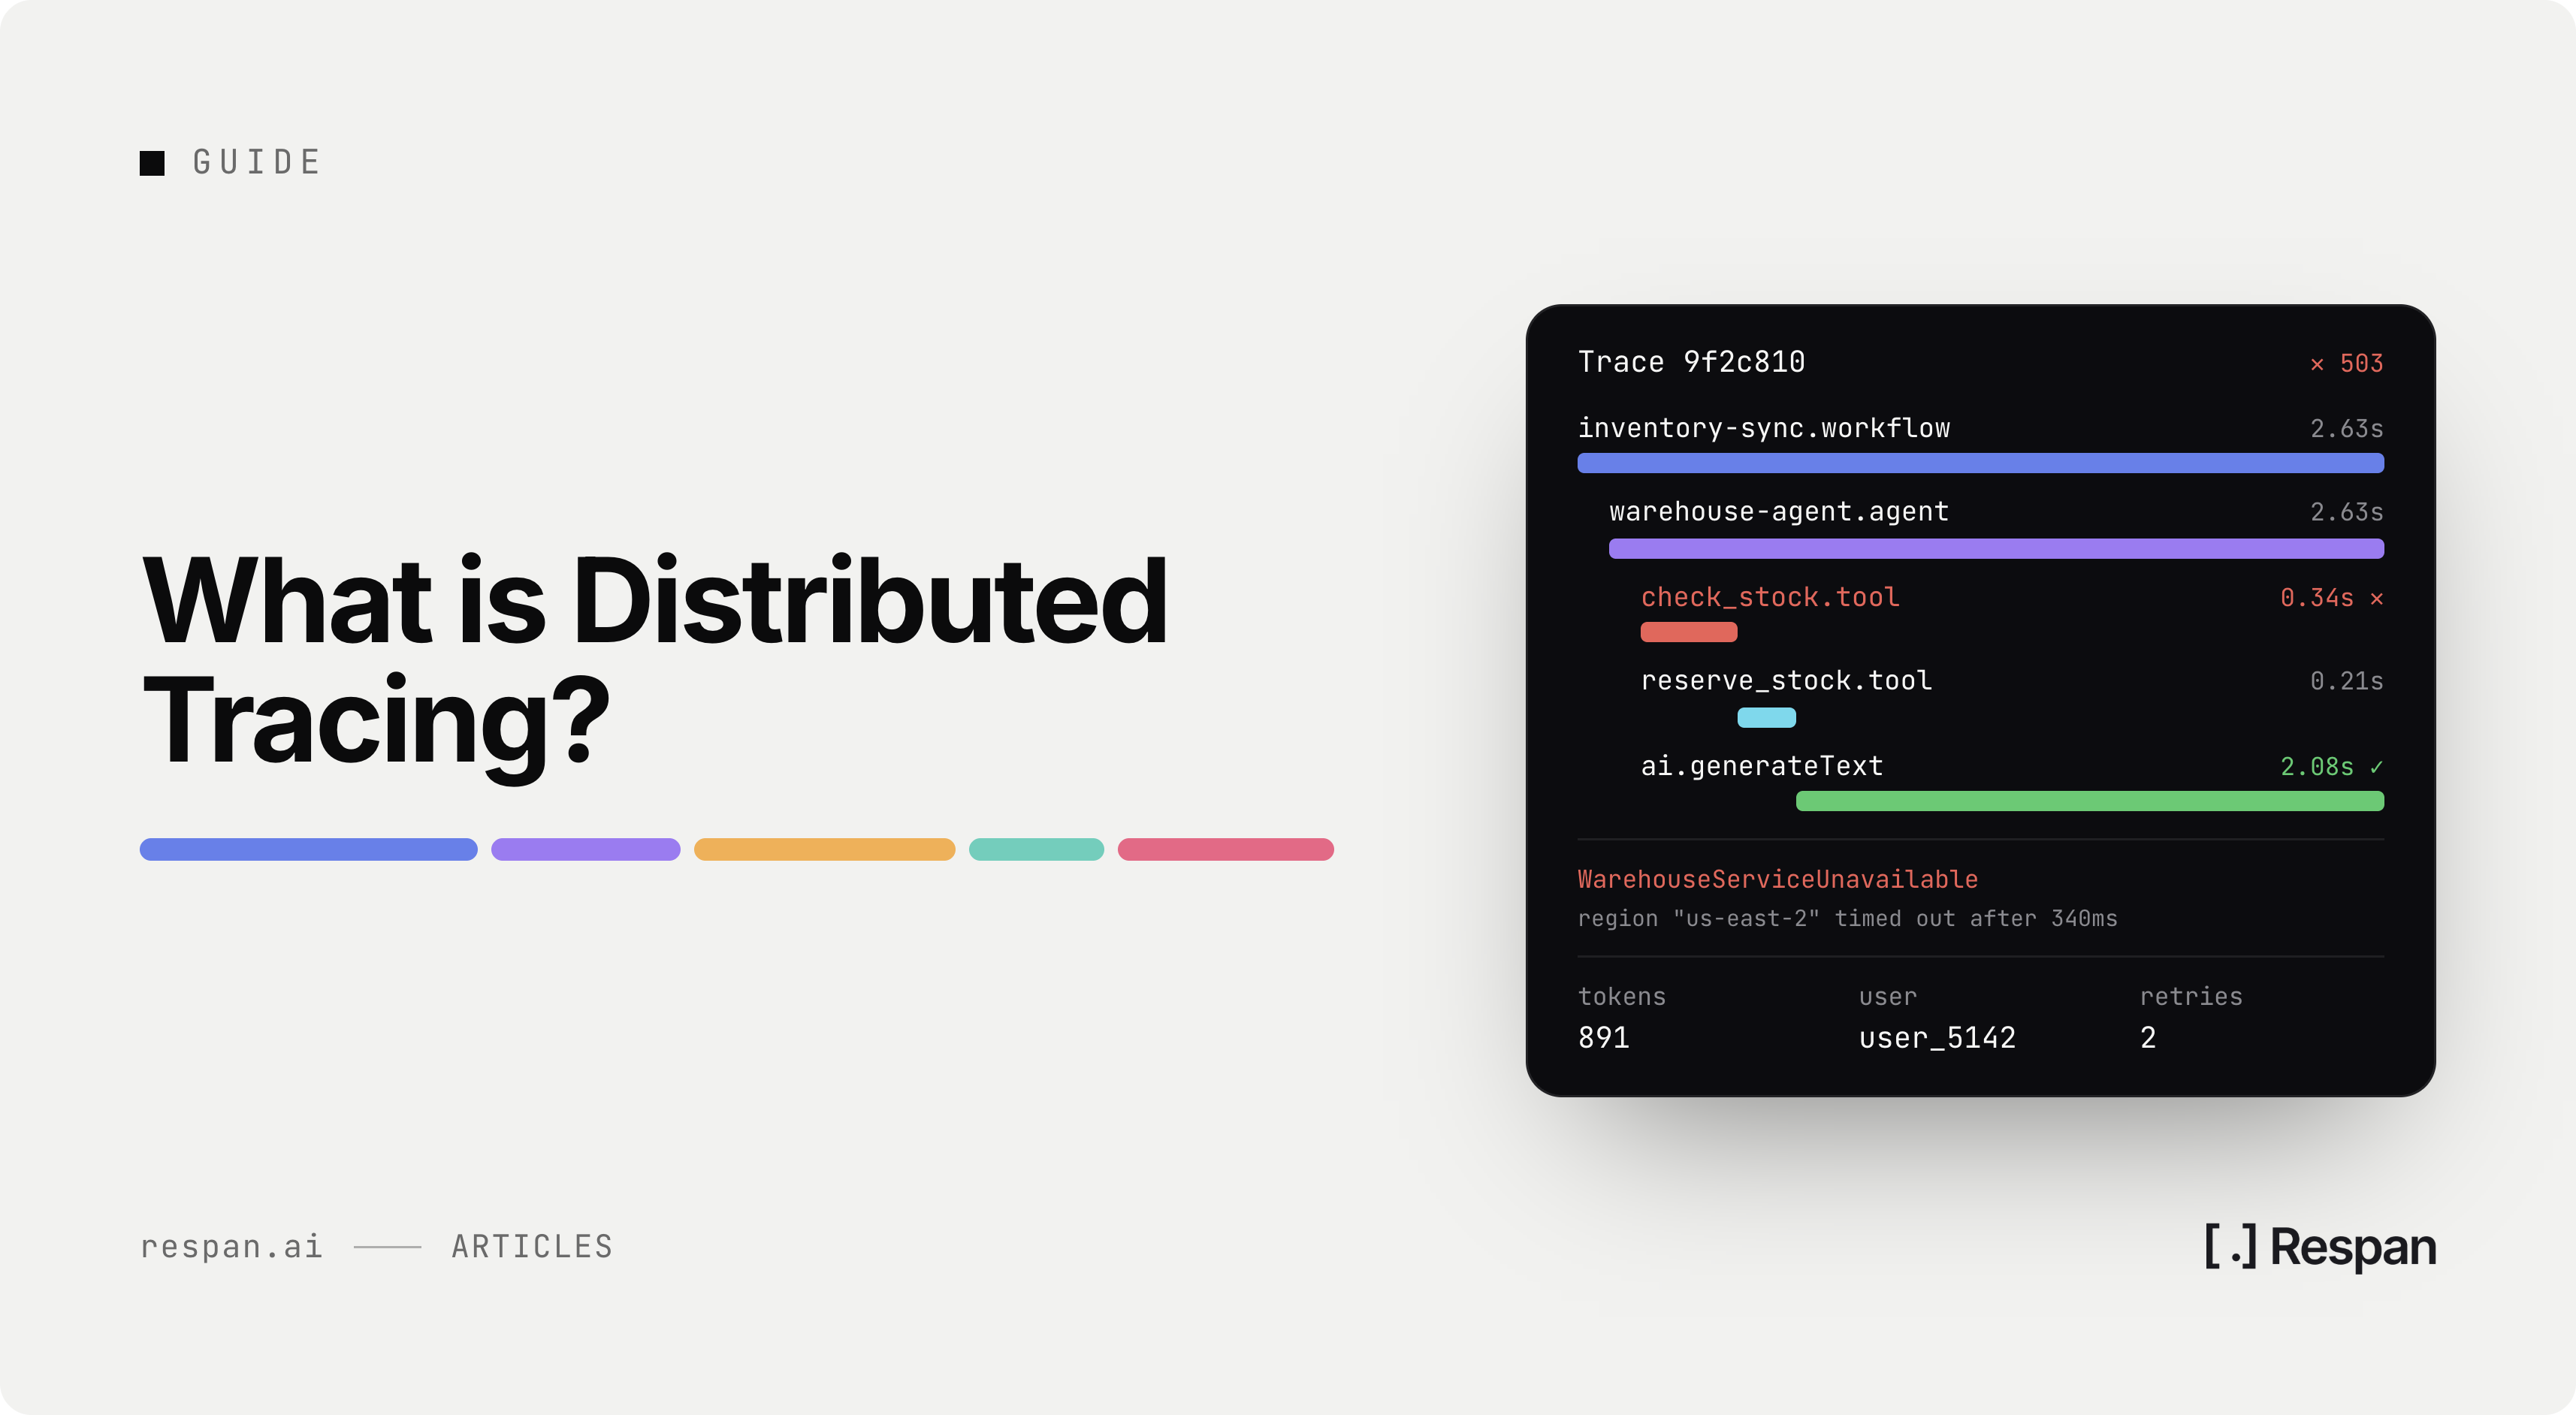
A backend draws a trace as a waterfall, with each span shown as a bar placed by start time, sized by duration, and nested under its parent. Reading it top to bottom shows where time went and which span carried the error. Many backends also aggregate spans across traces into a service dependency map that shows which services call which.
For LLM spans, the step that caused a bad answer often looks unremarkable on timing. The view that helps puts the model, input, output, and token cost next to the duration, which is what makes it possible to debug an agent from the trace rather than from a reproduction attempt.
Is distributed tracing worth it?
When distributed tracing pays off
Tracing has real costs. Instrumentation takes engineering time, especially where context has to be propagated by hand through queues and background jobs. Span storage also grows with traffic and with how many spans each request produces, and a Collector pipeline is one more system to run and upgrade.
Those costs are easiest to justify once a single request crosses enough boundaries that logs can't reconstruct it. If an incident regularly involves several teams comparing timestamps across services, or a latency regression could come from any of a dozen downstream calls, a trace shows in one view what would otherwise take manual correlation across log files.
A monolith with one database and a handful of external calls may get much of that value from structured logs and metrics alone, since there's only one place a failure could come from. That gap between spotting a failure and tracing its cause is the practical line in observability vs monitoring, and it widens with every service a request crosses.
What a trace needs to carry for LLM calls
For LLM applications the calculation changes, because every step an agent takes is a boundary. A planner call, a retrieval, a tool call, and a final model call are separate operations with separate failure modes, and an agent can loop through them several times in one request. The cost side stays the same, while the question shifts from whether to trace to what each span has to carry.
A classic span records duration and status. For an LLM step, both of those can look normal while the output is wrong, so the span needs enough context to explain the result:
- Model and parameters - The model that actually served the request, which can differ from the one requested if a fallback fired, plus settings like temperature and max tokens.
- Rendered prompt and version - The final prompt after templating and the prompt version it came from, so a regression maps to a specific change.
- Tool calls and results - The arguments the model generated and what the tool returned, since a malformed argument can fail without raising an exception.
- Retrieved context - The documents or chunks passed to the model, which is where a wrong answer can start in a retrieval step.
- Tokens and cost - Input and output token counts and the resulting cost, attributed to the customer or feature that triggered the call.
- Output and score - The response itself, plus an evaluation score that says whether it was acceptable.
The score changes what a trace is for. Without it, a trace can reconstruct what an agent did but not whether the result was any good, which leaves someone reading outputs by hand after a user complains. Carrying all of this also affects the practical side of tracing, since prompts and outputs make LLM spans larger than typical service spans and more likely to contain data that needs redacting before export.
5 best distributed tracing tools for LLMs
Jaeger and Zipkin are open-source tracing backends that you operate yourself. Datadog and Dynatrace are full-stack APM platforms, and each one handles LLM tracing in a separate AI product. Respan is built around the LLM call itself and accepts OTLP from the same instrumentation the others use.
| Tool | Type | OTLP ingest | LLM-aware views | Evals on spans | Starting price |
|---|---|---|---|---|---|
| 1. Respan | LLM engineering platform | Native | Yes | Yes | Free, then $199/mo |
| 2. Jaeger | Open-source tracing backend | Native (v2) | No | No | Free, self-hosted |
| 3. Dynatrace | Full-stack APM | Native | AI Observability app | Via dt-evals | $58/mo per 8 GiB host |
| 4. Datadog | Full-stack APM | Native | Agent Observability | Via external API | APM from $31/host |
| 5. Zipkin | Open-source tracing backend | Contrib module or Collector | No | No | Free, self-hosted |
Respan
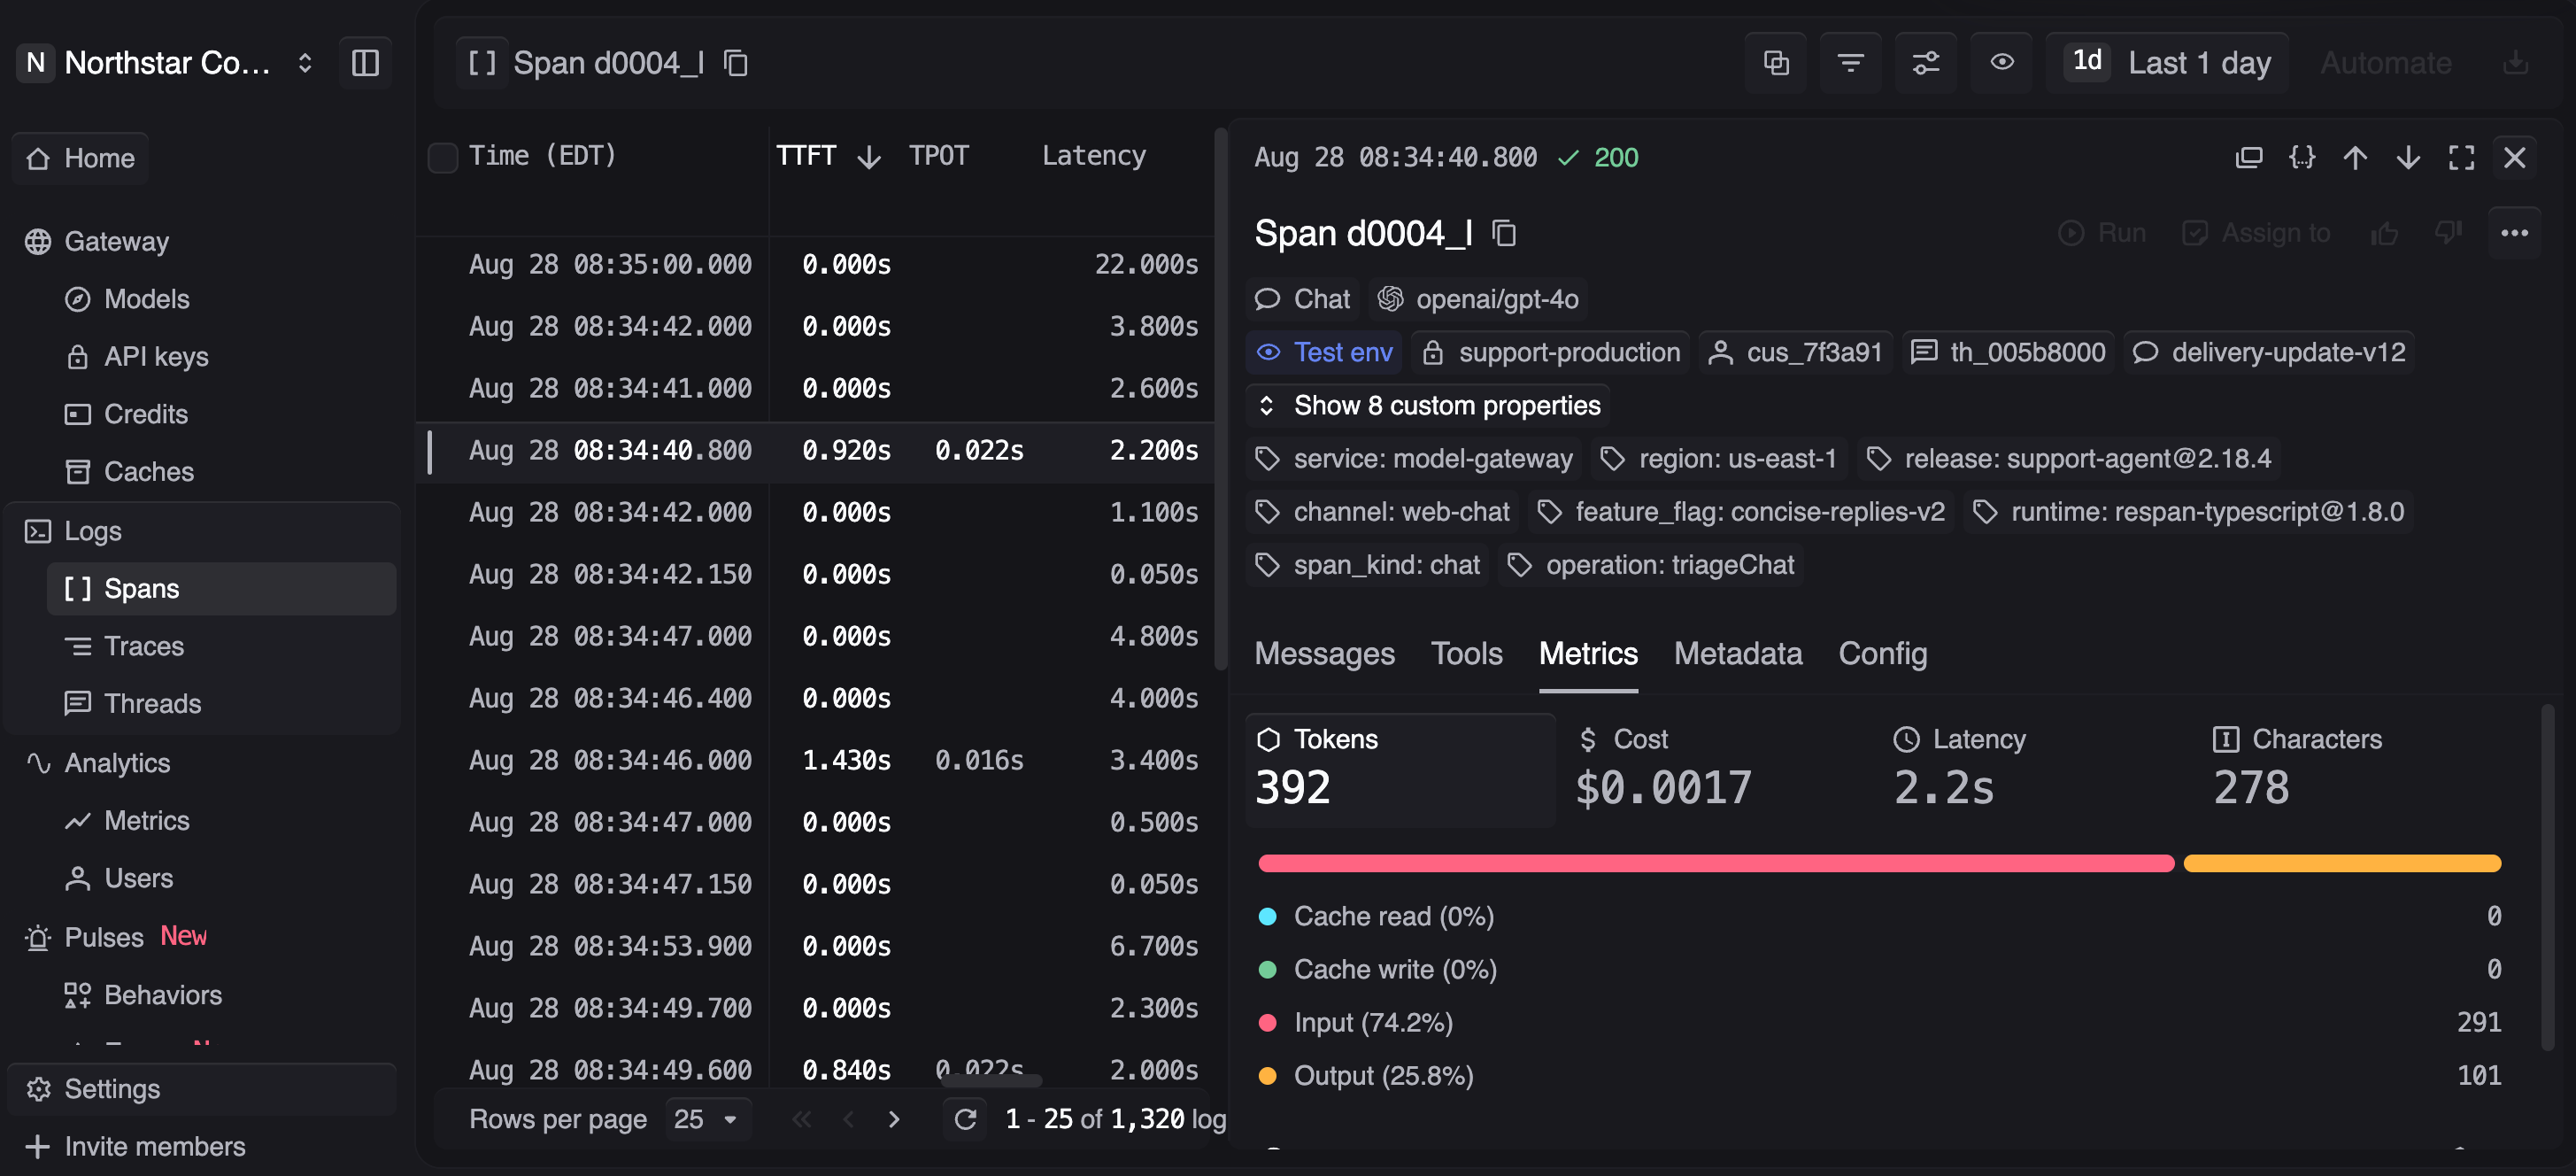
Respan records every LLM call, tool run, retrieval, and agent turn as a span in one trace, with input, output, latency, and cost attached to each. It accepts OTLP over HTTP in JSON or Protobuf, maps GenAI, OpenLLMetry, and OpenInference attributes automatically, and keeps every other attribute as queryable metadata. With a Collector fanning out, you can keep sending service spans to the tracing backend you already run and route the same stream to Respan for the LLM side, without re-instrumenting.
The trace is also where the fix starts. A low score on a production span can become a dataset, that dataset runs against a new prompt version or model in an experiment, and the comparison shows whether the change helped before it ships.
With Respan, you can route, observe, and evaluate every LLM call, with the gateway, tracing, evals, and prompt management sharing one record:
- Follow a conversation, not a single turn - Threads group multi-turn sessions so a bad answer on turn five traces back to context set on turn two, and customer IDs on spans break down spend, requests, and tokens per end user.
- Measure quality with scores - Evaluators combine LLM judges, deterministic code checks, and human review into one score, and online evals run them on sampled live spans filtered by customer, status, or thread.
- Know where every dollar goes - Cost breaks down by model and request, with soft and hard spend caps per key, customer, or org, and the hard cap stops spend at the ceiling.
- Stay up when a provider fails - The gateway reaches 1,000+ models through one endpoint at roughly 10ms added P95, with fallback chains you define, automatic retries, and exact-match caching.
- Ship prompt changes without redeploying - Prompts live as versioned templates outside application code, and the application picks up a new version the moment it's published.
- Hear about it before customers do - Monitors on cost, errors, latency, or tokens alert Slack, email, or a webhook the moment a threshold breaches.
- Pass the security review - SOC 2, HIPAA with a BAA, GDPR, and ISO 27001, with PII masking and log omission available.
Pricing: Free covers 100k logs, 1k scores, 7-day retention, and unlimited seats. Team is $199 per month billed yearly for 10k scores, 30-day retention, and unlimited datasets, evaluators, and prompts.
Trace past the 200
Respan records the prompt, tool calls, cost, and eval score on every LLM span, then turns a bad score into a dataset and a tested fix. Send the OTLP stream you already have and try Respan for free.
Jaeger
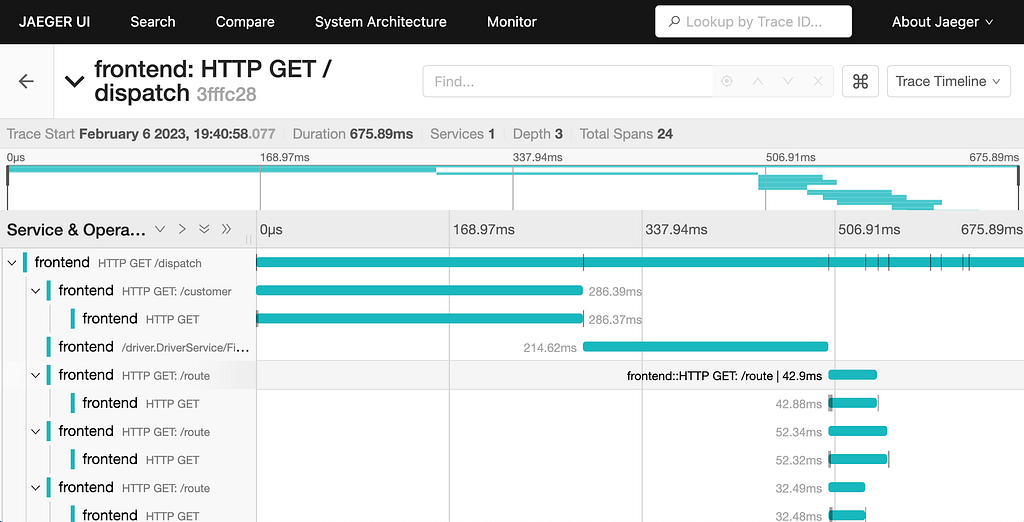
Since v2, Jaeger has run on the OpenTelemetry Collector framework, and v1 reached end-of-life on December 31, 2025. It receives OTLP natively, and the legacy Jaeger client libraries are retired in favor of OpenTelemetry SDKs.
When an LLM span arrives, Jaeger treats GenAI attributes like any other tag. Model name and token counts are searchable, and prompt content appears if your instrumentation captured it, but there's no view organized around prompts and outputs and no way to score a response inside Jaeger. If you need to know whether an output was good, that judgment has to come from a separate evaluation tool joined to Jaeger by trace ID.
LLM call coverage: GenAI attributes stored as searchable span tags, with no LLM-aware views or evaluations.
Pricing: Free and open source. The ongoing cost is the storage cluster, which grows with span volume and retention, plus the engineering time to operate it.
Dynatrace
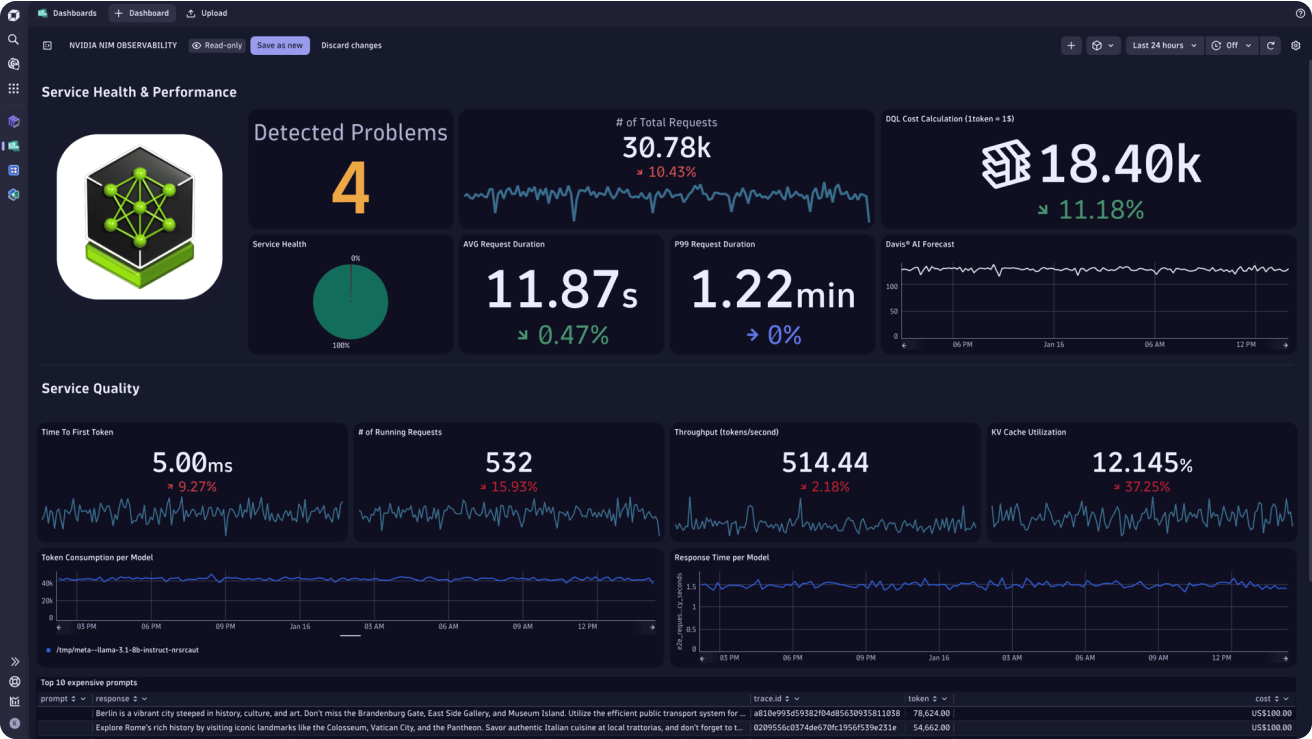
Two instrumentation paths feed Dynatrace: OneAgent, which auto-instruments hosts and the processes running on them, and OTLP ingest, which is how GenAI spans reach its AI Observability app. On the infrastructure side, it suits large estates where discovery and baselining need to happen without manual setup.
GenAI spans that follow the OpenTelemetry conventions land in the AI Observability app, which organizes them into Overview, Explorer, Prompts, and Agents topology tabs. Evaluation runs through dt-evals, an open-source CLI that attaches LLM-judge results to inference spans as gen_ai.evaluation.result events, so a quality score can sit in the same trace as the model and prompt that produced it.
LLM call coverage: GenAI spans in the AI Observability app, with LLM-judge scores attached through dt-evals.
Pricing: Full-Stack Monitoring is $58 per month for an 8 GiB host, billed per memory-GiB-hour, and traces cost $0.20 per GiB ingested with 10 days of retention included. Because traces bill on volume, LLM spans that carry full prompts and outputs can push that line up faster than service spans do.
Datadog
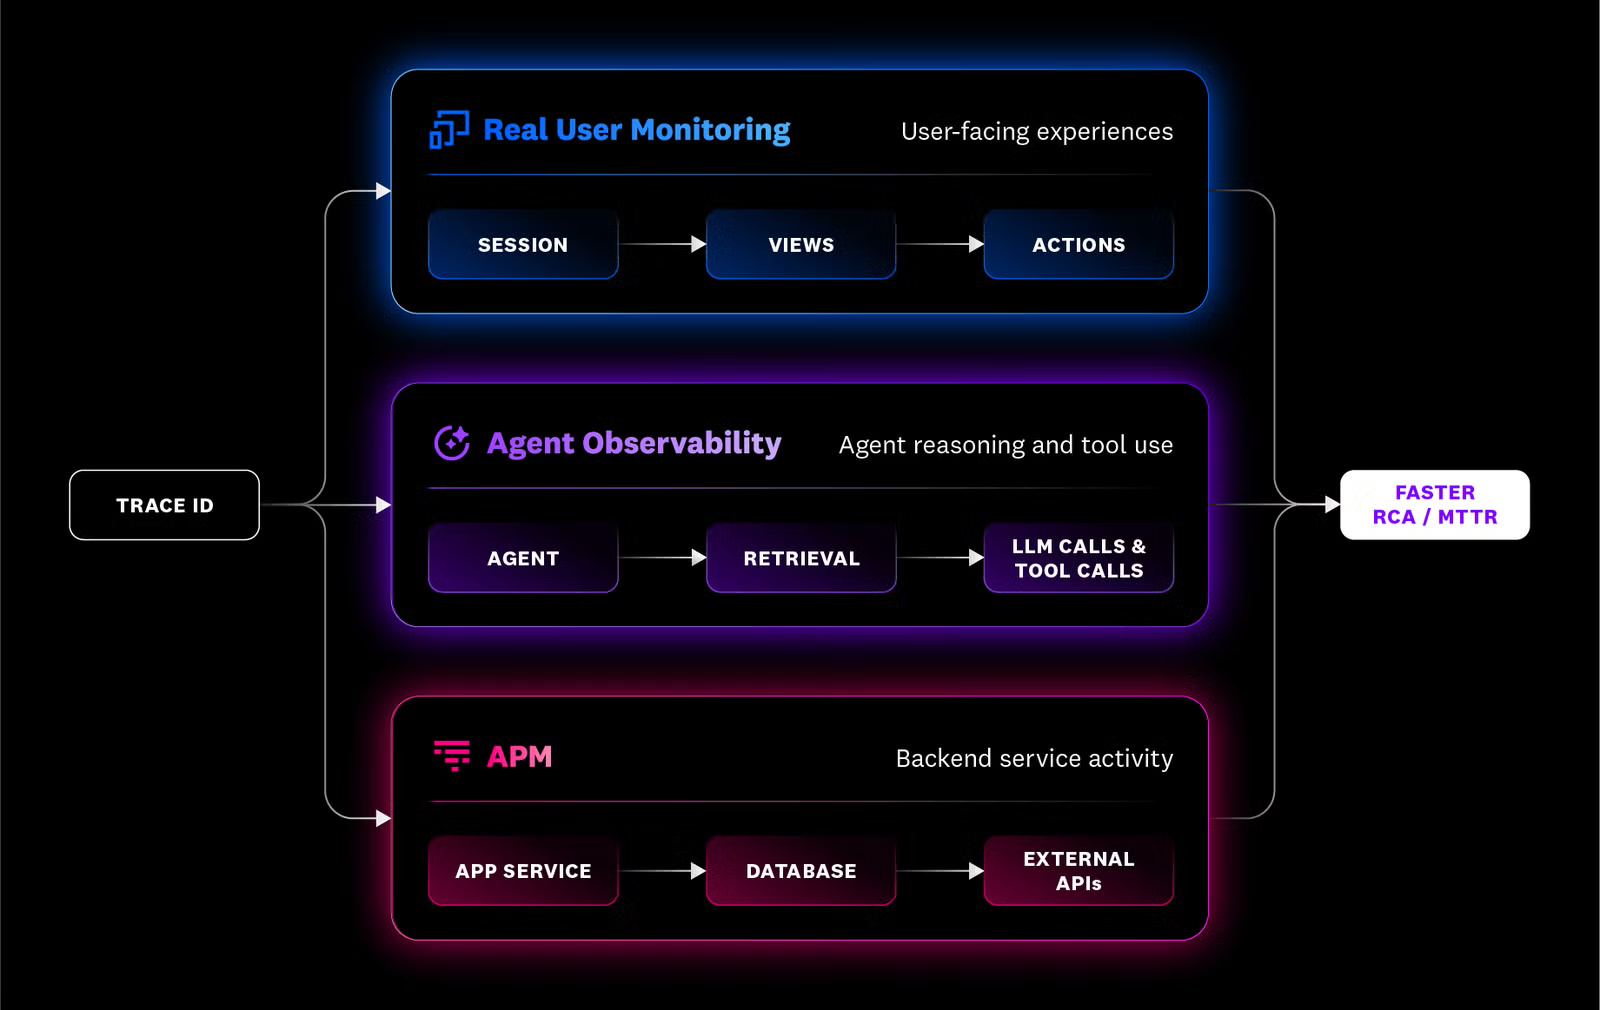
LLM calls and service requests are traced in two different Datadog products. APM handles service-level distributed tracing and correlates traces with the logs and infrastructure metrics Datadog already collects, while Agent Observability handles LLM and agent spans on its own meter.
Agent Observability accepts spans that follow the OpenTelemetry GenAI conventions from v1.37 onward, sent directly over OTLP, through the Datadog Agent, or through a Collector. Evaluations can be attached to those spans through an API, though span and trace IDs have to be converted from hexadecimal to decimal strings first, so plan for a small translation step in whatever pipeline produces your scores.
LLM call coverage: GenAI spans in a separate Agent Observability product, with evaluations attached through an API.
Pricing: APM is $31 per host per month with Infrastructure attached, or $36 standalone. Agent Observability is free up to 40,000 LLM spans per month, then $160 per month for 100,000. As a result, service tracing scales with host count while LLM tracing scales with span volume, and the two have to be forecast separately.
Zipkin
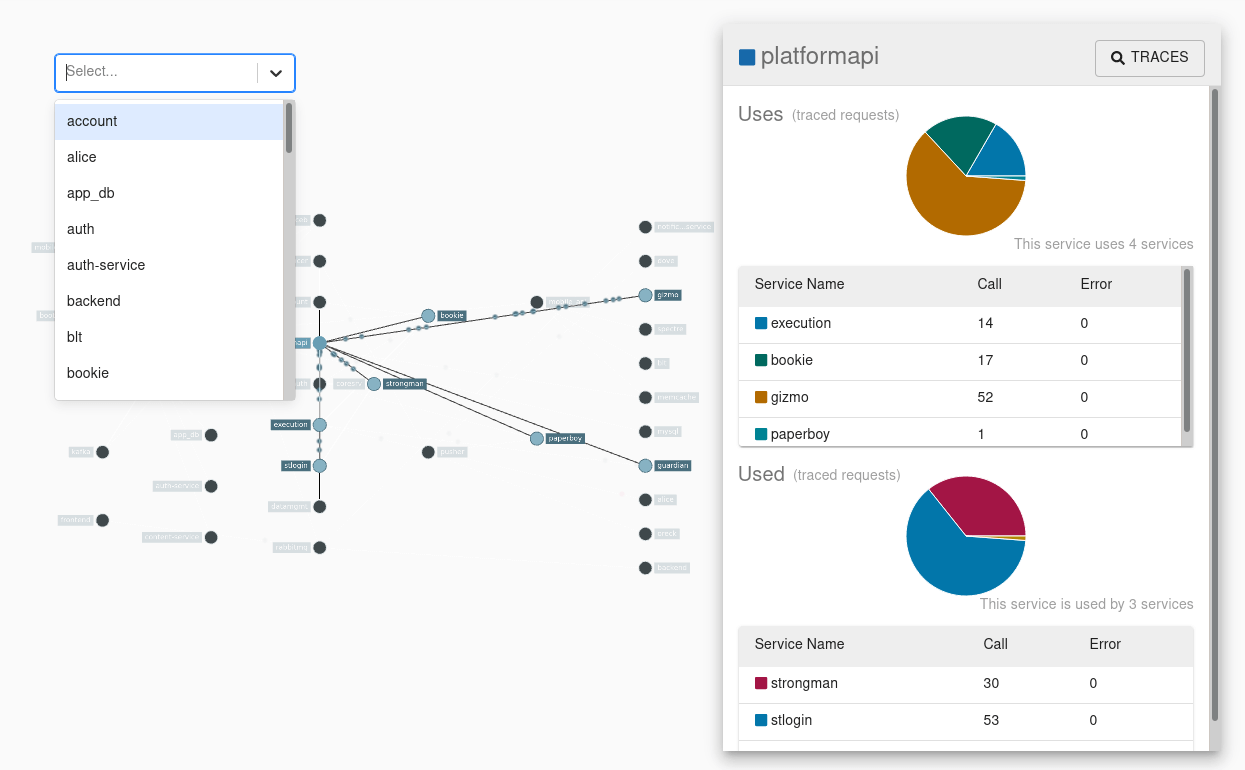
Latency troubleshooting is the job Zipkin was built for. The server runs as a single executable jar or Docker image, and its UI lets you search by service, operation, tags, and duration alongside a dependency diagram of how traced requests move between applications.
Getting OTLP into Zipkin takes an extra piece. Core Zipkin doesn't include an OTLP receiver, so OTLP data reaches it either through a contrib module that its own README marks as experimental, or through a Collector that converts spans to Zipkin's format. OpenTelemetry has also deprecated its Zipkin exporter specification, with existing stable exporters patched until at least December 2026, which means the direct-exporter path won't be around indefinitely.
LLM call coverage: OTLP through a contrib module or a Collector, with GenAI attributes as tags and no LLM-aware views.
Pricing: No license cost. Beyond the storage cluster, Cassandra and Elasticsearch deployments need a separate Spark job to aggregate dependency links, which is one more job to schedule and run.
See what your LLM spans actually contain
With Respan, every LLM span gets its prompt, tool calls, cost, and an eval score, and a bad score becomes a dataset and a tested fix. Start for free.
FAQ
How does OpenTelemetry distributed tracing work?
OpenTelemetry handles the instrumentation, context propagation, and export side of distributed tracing, and leaves storage and analysis to whatever backend receives the spans. SDKs and auto-instrumentation libraries create the spans. The W3C traceparent header carries context between services, and OTLP ships finished spans either directly to a backend or through a Collector.
Because the backend is swappable, the same instrumentation can feed more than one tool. Respan accepts OTLP directly and maps GenAI attributes to model, token, input, and output fields, so a Collector can send service spans to an existing tracing backend and LLM spans to Respan from one pipeline. Jaeger v2 and Datadog also accept OTLP natively, while Zipkin needs a contrib module or a Collector hop.
How does distributed tracing work in microservices?
Every service in the request path is instrumented. Each one reads the incoming trace context, creates its own spans as children of the caller's span, and passes the context on with its outbound calls, and the backend joins spans from every service by trace ID into one tree.
Traces in microservices usually break at edges that instrumentation doesn't cover automatically, such as message queues, background jobs, cron tasks, and calls to third-party APIs. A model provider is one of those edges, since it returns a response but no spans of its own, so anything you want to know about the call has to be recorded on your side. Respan records that side of the hop, capturing the prompt, tool calls, cost, and output on the LLM span and scoring the result, while the rest of the service tree stays in the backend you already use.
What is the difference between APM and distributed tracing?
Distributed tracing is a technique for following requests across services. Application performance monitoring is a product category that combines traces with metrics, logs, profiling, service maps, and alerting to track how an application performs. A tracing backend like Jaeger gives you traces without the rest of that stack, while application performance monitoring tools such as Datadog and Dynatrace bundle tracing into a broader platform.
Judging whether an LLM's output was correct sits outside both, and Datadog and Dynatrace each handle it in a separate AI product. Respan is built around that layer, tracing each LLM call with its prompt, tool calls, and cost, scoring outputs on live traffic, and running alongside whichever APM or tracing backend already handles your services.