Someone reports that your app feels slow. You check the dashboard and total response time is sitting where it always has, comfortably inside target. Nothing is broken, and the complaint is still correct, because what the user is reacting to is the silence before the first word appears. That's what time to first token is all about.
Artificial Analysis benchmarked first-token latency across more than 600 models, and on a snapshot of 29 of them, the fastest returned its first token in 0.4 seconds and the slowest took 159.2 seconds.
It would be easy to read a spread like that as a ranking of model quality, but it lines up with something else. The fast end is small non-reasoning models answering directly, while everything past 40 seconds is a frontier model running at a high reasoning effort setting, where the clock keeps running through the entire thinking phase before anything reaches the client. The same model can land at either end of that chart depending on how it is configured, which means the figure describes how a model is set up and served more than how capable it is.
That is also why a published number rarely matches what your own traffic shows. A benchmark runs a fixed prompt against a first-party endpoint, while your requests carry a system prompt, retrieved context, a gateway in front of them, and often a retrieval step before the model is called at all. The rest of this piece covers what moves the metric in production and how to measure time to first token against your own traffic rather than a leaderboard.
What Is Time to First Token (TTFT)? TTFT Meaning
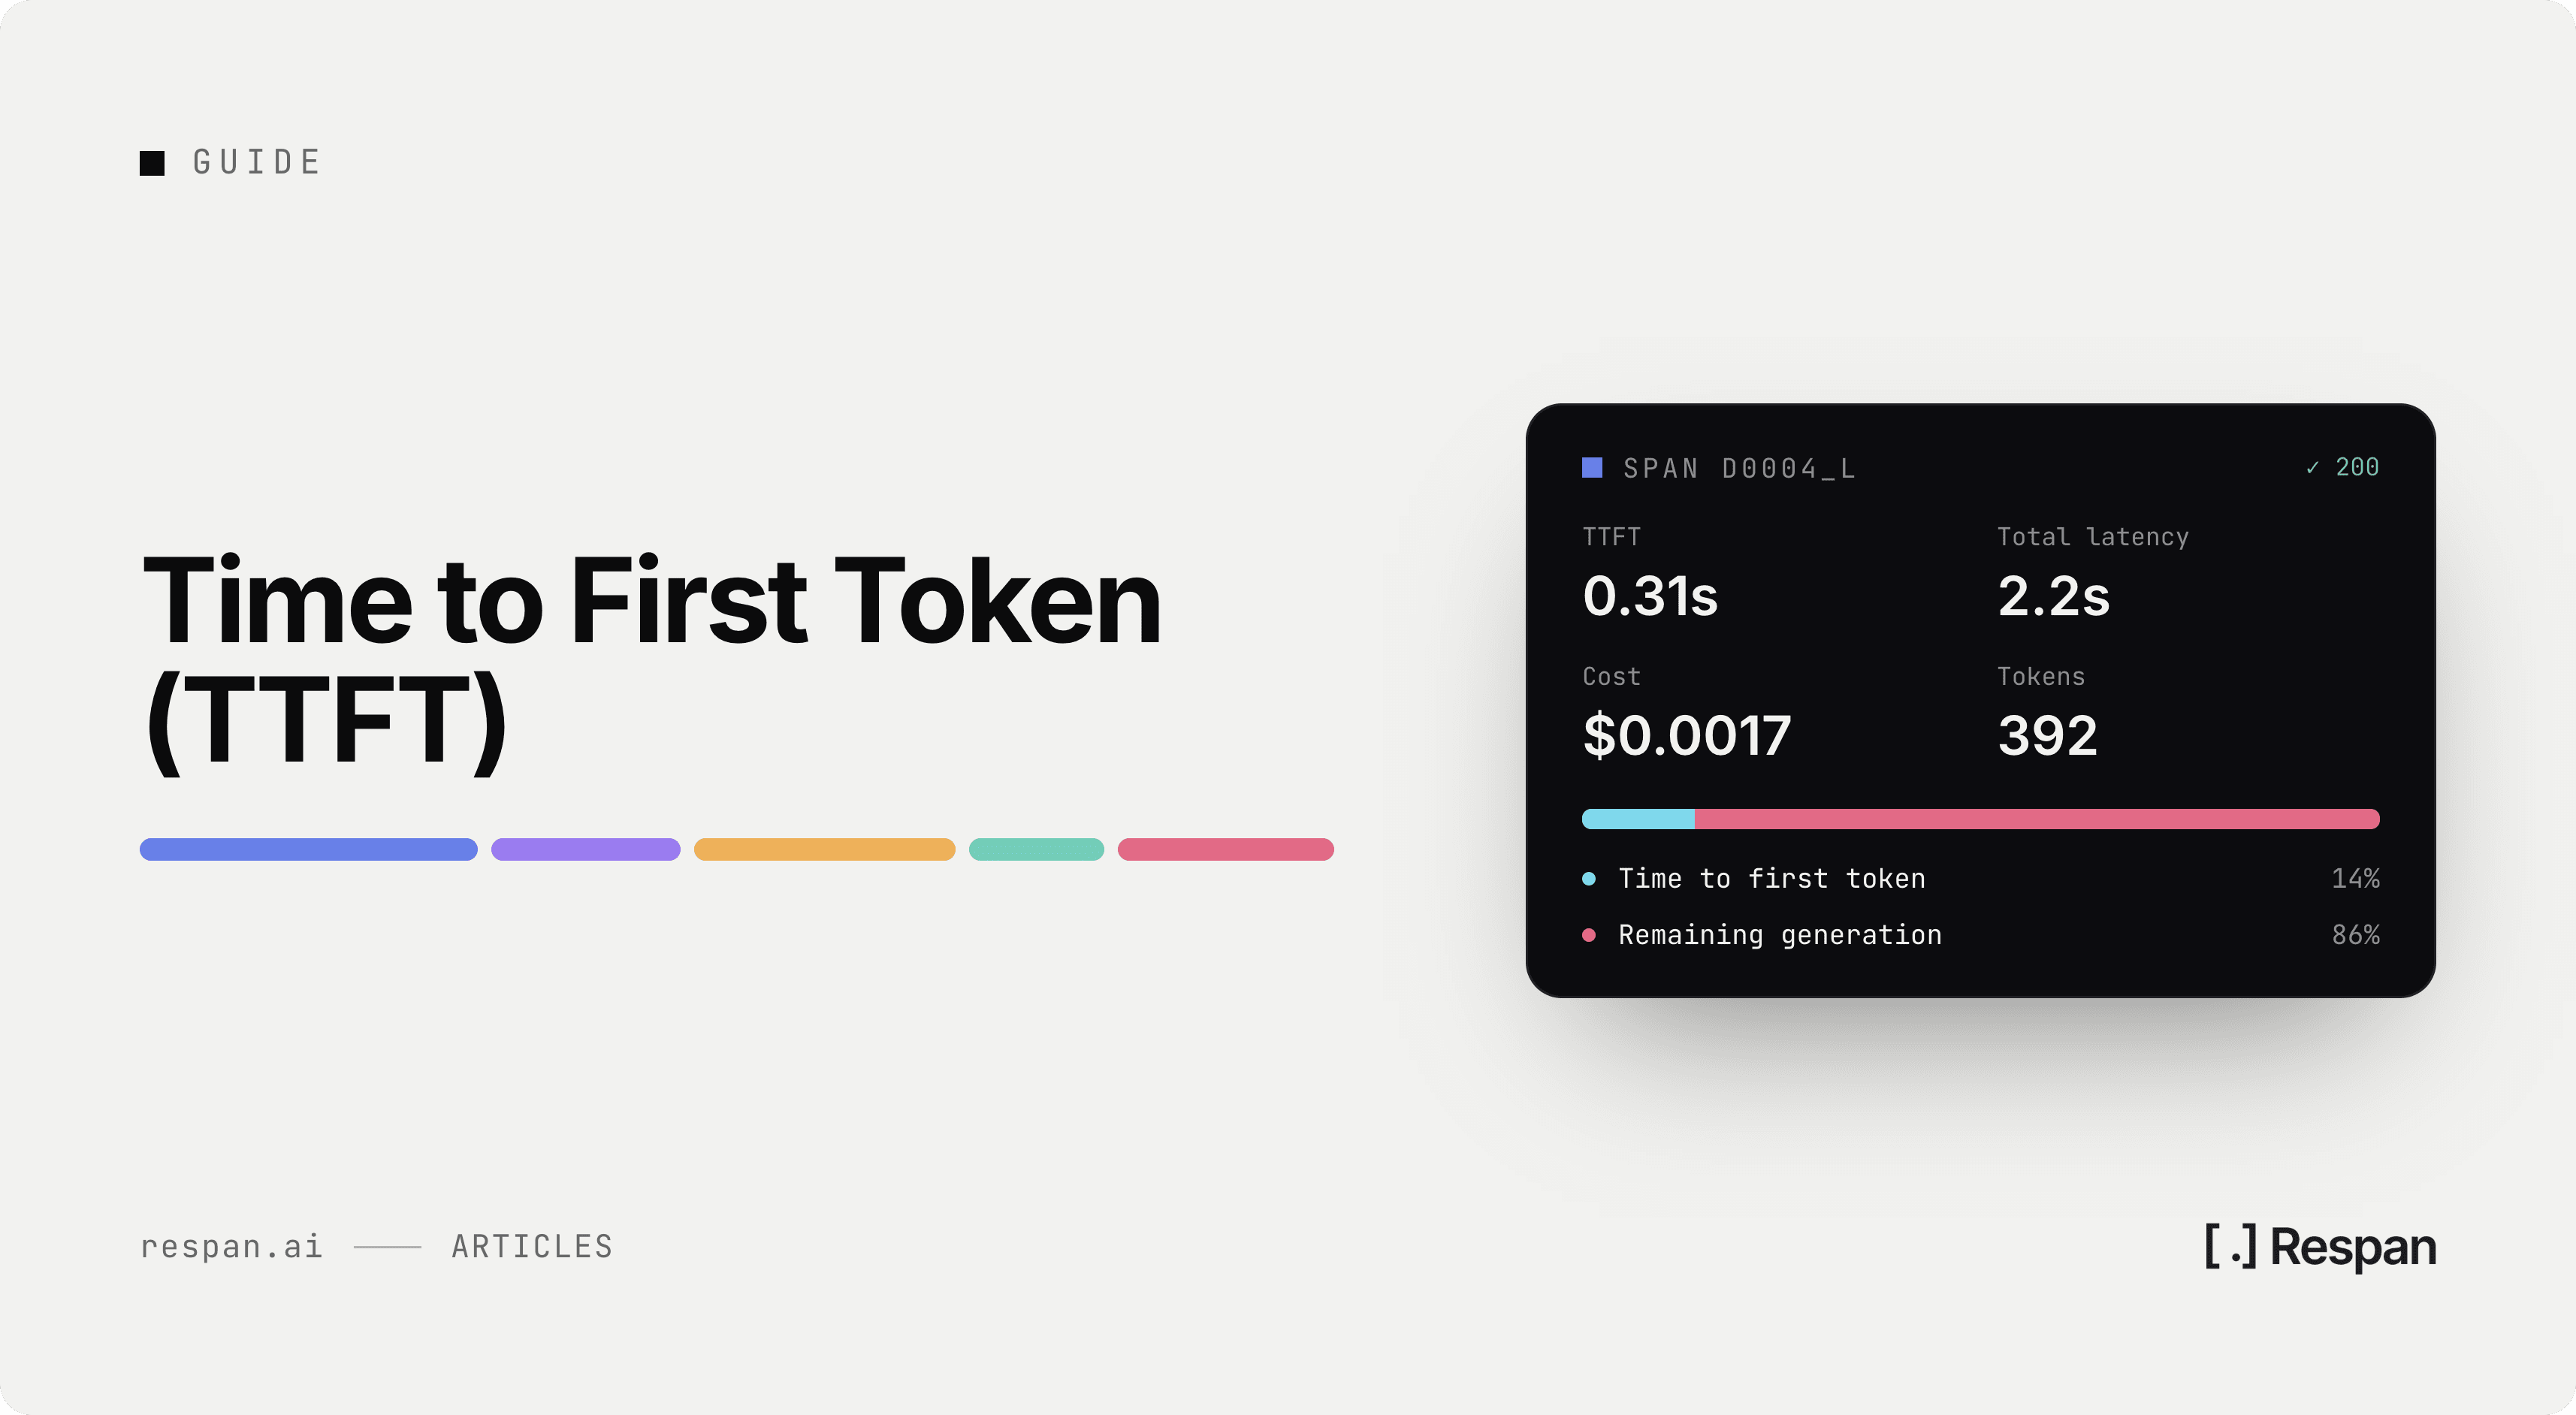
Time to first token (TTFT) is the elapsed time between an application sending a request to a language model and the first token of the response arriving back, measured in milliseconds or seconds. Also called first-token latency, it applies to streaming responses and measures how long a user waits in front of a blank screen before anything appears.
For most people, TTFT is the latency metric that maps most directly to perceived responsiveness. A model can finish an entire response quickly and still feel broken if the first token takes four seconds to show up.
Taking the measurement is simple: start a timer when the request goes out, stop it when the first streamed chunk arrives. Where you place that timer matters, though, since a timer on the server misses the network hop and any proxy in the path, and the user waits through both.
TTFT vs TPOT, end-to-end latency, and throughput
Four numbers describe different parts of the same request, and optimizing one can work against another:
- TTFT - Time from request to first token. Reflects prompt processing and queueing, and governs whether the app feels alive.
- TPOT - Time per output token. Average gap between tokens once generation starts, sometimes called inter-token latency. Governs how smooth the stream feels after the first token lands.
- End-to-end latency - Time from request to last token. Roughly TTFT plus output tokens multiplied by TPOT, though TPOT drifts under load.
- Throughput - Total tokens or requests the system handles per second. A capacity measure rather than a responsiveness one.
Which one matters depends on what the app does with the response. An interactive chat surface lives on TTFT, because a user who sees nothing for four seconds assumes the request failed. A batch pipeline processing overnight cares about throughput and nothing else. Code completion sits closer to end-to-end latency, since the editor cannot act on half a function.
How Does TTFT Work?
The clock starts when your client sends the request and stops on the first token it receives. Everything in between counts, including the network hop out, any proxy or gateway in the path, time spent waiting in the provider's queue, and the model's own processing of your prompt.
That last part is called prefill. Before a model can produce a single output token, it has to read the entire input and compute attention across every position in it, building the key-value cache that generation then reads from. The work scales with input length, so a 200-token prompt and a 20,000-token prompt do not cost the same amount of time to get started, even when they produce identical responses.
Once prefill finishes, the model enters the decode phase and emits tokens one at a time. Decode is where TPOT lives. Prefill is where TTFT lives, and the split explains why the two numbers move independently. A model can start slowly and then stream quickly, or start instantly and then trickle.
Reasoning models complicate the picture. When a model spends thousands of tokens thinking before it produces an answer, and does not stream that thinking to the client, the first token your application actually receives is the first token of the answer. Every second of reasoning sits inside your TTFT measurement. This is why published figures for reasoning models run into the tens of seconds while the same benchmark shows non-reasoning models under a second.
What Causes TTFT to Go Up?
TTFT is a sum of contributions from different layers, and a regression usually traces to one of them rather than to the model getting slower. The common causes:
- Prompt and context length. Longer input means more prefill work, which makes this the most direct lever you control. Retrieval-augmented generation and long conversation histories both push input size up quietly over time, so a prompt that started at 800 tokens can be at 12,000 six months later without anyone deciding to make it so.
- Reasoning effort. Configuration moves this metric more than model size does. Artificial Analysis measures Claude 4.5 Haiku at 0.77s in non-reasoning mode and the same model at 15.91s with reasoning enabled, which is roughly a 20x difference from a setting rather than a model swap.
- Queueing and provider load. When the serving side is busy, requests wait before any processing starts. Under high concurrency, queue time can account for more of the number than the model's own work, and it varies by hour rather than by anything in your code.
- Retrieval and tool calls that run before the first model call. In an agent, the user's wait starts well before the LLM request does. Embedding a query, searching a vector store, reranking results, and calling a tool all happen first, and none of it appears in the TTFT your provider reports.
- Routing hops, retries, and fallback. Every layer between your app and the model adds its own time. More importantly, a retry after a timeout restarts the clock, so a request that quietly fails at three seconds and succeeds on the second attempt gives the user a first token at six.
- A streaming path that buffers. The backend can produce a token quickly and the user can still wait, because a proxy buffered the response, the server did not flush chunks promptly, or the client waited for a complete sentence before rendering. The measurement looks fine at the API boundary and terrible in the browser.
Most of these can be present at once, which is why a single average number rarely tells you which one to work on.
Why Is TTFT Important for LLMs?
Because it is the part of the experience a user judges before they have read a word of the output:
- Perceived responsiveness. A slow first token reads as a broken product. Total completion time can be long and still feel acceptable if something appears quickly, since the user has evidence the system is working and can start reading. The reverse does not hold. A fast total response that begins with several seconds of silence feels worse than the clock says it should.
- TTFT inside an agent chain. For a multi-step agent, the metric your provider reports is the first token of one LLM call, while the number your user experiences is the first thing that reaches the interface. Those diverge as soon as retrieval, a router, or a tool call sits in front of the model. An agent with excellent per-call TTFT can still leave someone staring at nothing for eight seconds.
- What cost per token does not tell you. Spend tells you what the system costs to run. TTFT tells you whether it feels usable while it runs. A workload can be cheap per token, healthy on throughput, and still be losing users at the moment they hit Enter.
The practical value is diagnostic. Because TTFT covers the part of a request before generation begins, comparing it against total latency separates two very different problems, and that comparison is usually faster than reading through traces.
How to Monitor TTFT in Production
Benchmarks tell you what a model can do on a standardized prompt. Production tells you what it does on yours.
Measure at the client, not only at the provider
Record the timestamp immediately before the request goes out and again when the first streamed chunk arrives and renders. Server-side numbers miss the network hop, any proxy in the path, and the client's own rendering behavior, all of which are part of what the user waits through. When client-measured TTFT is materially worse than what the API reports, the gap is usually a buffering layer rather than the model.
Percentiles, not averages
An average hides the requests that generate complaints. Track P50 for the typical experience, P95 for the slow tail that affects a meaningful share of users, and P99 for the rare severe outliers. A small number of very slow requests disappears entirely into otherwise fast traffic, which is why LLM monitoring built on averages tends to look healthy right up until support tickets arrive.
Reading the percentile pattern
The shape of a regression narrows the cause before you open a single trace. When P99 spikes while P50 holds flat, queue contention during traffic bursts is the usual explanation. When every percentile rises together, the model or the capacity behind it is undersized for current load. When both jump right after a deploy, look at prompt length and configuration changes first, since a system prompt that grew or a reasoning setting that changed will do exactly this.
Comparing TTFT against total latency separates the two halves of the request. High TTFT points at time spent before the first token, meaning prefill, queueing, or something in front of the model. Normal TTFT with high total latency points at generation speed or downstream work instead.
Attributing TTFT to the span that burned it
Aggregate metrics tell you something regressed. Finding out which step owns it means looking at the request as a tree rather than a single number. In a traced agent run, each LLM call, tool run, and retrieval step is its own span with its own timing, so sorting by TTFT surfaces the streamed calls that own the user's wait, while the tool and retrieval spans around them explain the difference between that figure and the total. This is the same LLM tracing setup that makes agent debugging tractable, applied to timing rather than correctness.
Monitoring TTFT with Respan
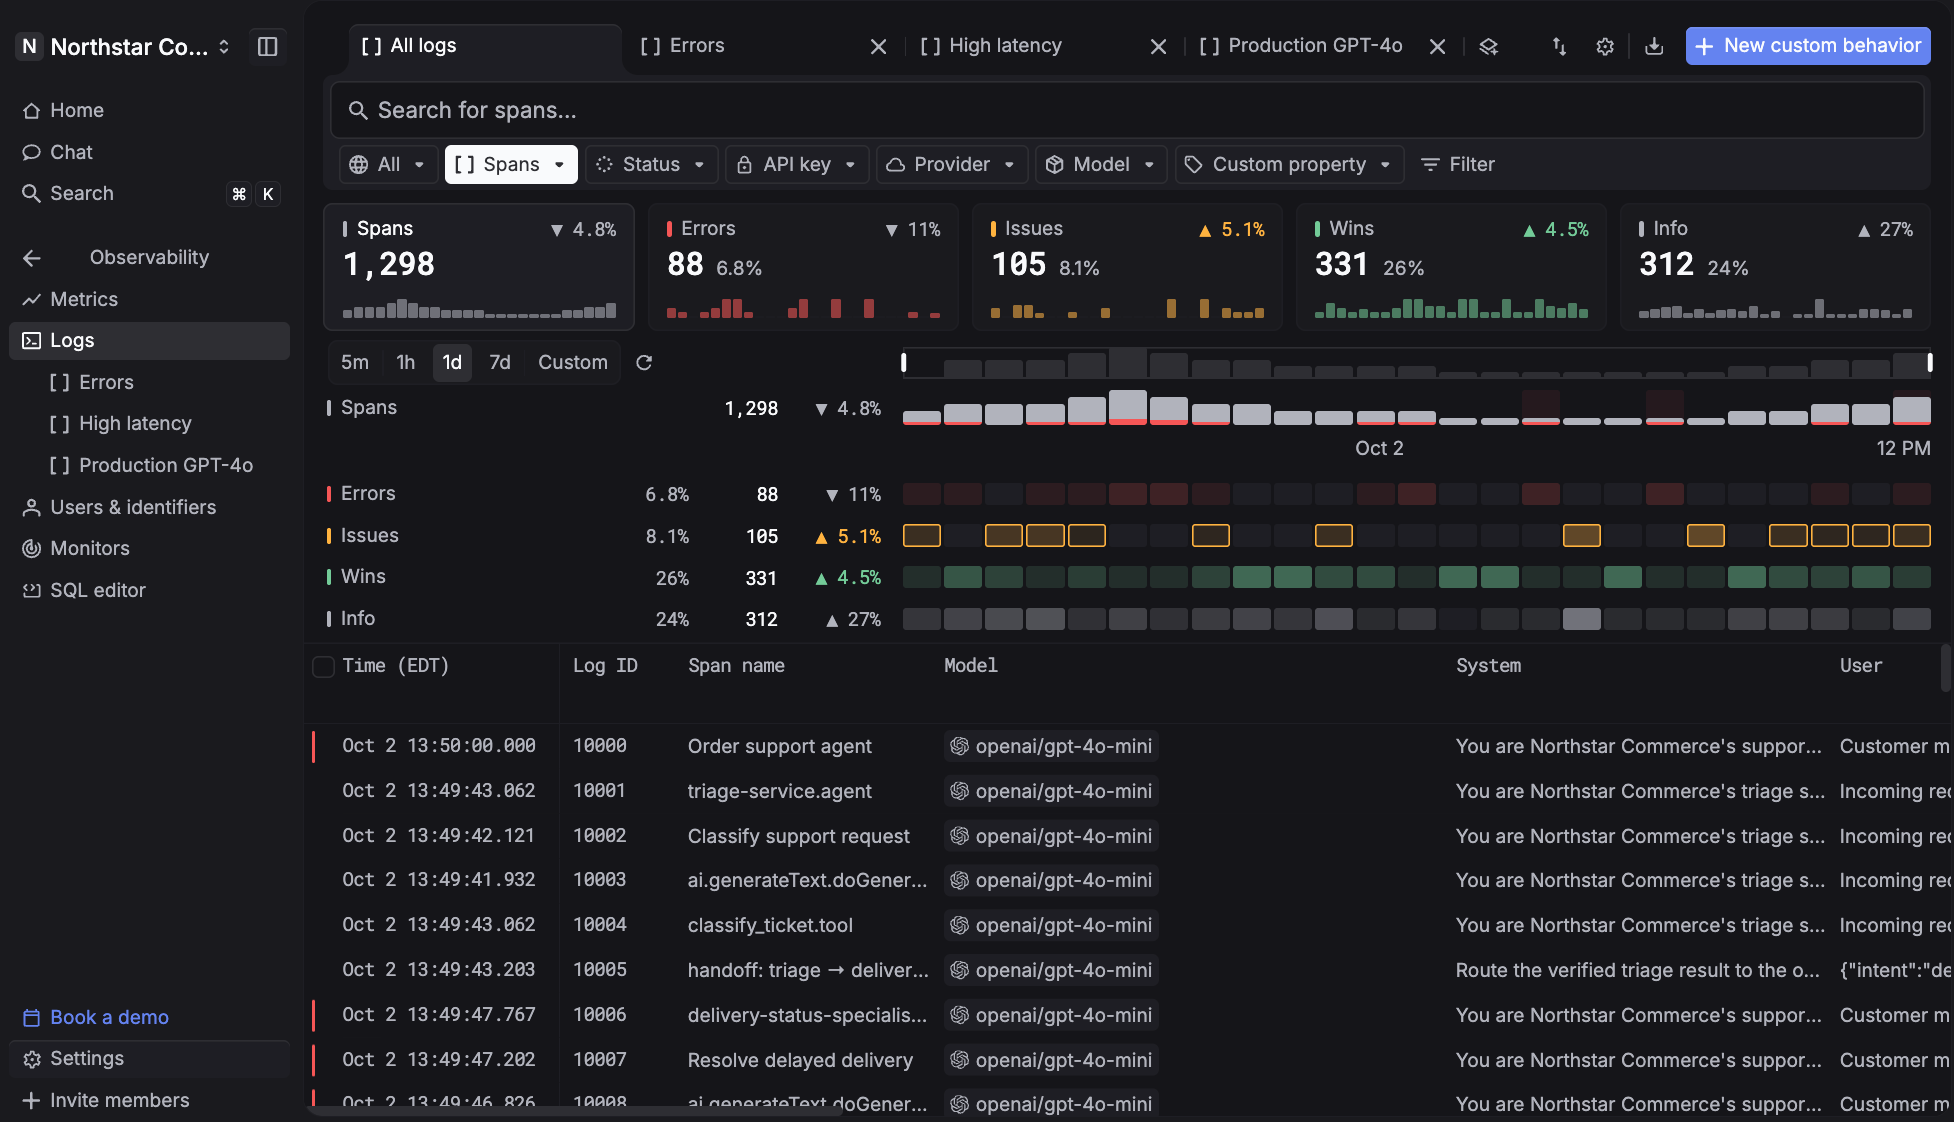
Respan is an LLM engineering platform that traces, evaluates, and improves AI agents in one place, which for latency work means you can see exactly where a request's time went instead of inferring it. Every LLM call, tool run, and retrieval becomes a span carrying its own TTFT, TPOT, total latency, tokens per second, and cost, captured automatically through the SDK or gateway you are already using. No separate instrumentation for timing, and no reconciling a metrics tool against a tracing tool that disagree.
The practical result is that a first-token regression stops being a guess. Watch aggregate TTFT on the dashboard, slice it by model or provider to find the cohort responsible, then open the trace behind a slow request and read the timing of each step that ran before the model was ever called.
What Respan gives you for latency work, and for everything around it:
- TTFT on every streamed span, captured automatically - Sliced by model, provider, API key, prompt version, or end customer, and sortable in the logs table so the slowest first tokens surface without a query.
- Latency and TTFT side by side, at any percentile - Build P50, P95, or P99 graphs grouped by model or provider to separate time spent before the first token from generation and downstream work.
- Trace trees with per-span timing - Every LLM call, tool run, retrieval, and agent turn nested parent to child, each with its own input, output, latency, and cost, so a slow run resolves to the step that caused it.
- Monitors on cost, errors, latency, or tokens - Watch a metric over windows from five minutes to seven days and route the alert to Slack, email, Microsoft Teams, or a webhook the moment it breaches.
- Error tracking and behavioral signals - Group failed spans into incidents by type and cause, and classify live traffic into patterns like frustration, jailbreak, or escalation using built-in or custom classifiers.
- Online evals on production traffic - Score live spans with an LLM judge, a code check, or human review, sampled to control cost, so a quality regression surfaces the same way a latency one does.
- Scheduled reports, exports, and webhooks - Send a recurring digest of usage and performance, bulk export filtered logs and traces asynchronously, and push events straight into your own systems.
Respan works at scale in production. For example, Retell AI runs voice agents where a delayed first token is something the caller hears, and scaled from 5M to 500M+ monthly API calls on Respan while using its debugging layer to resolve production issues 10x faster.
How to Optimize TTFT
The order below runs roughly from largest effect to smallest for a typical hosted-API workload, though which one wins depends on where your own measurements point.
1. Cut prefill work
Fewer input tokens means less prefill, and prefill is the part of TTFT you have the most direct control over. Trim conversation history to the turns that still matter, remove boilerplate that accumulated in the system prompt, and prefer a handful of high-quality retrieved chunks over a large number of marginal ones.
For example, Anthropic's guidance on reducing latency makes the same point about both input and output length.
2. Turn on prompt caching
When requests share a stable prefix such as a system prompt or a set of few-shot examples, provider-side caching reuses the computed state instead of recomputing it, which cuts both latency and input cost on cache-eligible requests. The savings scale with how much of the prompt is shared, so a long fixed preamble benefits far more than a short one. Setting it up correctly is its own topic, covered in detail for OpenAI and Anthropic prompt caching and specifically for Claude's cache TTLs and pricing.
3. Right-size the model and the reasoning setting
Reasoning effort is the single largest configuration lever on this metric, given the 20x swing between Claude 4.5 Haiku's reasoning and non-reasoning figures. If a task does not need extended thinking, turning it off changes TTFT by more than any prompt edit will. Where a task does need it, a smaller model can often serve the first response while a larger one handles the work behind it, though that pattern adds real complexity and needs testing before it ships.
4. Separate interactive traffic from batch
Batch jobs and interactive requests competing for the same capacity means a spike in the former shows up as queue time in the latter. Splitting them by key or deployment keeps a nightly job from degrading the chat experience, and scaling earlier rather than later avoids queue buildup in the first place.
5. Fix the streaming path
Confirm that streaming is enabled end to end, that no proxy in the path buffers the response, that the server flushes chunks as they arrive, and that the client renders the first chunk instead of waiting for a complete sentence. Any one of these can add seconds to what the user experiences while leaving the server-side measurement untouched, which is what makes client-side instrumentation worth the setup.
6. Route around a slow provider
The same model served from different endpoints is not the same speed, and the gap can be larger than the gap between models. OpenRouter's provider data for Gemini 2.5 Pro puts Google's own Vertex Global endpoint at 2.36s median round-trip latency against 15.87s for Vertex EU, with AI Studio in between. Same vendor, same model, nearly 7x apart on region alone.
Those figures are rolling medians rather than fixed properties, so they move with provider load and infrastructure changes. That argues for measuring your own traffic rather than trusting a published table, and for being able to switch endpoints without a code change. An LLM gateway makes that a configuration decision, and it also gives failover somewhere to go when a provider degrades rather than fails outright.
FAQ
What is a good time to first token?
It depends on what the interface does with the response. Interactive chat and voice generally want the first token inside a second, since anything longer starts to read as an unresponsive product. Code generation and agentic workloads tolerate more, because the user expects deliberation and often cannot act on a partial result anyway. Rather than adopting a universal target, measure your current P50 and P95 on real traffic and set a service-level objective against that.
What is OpenAI o3's time to first token?
OpenAI does not publish a figure for o3 itself, but it has for the smaller model in the family. Its own benchmark chart puts o3-mini at an average of roughly 7.7 seconds to first token against 10.16 seconds for o1-mini, a gap of about 2,500ms. Both are reasoning models, so the thinking phase completes before the first token reaches the client, which is why the numbers sit an order of magnitude above what a non-reasoning model returns. Reasoning effort is configurable on these models, and lowering it lowers the wait.
What is Gemini 2.5 Pro's time to first token?
Artificial Analysis reports 23.09s on Google AI Studio and 28.58s on Google Vertex. Because Gemini 2.5 Pro is a reasoning model, that measurement is time to first answer token and includes the thinking phase, which is why it sits so far above the figures for non-reasoning models. Artificial Analysis now lists the model as deprecated and continues benchmarking only its default workload.
What is Claude's time to first token?
Anthropic does not publish per-model TTFT figures. Its latency guidance defines the metric, separates it from baseline latency, and points teams toward three levers instead: choosing the right model, with Claude Haiku 4.5 named for speed-critical applications, trimming prompt and output length, and streaming responses so users see output as it arrives. Enabling extended thinking moves the number substantially, since the reasoning phase completes before the first answer token reaches the client.
Is TTFT the same as latency?
No. Latency usually refers to total request time, from the request being sent to the last token arriving. TTFT covers only the first portion of that, ending when the first token appears. Tracking both is what lets you tell prefill and queueing problems apart from generation and downstream ones, which is a distinction worth keeping in mind more broadly when thinking about observability versus monitoring.
Does streaming reduce TTFT?
Streaming does not change how long the model takes to produce its first token, but it changes when the user sees it. Without streaming, nothing renders until the full response is complete, so the perceived wait equals end-to-end latency. With streaming, the perceived wait equals TTFT. For most interactive interfaces that is the largest single improvement available, and it requires no change to the model or the prompt.