Every alert you have ever written against a log stream matches on a vocabulary someone chose in advance. ERROR, WARN, a 5xx, a stack trace, a connection timeout. The alert fires because the application announced that something had gone wrong, and the discipline works as well as it does because most software fails loudly.
However, more of the stack now fails quietly. A model returns a confident wrong answer, an agent loops through six tool calls and gives up, a retrieval step pulls the wrong document. Each of those emits a 200 at ordinary latency with a perfectly well-formed record attached, and structured logging makes that record easier to search without making it any easier to catch.
So the useful question is not only what a platform costs per gigabyte. It is what it can read out of a record once the record stops being the thing that tells you there is a problem, which is the lens the twelve best log monitoring tools and software below are compared on.
What Is Log Monitoring?
Log monitoring is the practice of collecting log output from applications and infrastructure into one place, watching it continuously, and raising an alert when a pattern in it matches a condition you defined. Collection, parsing, storage, and search are the plumbing. The monitoring part is the continuous watch and the alert at the end of it.
A working setup has an agent or collector on each source shipping records to a central store, a parsing layer that turns unstructured text into queryable fields, a retention policy deciding how long each class of data survives, and alert rules evaluated against the stream as it arrives.
The reason it remains the first tool anyone reaches for during an incident is that logs carry detail nothing else does. A metric tells you error rate went from 0.1% to 4%. The log record tells you which customer, which endpoint, which malformed payload, and which line of code gave up. That specificity is why teams keep paying to store enormous volumes of text they will mostly never read.
Types of Log Monitoring
The category splits by what is producing the records, and the split matters because it determines your collection method, your volume, and what a useful alert even looks like.
Event Log Monitoring
Event log monitoring covers the structured event streams that operating systems and platform services produce natively, most commonly the Windows Event Log and its Linux equivalents in syslog and journald. These are not application logs. They are records of system-level occurrences: a service starting, an account authenticating, a policy changing, a driver failing to load.
Because the format is fixed and the event IDs are documented, this is the easiest category to alert on precisely. A specific event ID repeated within a window is an unambiguous condition, which is why event log monitoring underpins most compliance and audit requirements. It is also why security teams reach for it first, and why so many tools in this space carry SIEM features alongside their operational ones.
The collection method is agent-based almost everywhere. Something has to run on the host, read the local event store, and forward it.
Server Log Monitoring
Server log monitoring covers what your own infrastructure writes: web server access and error logs from Nginx or Apache, application logs from your services, database slow query logs, container stdout, and kernel messages. This is the highest-volume category by a wide margin and the least standardized, since the format is whatever each application decided to emit.
Volume is the constraint that shapes every decision here. A moderately busy service can produce hundreds of gigabytes a month of access logs alone, most of which nobody will ever query. As a result, the real work in server log monitoring is deciding what to keep at full fidelity, what to sample, what to convert into a metric and discard, and what to route straight to cold storage for the auditors.
Containerized environments complicate this further, because the thing writing the log has a lifespan measured in minutes and the record has to survive the pod that produced it.
SaaS Log Monitoring
SaaS log/performance monitoring covers the audit and activity logs from the third-party services your organization runs on: identity providers, code hosting, cloud consoles, CRM, payment processors, and the model providers behind your AI features. You do not control the format, the retention, or the export method, and each vendor exposes it differently.
The value is coverage of activity that happens entirely outside your infrastructure. An API key created in a cloud console, a permission granted in a code host, a spending threshold crossed at a model provider. None of that touches a server you own, and none of it appears in your application logs.
The difficulty is collection. Some vendors push webhooks, some expose a polling API with rate limits, some drop files into a bucket on a schedule, and a few offer nothing without an enterprise contract. Because of that, most teams end up with partial coverage here and discover the gaps during an investigation rather than before one.
How to Choose a Log Monitoring Tool
Every platform below ingests logs, indexes them, and puts them on a dashboard. The differences that survive contact with production are structural:
- What the meter actually counts - Per-gigabyte ingest scales with how verbose your services are. Per-host scales with infrastructure and punishes container density. Per-scan or per-query scales with how much your team investigates, which is the one meter that gets more expensive the more use you get out of the tool. Price your volume against all three, because the answers diverge.
- Whether querying costs extra - Ingest rates get compared carefully and query costs get discovered later. Several platforms here bill searching separately from storing, so a wide investigation across a long window carries its own line item.
- Whether alerting is included or licensed - Alerting is the point of log monitoring, and it is not always in the box. Some free and open tiers do collection, search, and dashboards while gating triggers behind a paid plan, and some commercial plans cap the number of monitors you may configure by tier.
- What retention costs at each temperature - The headline rate usually buys a short hot window. Compliance retention, cold storage, and rehydration are separate rates, and rehydrating archived data during an incident is where teams find the number they did not budget.
- Whether it reads anything beyond the record - If model calls sit anywhere in your production path, ask whether the platform captures the prompt version, the tool calls, the retrieval step, and a quality score, or whether it reports token counts and model latency as more metrics beside everything else. Those are different products even when the marketing page uses the same words.
- What operating it costs you - A platform with no license fee still has a meter, and that meter is your team's time. Running an Elasticsearch cluster and running a single binary are different commitments, and both are real costs that belong in the comparison.
Weight these against the failures you actually need to catch rather than against a feature matrix, since every matrix in this category comes out looking roughly the same.
12 Best Log Monitoring Tools & Software
Here are the twelve best log monitoring tools, ranked on what they meter & alert on, and what they collect.
| Tool | Deployment | Meters on | Alerting | Starting price |
|---|---|---|---|---|
| Respan | Cloud | Logs and eval scores | Included on free tier | Free, then $199/mo |
| Datadog | SaaS | Hosts, GB, indexed events | Included, spans metered | From $15 per host |
| Splunk | Self-hosted, SaaS | Ingest volume or compute | Absent from free license | Quote, capped free tier |
| Elastic Stack | Serverless, hosted, self-managed | GB ingested and retained | Included | From $0.07 per GB |
| Grafana Loki | Self-hosted, managed | Volume, series, queries | Via Grafana Alerting | Free to self-host |
| Graylog | Self-hosted, cloud | Daily volume | Paid editions only | Free Open, $15,000/yr |
| Sumo Logic | SaaS | Data scanned by queries | Monitor count licensed | Quote only |
| Better Stack | Cloud | Ingest, retention, scans | Included | Free, then $25/mo |
| New Relic | SaaS | GB ingested and seats | Included | Free with 100 GB/mo |
| Dynatrace | SaaS, managed | Host units and log GiB | Included | $58/mo per 8 GiB host |
| OpenObserve | Self-hosted, cloud | GB ingested and queried | Included | Free to self-host |
| Logz.io | SaaS | GB per day and retention | Included | $0.92 per GB per day |
1. Respan
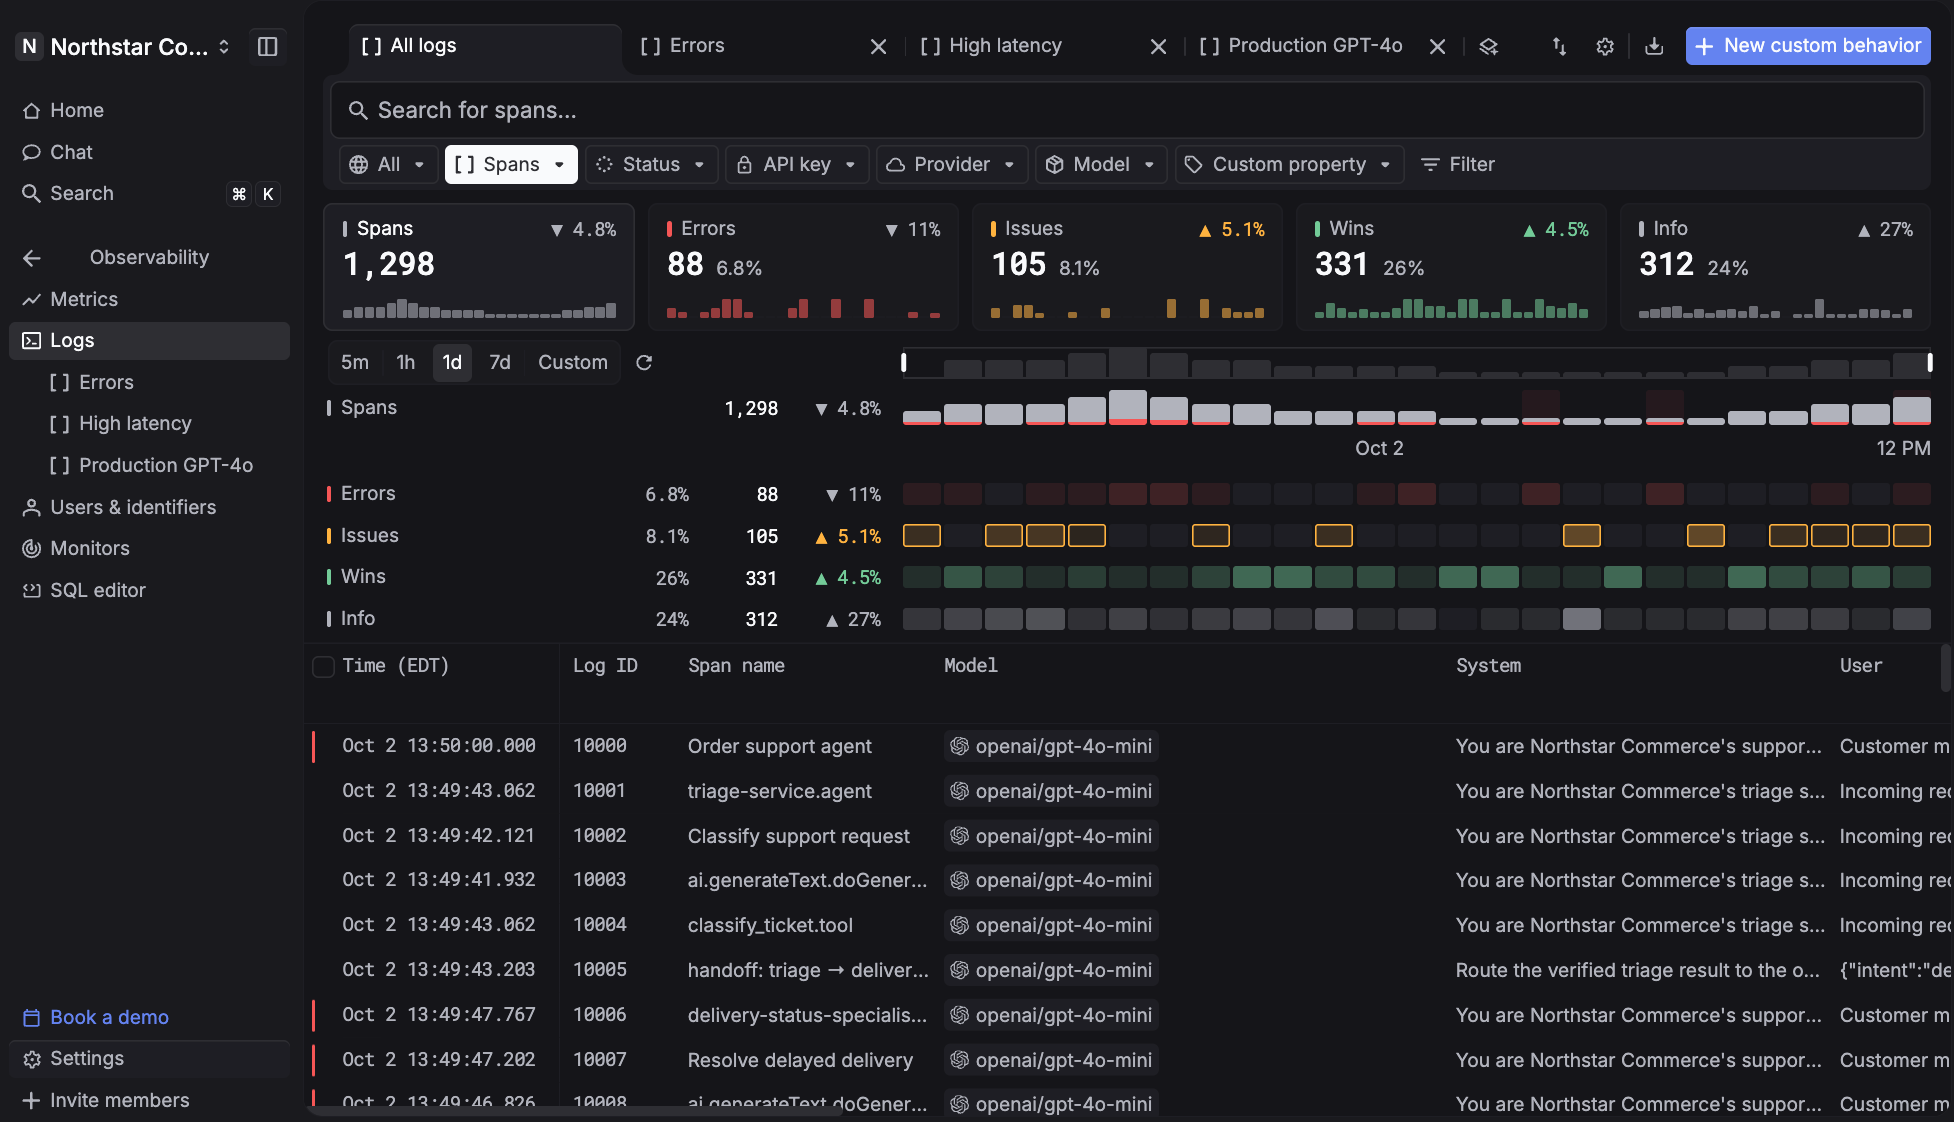
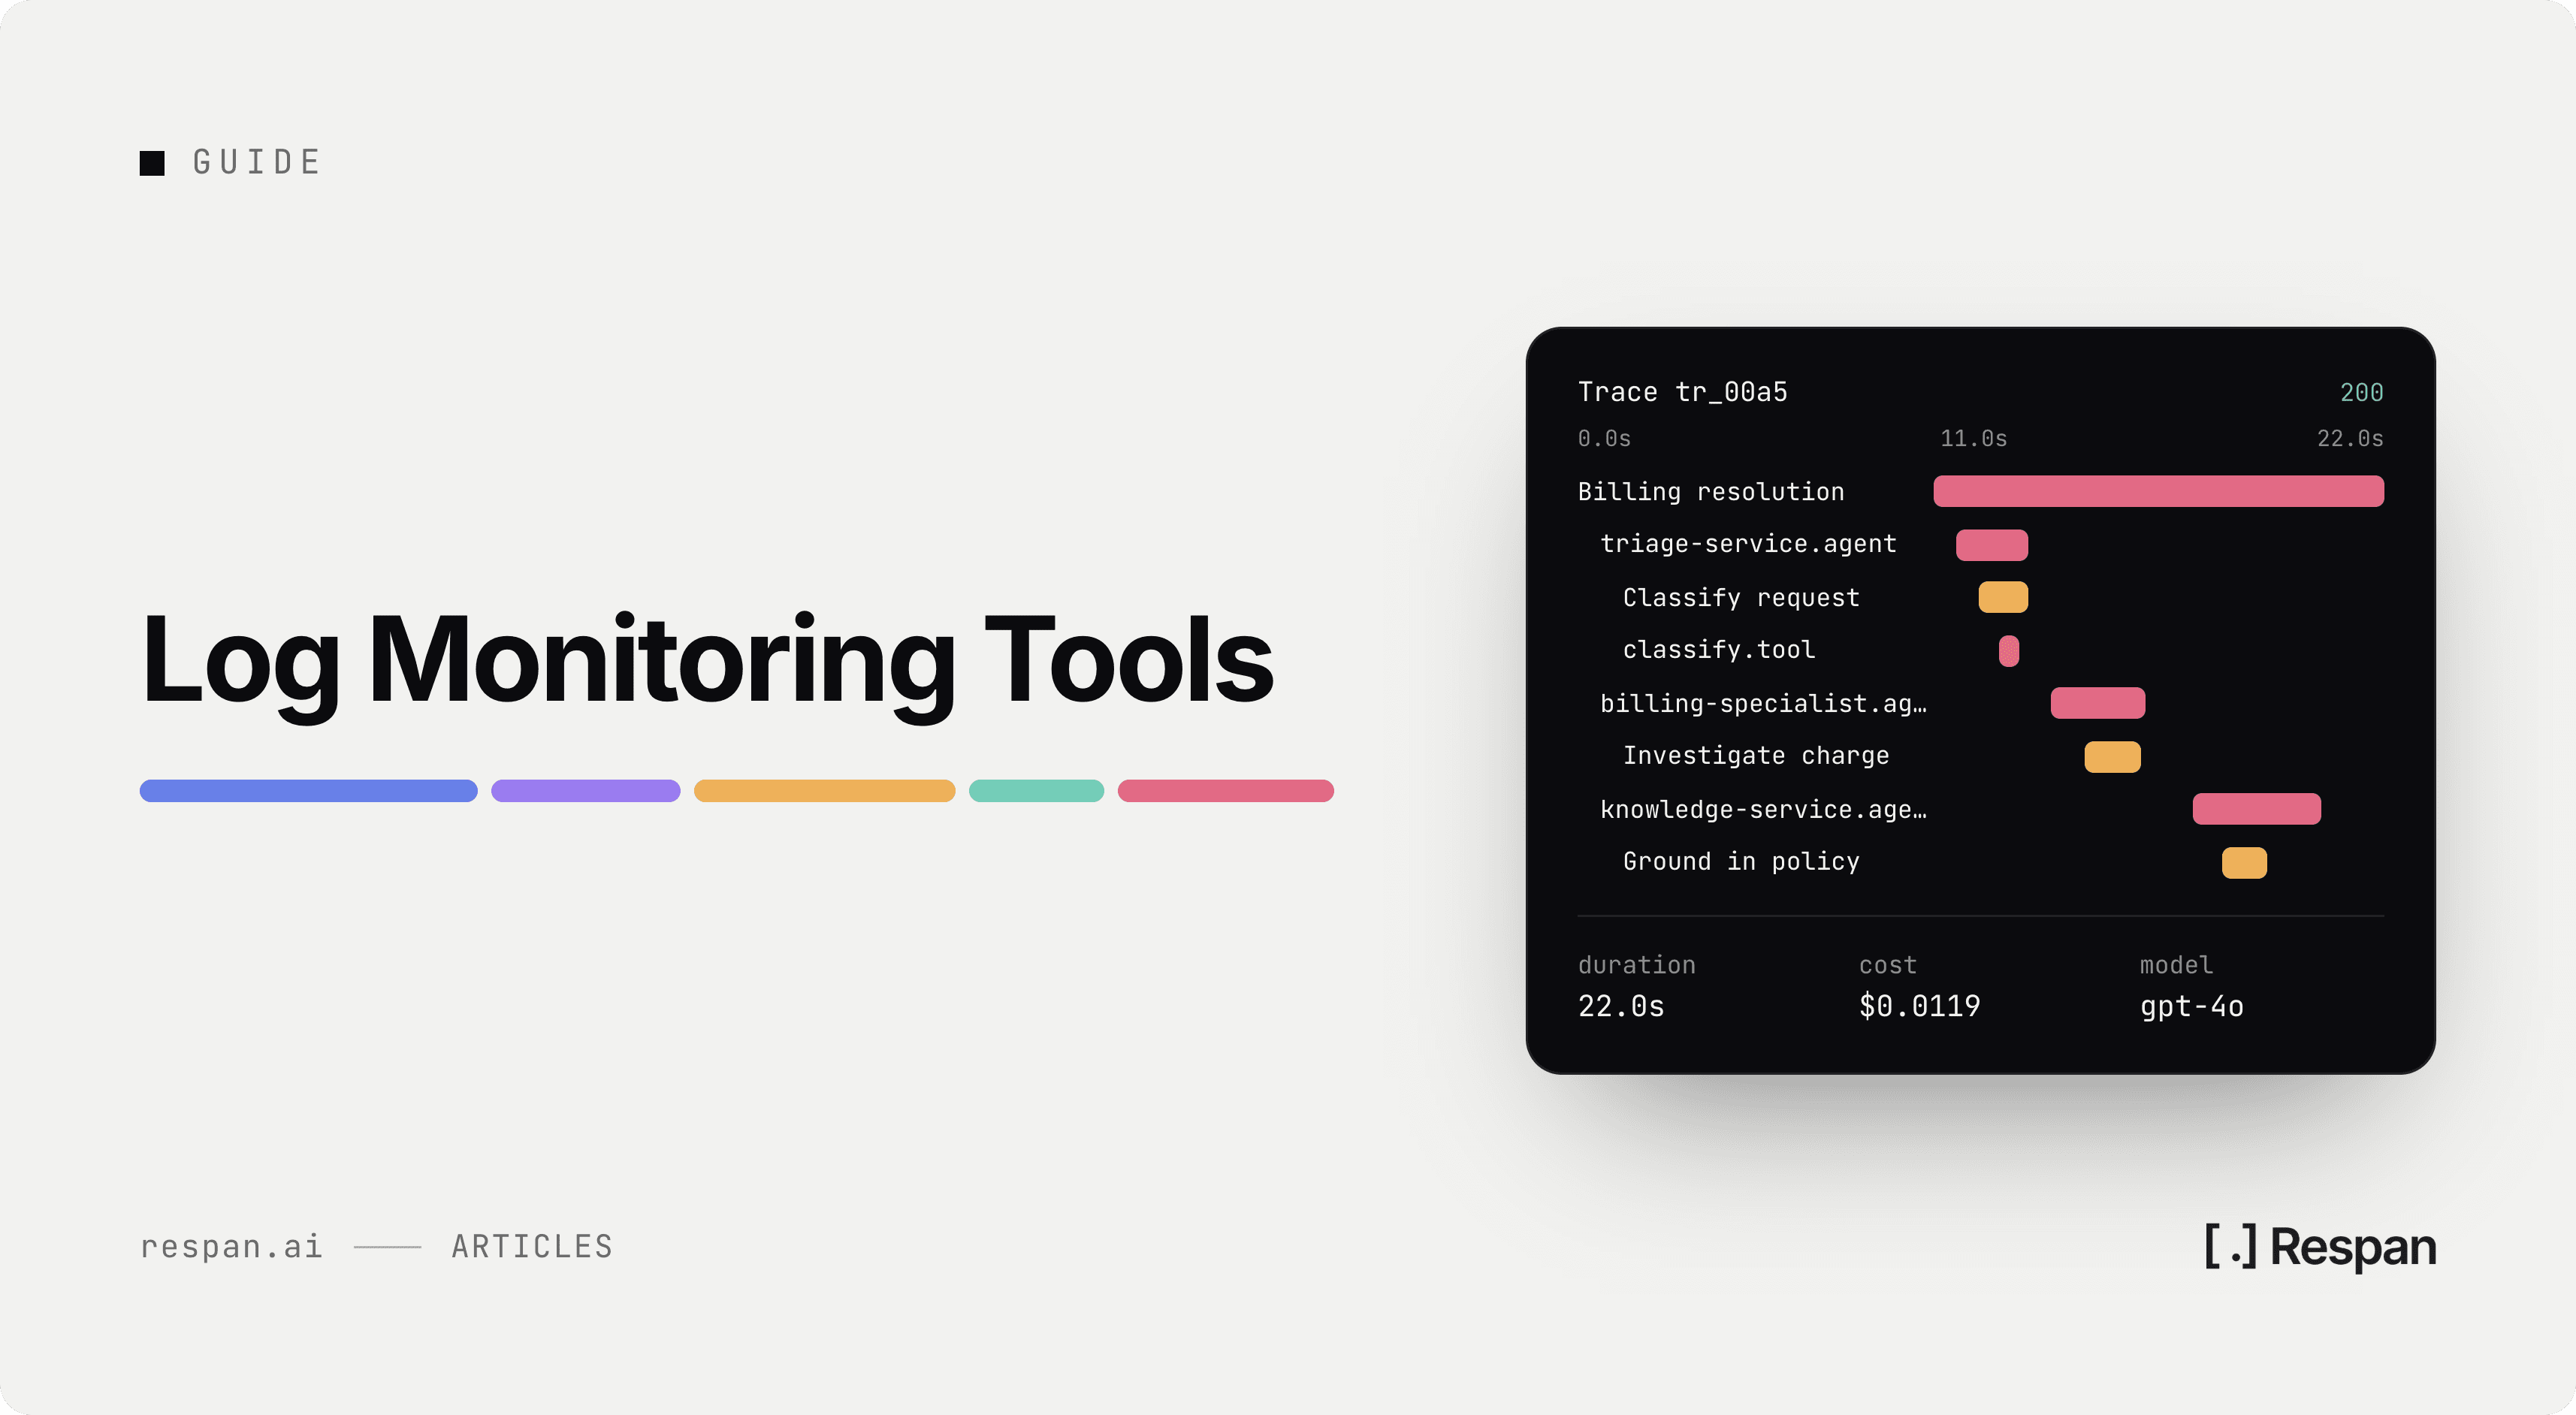
Respan is an LLM engineering platform that unifies an AI gateway, observability, evaluations, and prompt management, and it exists for the failure mode described at the top of this article. When a request runs through a model, the log record is not the unit that tells you what happened. The trace is. Every model call, tool run, retrieval, and agent turn becomes a span nested under one parent, each carrying its own input, output, latency, and cost.
What that buys you is an alert on the thing that actually went wrong rather than on its absence. Monitors watch cost, errors, latency, and tokens over any window and reach Slack, email, or a webhook the moment a threshold breaks. Online evals run scorers against live production spans, sampled to control spend, so a quality regression surfaces in real time instead of arriving as a support ticket. Behaviors classify live traffic into patterns including frustration, jailbreak attempts, laziness, unsafe output, and escalation.
The gateway underneath means none of this requires an instrumentation project. One OpenAI-compatible endpoint reaches 1,000+ models and typically adds 30-40ms of latency, and every request through it is logged and traceable from the first call.
What it monitors
- Full trace trees over prompts, tool calls, retrievals, and retries, with cost and latency on every span
- Threads that group multi-turn sessions, so a bad output on turn five traces back to context set on turn two
- Requests, errors, cost, latency, and tokens on one dashboard, sliced by model, key, or end customer
- Quality scores from LLM judges, deterministic code checks, and human review, run offline or on live traffic
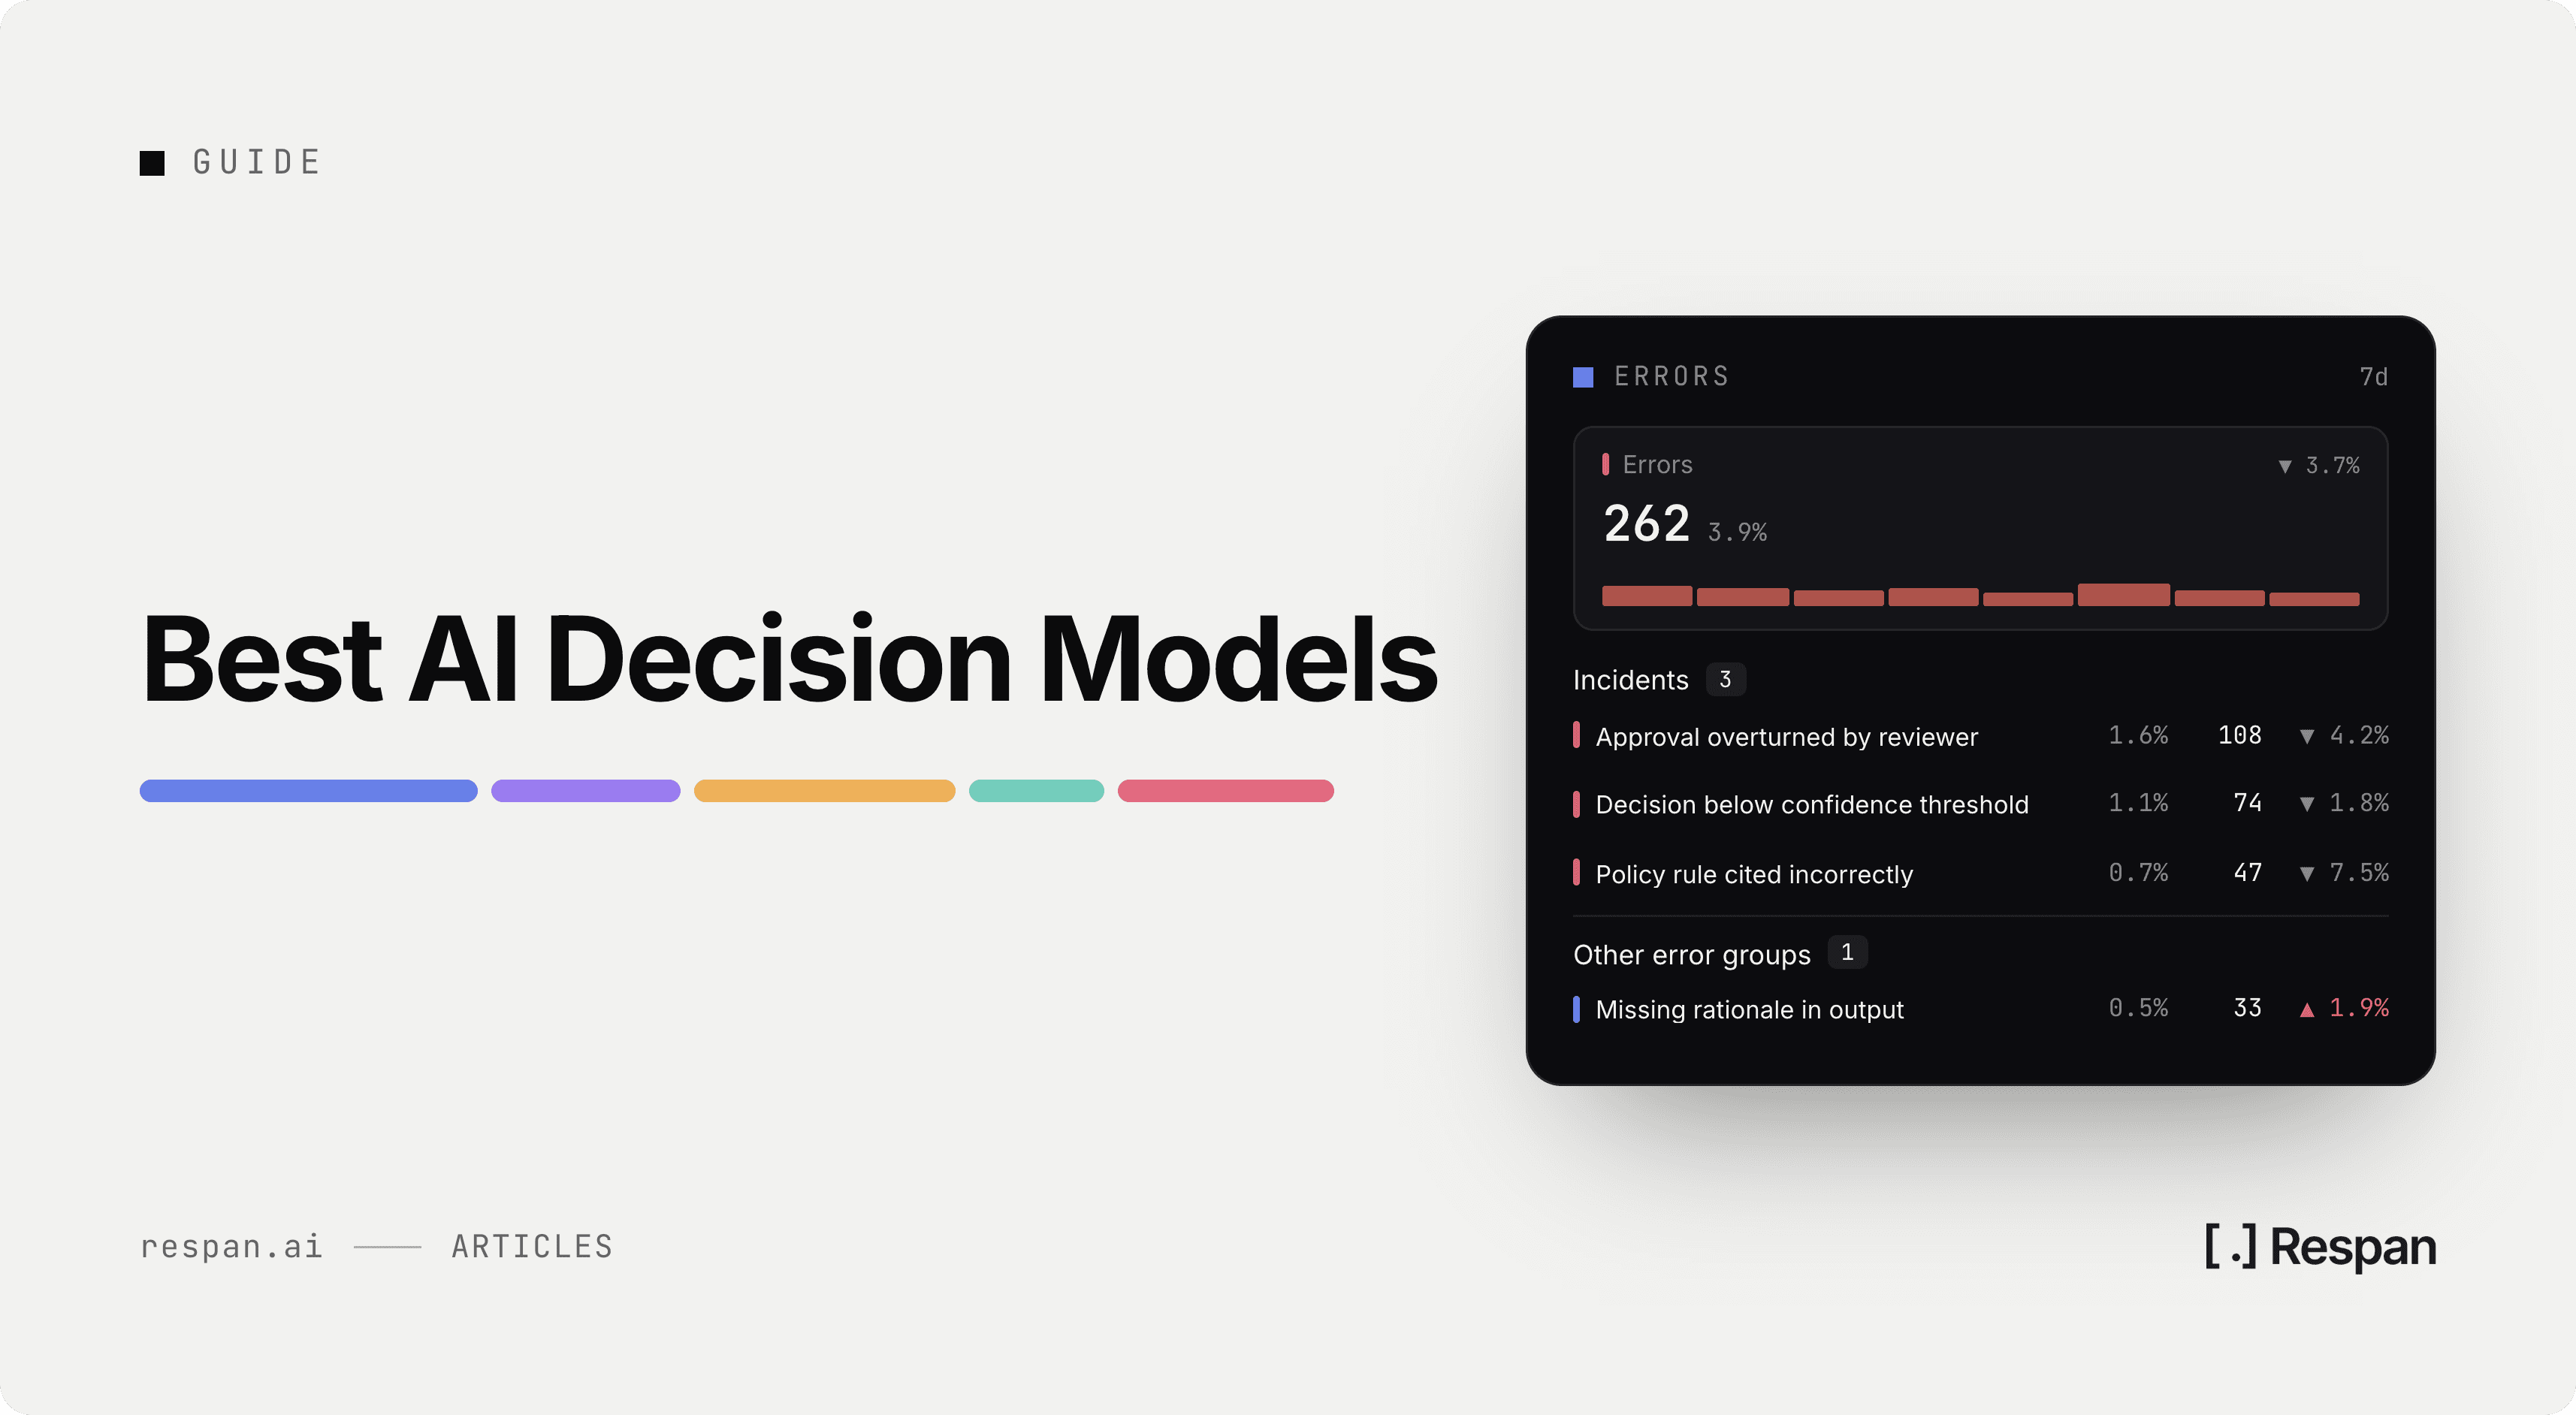
- Error spikes grouped into incidents by contributing failure, with red teaming campaigns probing deployed agents for prompt injection and goal hijacking
Alerting - Included from the free tier, alongside error monitoring, custom dashboards, advanced filters, and full-text search. Monitors and online evals both fire on breach, so operational thresholds and quality thresholds raise alerts through the same path.
Pricing - Free covers 100k logs, 1k scores, unlimited seats, and 7-day retention, which is enough to instrument a live agent rather than a demo. Team is $199 per month billed yearly for unlimited datasets, evaluators, and prompts.
2. Datadog
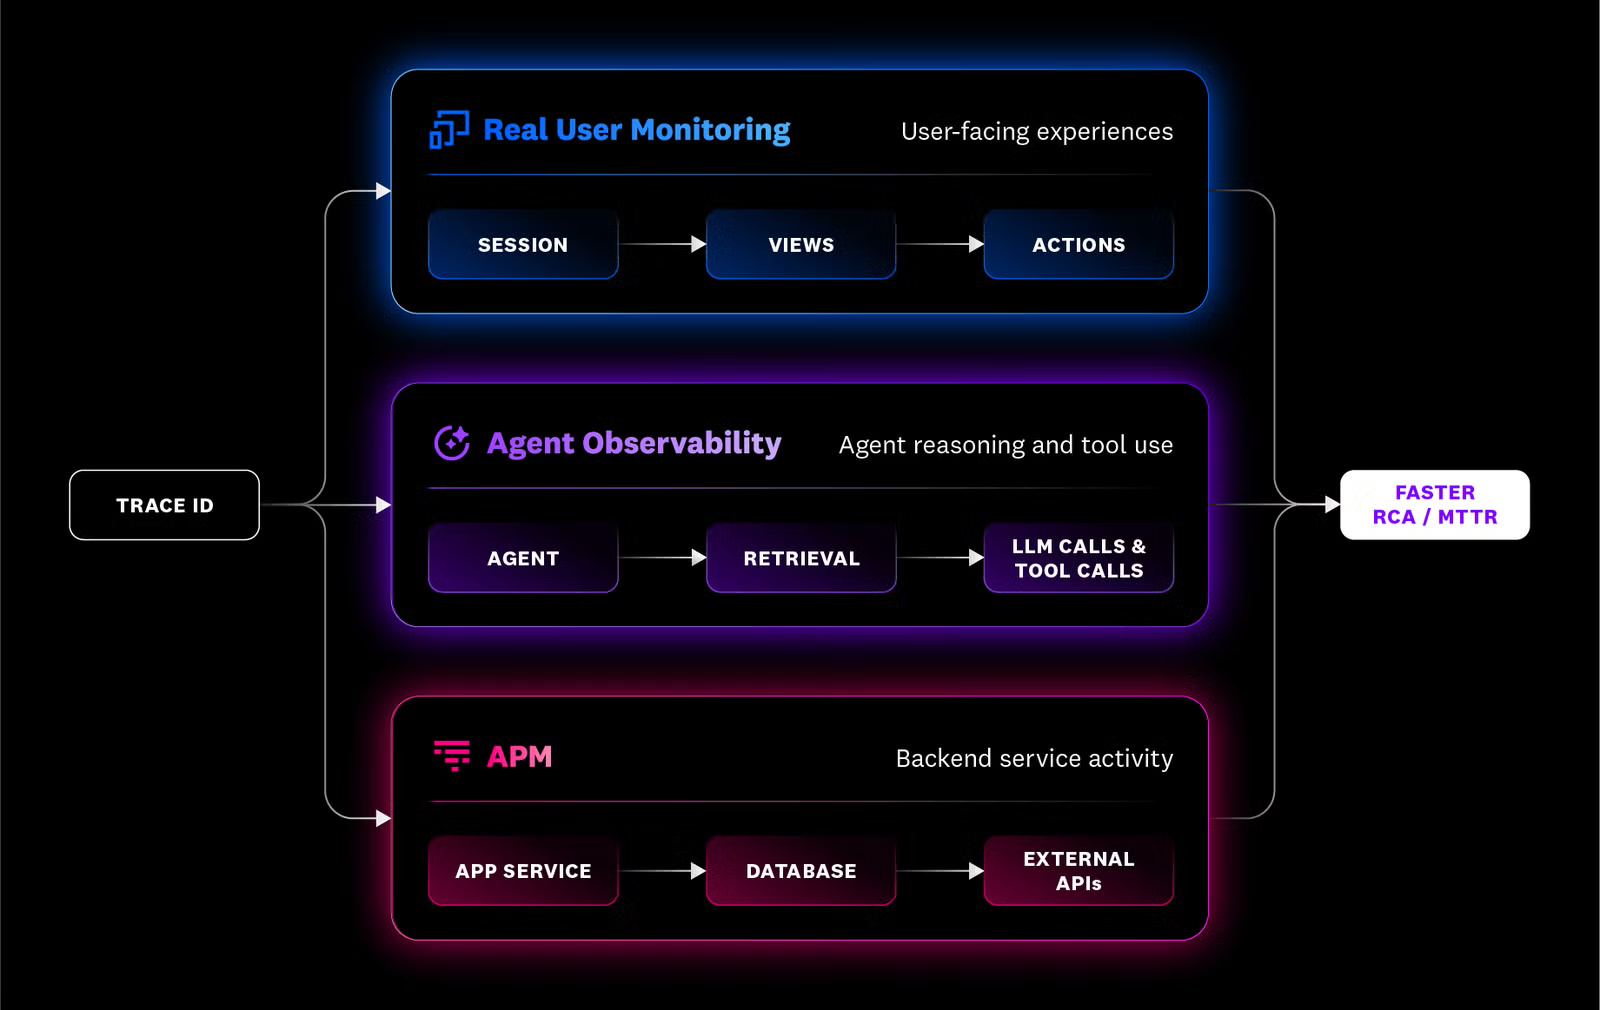
Datadog covers infrastructure, APM, log management, real user monitoring, synthetics, and security behind one interface with an integration catalog in the thousands. For log monitoring specifically, the draw is that a log record arrives already correlated to the host, the service, and the trace that produced it, so the pivot from an alert to the surrounding context takes no additional wiring.
The structure worth understanding is that ingest and index are separate decisions and separate charges. You can send everything and index a fraction, which is a genuine cost lever, and it also means the data you chose not to index is not the data your alert can match on. Because of that, the filtering decision made at setup quietly determines what you are able to detect six months later.
Host-based components bill at the monthly high-water mark, so a five-day traffic spike prices all thirty days, and that compounding is the thing any serious look at Datadog alternatives has to work through.
What it monitors
- Logs with ingest, indexing, and archive-to-S3 as separately configured stages
- Infrastructure across hosts, containers, Kubernetes, serverless, and cloud services
- APM traces, real user monitoring, synthetics, and Cloud SIEM
- Agent Observability for model and agent spans, metered on its own tier
Alerting - Included and mature, with threshold, anomaly, and pattern monitors across every signal. Watchdog adds automatic anomaly detection without predefined thresholds.
Pricing - Six meters run at once in different units. Logs are $0.10 per GB ingested plus $1.70 per million indexed events, infrastructure starts at $15 per host per month annually, APM is $31 per host with infrastructure attached, and Agent Observability is $160 per month for 100,000 LLM spans.
3. Splunk
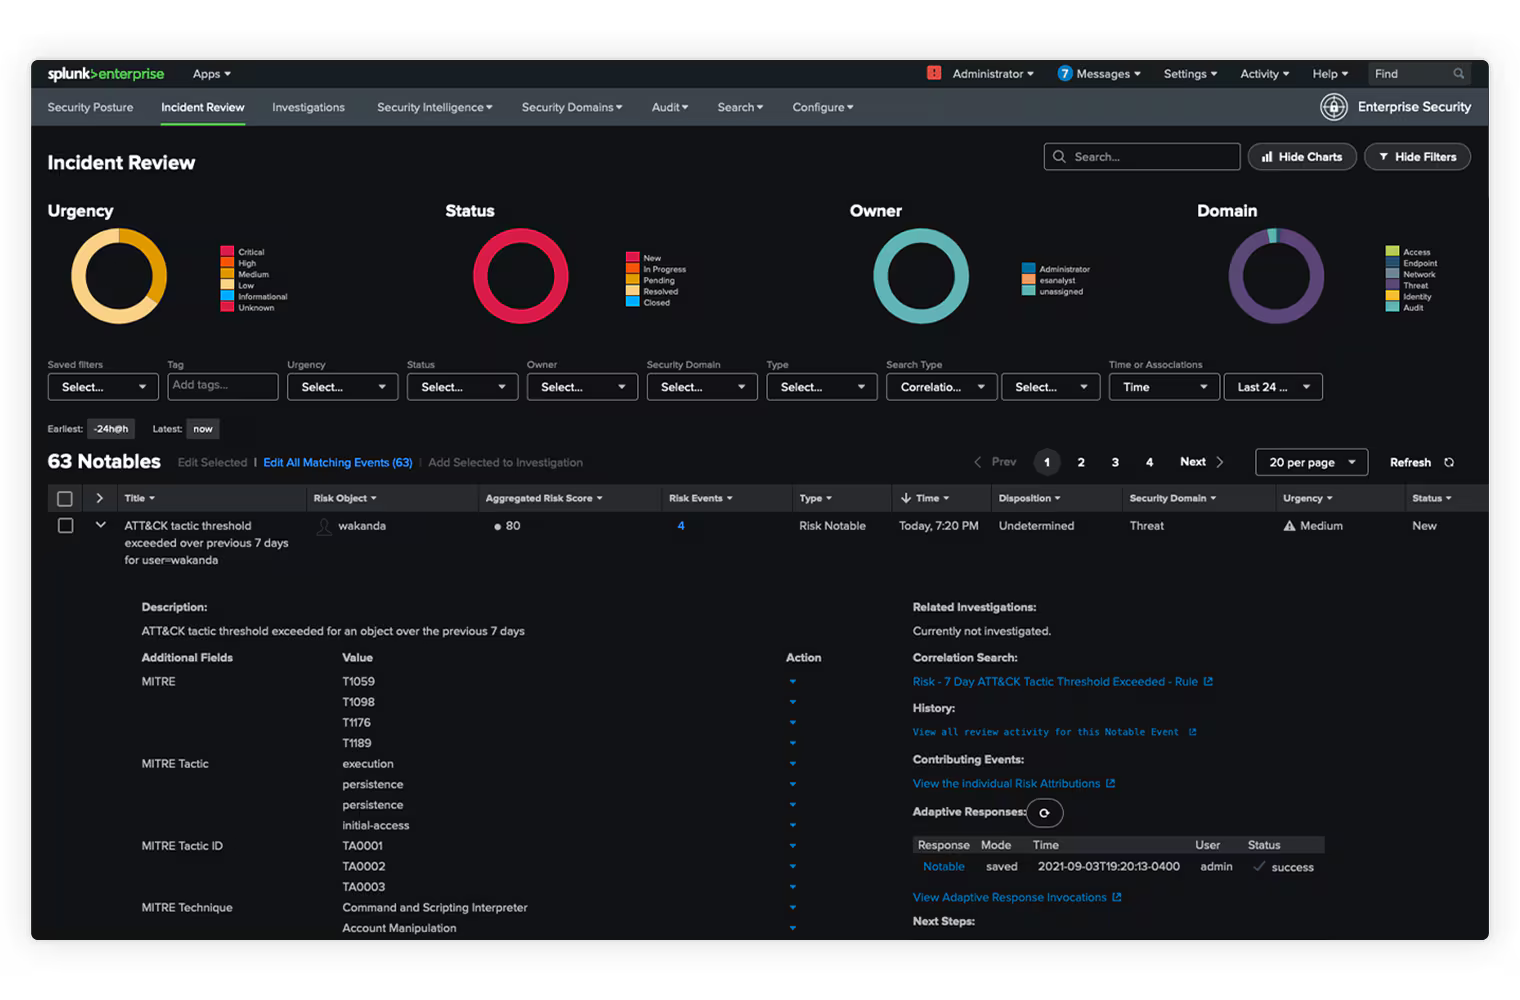
Splunk indexes machine data on the way in and searches it through SPL, its own query language, and its enduring advantage is schema-on-read. You do not define a structure before ingesting, which is why it handles heterogeneous and legacy formats that never had a schema and why it survives in estates full of systems that emit whatever they emit.
The platform grew in two directions that are licensed apart. Enterprise Security is the SIEM, and Splunk Observability Cloud handles infrastructure monitoring and APM on per-host pricing. Cisco completed its acquisition of Splunk in March 2024, and both product lines have continued shipping since.
Worth knowing before evaluating the free path: the perpetual Free license indexes 500 MB per day, is limited to single-instance installations, and has no alerting at all. It is usable for one-off forensic work on a dataset and not for continuous monitoring. Teams pricing the paid route generally end up reading through Splunk alternatives before committing, since SPL is proprietary and every saved search you write is a migration cost later.
What it monitors
- Logs, metrics, and events from forwarders, agents, and syslog across hybrid estates
- Security detections, correlation rules, and analyst workflows through Enterprise Security
- Infrastructure, APM, RUM, and synthetics through Observability Cloud
- Long-window compliance retention, which is frequently why data stays put
Alerting - Included on paid licenses and absent from the free one. Scheduled searches drive alerts, so alert cost and search cost are the same cost, and consolidating overlapping saved searches is a standard tuning exercise.
Pricing - The platform meters on daily indexing volume, on compute capacity, or on both together, depending on which model you bought. Observability Cloud is separate at $15 per host per month annually for infrastructure, rising to $60 and $75 for wider bundles.
4. Elastic Stack (ELK)
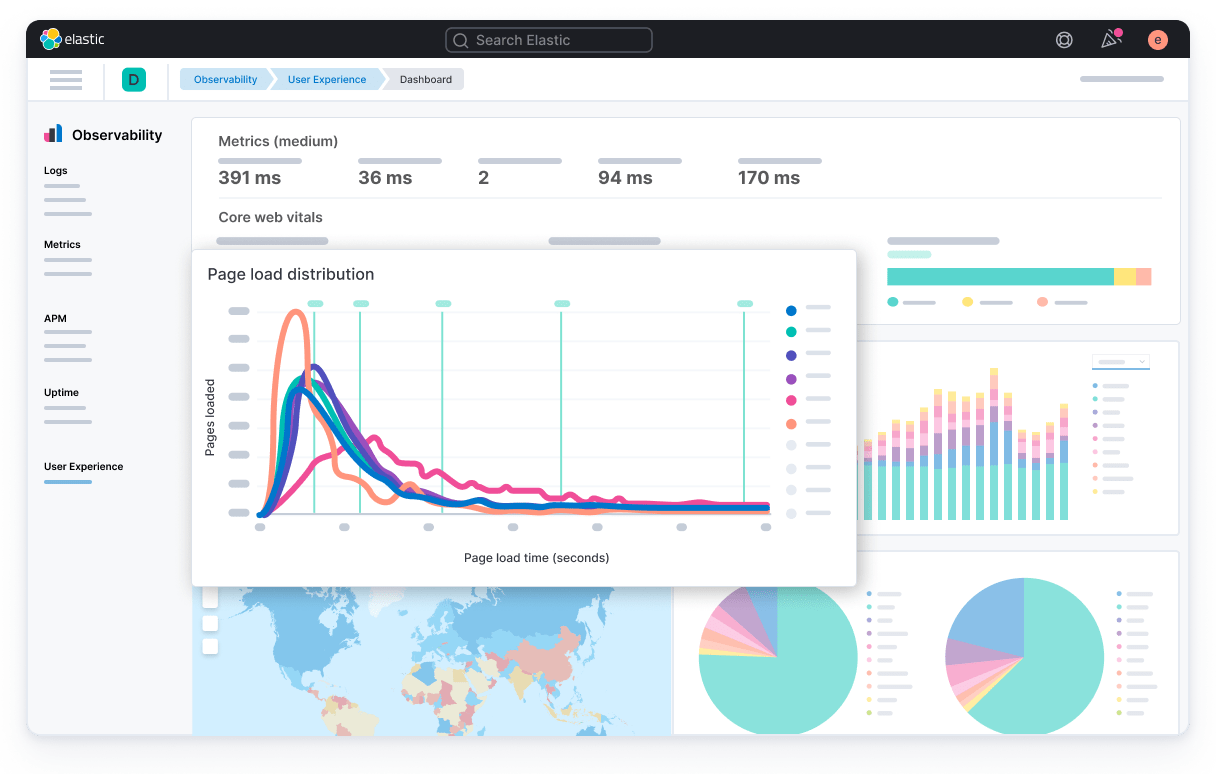
Elastic is a search engine before it is a monitoring product, and full-text search across large volumes of unstructured text is what it builds around. Teams that want genuine exploratory investigation across messy logs, rather than known queries against tidy fields, tend to lose the least capability here. Kibana handles visualization and alerting on top.
Licensing is worth stating accurately because the story changed. Since September 2024 the source has been available under AGPLv3, SSPL, or Elastic License 2.0 at the user's choice, with Elastic's own distribution remaining on Elastic License 2.0. Self-managed deployment therefore carries no license fee at the basic level, which is what makes it viable for data-residency requirements that SaaS-only platforms cannot answer.
The cost detail that catches teams out is that Elastic meters uncompressed, normalized, enriched volume measured at the end of the ingest pipeline, so billed gigabytes exceed both your raw source data and the resulting index. Estimates built from either number come in low.
What it monitors
- Logs, metrics, and traces in one store with 350+ integrations and OpenTelemetry ingest
- Machine learning anomaly detection across any indexed field
- Uptime and synthetic checks alongside APM
- Security detections through the Elastic Security tier
Alerting - Included, with rules built on KQL or ES|QL and connectors out to the usual destinations. Anomaly detection jobs can drive alerts directly on paid tiers.
Pricing - Serverless Logs Essentials starts at $0.07 per GB ingested plus $0.017 per GB retained monthly, with Complete at $0.09 and $0.019. Support above the Standard tier bills at 5% to 15% of total consumption rather than a fixed fee, which scales with the bill instead of sitting beside it.
5. Grafana Loki
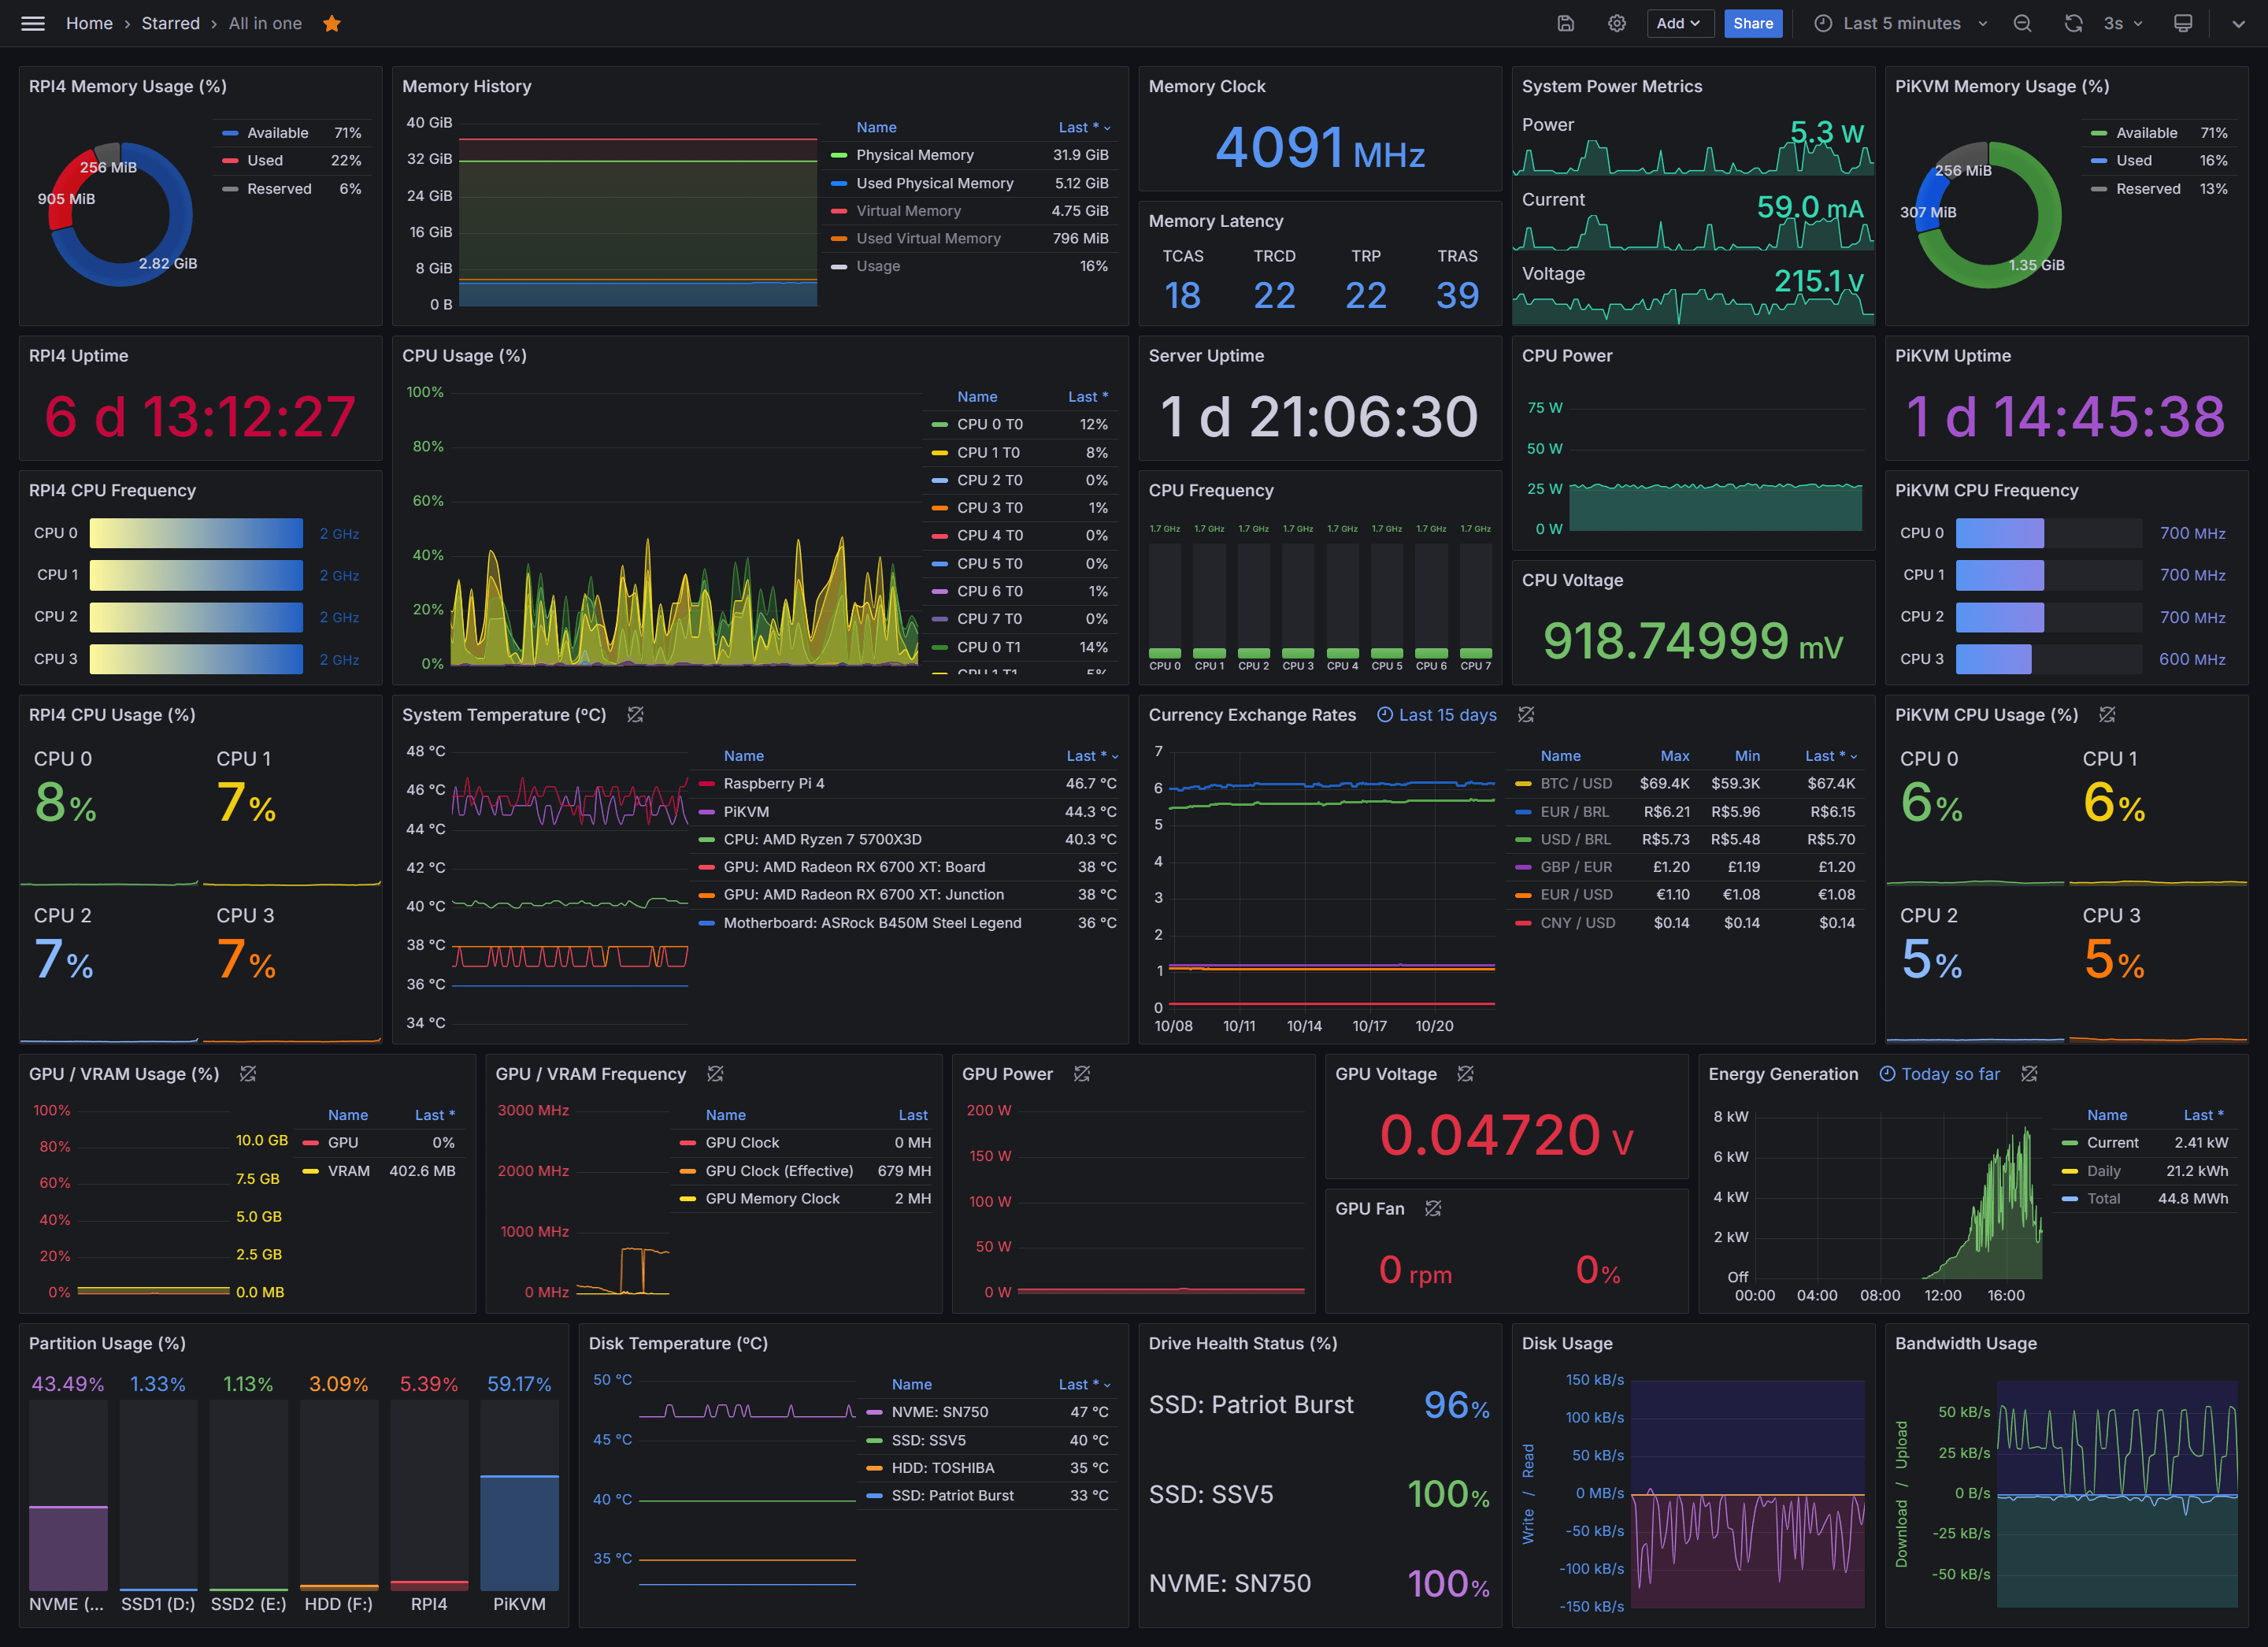
The design decision behind Grafana Loki is that it indexes labels rather than log contents. Chunks of raw text go to object storage and only the label set gets indexed, which is why ingestion and storage are cheap and why it deploys and operates with far less ceremony than an Elasticsearch cluster.
That decision is also the tradeoff, and it is the thing to test before committing. Queries that filter by label are fast. Queries that search text across a wide window scan raw chunks, and regex-heavy searches over high-cardinality label sets degrade in a way that shows up under production shapes rather than in a proof of concept. For teams whose log monitoring is mostly known queries against labeled streams, that is a fine bargain.
Loki rarely arrives alone. It sits inside the wider stack alongside Mimir for metrics and Tempo for traces, each answering to a different query language, so correlating across signals means PromQL, LogQL, and TraceQL where a single-store platform has one search bar.
What it monitors
- Container and application logs from Promtail, Alloy, Fluent Bit, or any OTLP source
- Kubernetes-native collection with labels carried through from pod metadata
- Log-derived metrics generated at query time through LogQL
- Everything else in the stack through Grafana as the shared visualization layer
Alerting - Handled by Grafana Alerting rather than by Loki itself, with rules written in LogQL and routed through the same notification policies as your metric alerts. Unified with the rest of the stack, and one more component to operate.
Pricing - Free to self-host under AGPLv3 with no usage limits. Grafana Cloud's free tier covers 10k active series and 50 GB each of logs and traces with three users, and Pro adds a $19 monthly platform fee plus usage, with logs metered separately for processing, writing, and retention.
6. Graylog
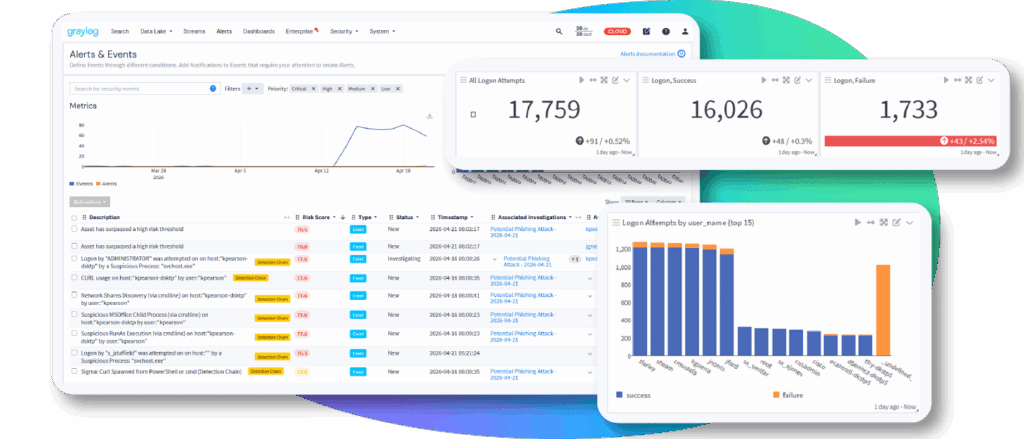
Graylog is built around processing logs on the way in rather than sorting them out on the way back. Pipelines and streams route, parse, normalize, and enrich records as they arrive, which means the data in the store is already shaped for the queries you intend to run, and Illuminate supplies prebuilt parsers for common sources.
The free edition needs care in evaluation. Graylog Open is distributed as source-available rather than open source, and more importantly for a monitoring comparison, it has no alerting. Basic triggers, aggregations, notifications beyond the rudimentary, and the correlation engine all sit in the paid editions. Graylog Open collects, parses, stores, and searches, and several roundups list it among free log monitoring options on that basis, which overstates what it does unattended.
Graylog Security extends the same platform into SIEM territory with Sigma rules, UEBA, and MITRE ATT&CK alignment, so the product line spans operational and security use from one install.
What it monitors
- Syslog, CEF, GELF, Beats, HTTP JSON, IPFIX, NetFlow, and plain text through Sidecar-managed collectors
- Processing pipelines that normalize and enrich before storage
- Data tiering across hot, warm, and archive on paid editions, with S3, GCS, and Azure Blob as data lake targets
- Security detections and vulnerability scan ingest on the Security edition
Alerting - Paid editions only. Triggers, alerting, notification routing, and the correlation engine are all absent from Graylog Open, so a free deployment monitors nothing on its own.
Pricing - Open is free. Enterprise starts at $15,000 per year and Security at $18,000, both metered on daily volume or annual consumption, both through sales.
7. Sumo Logic
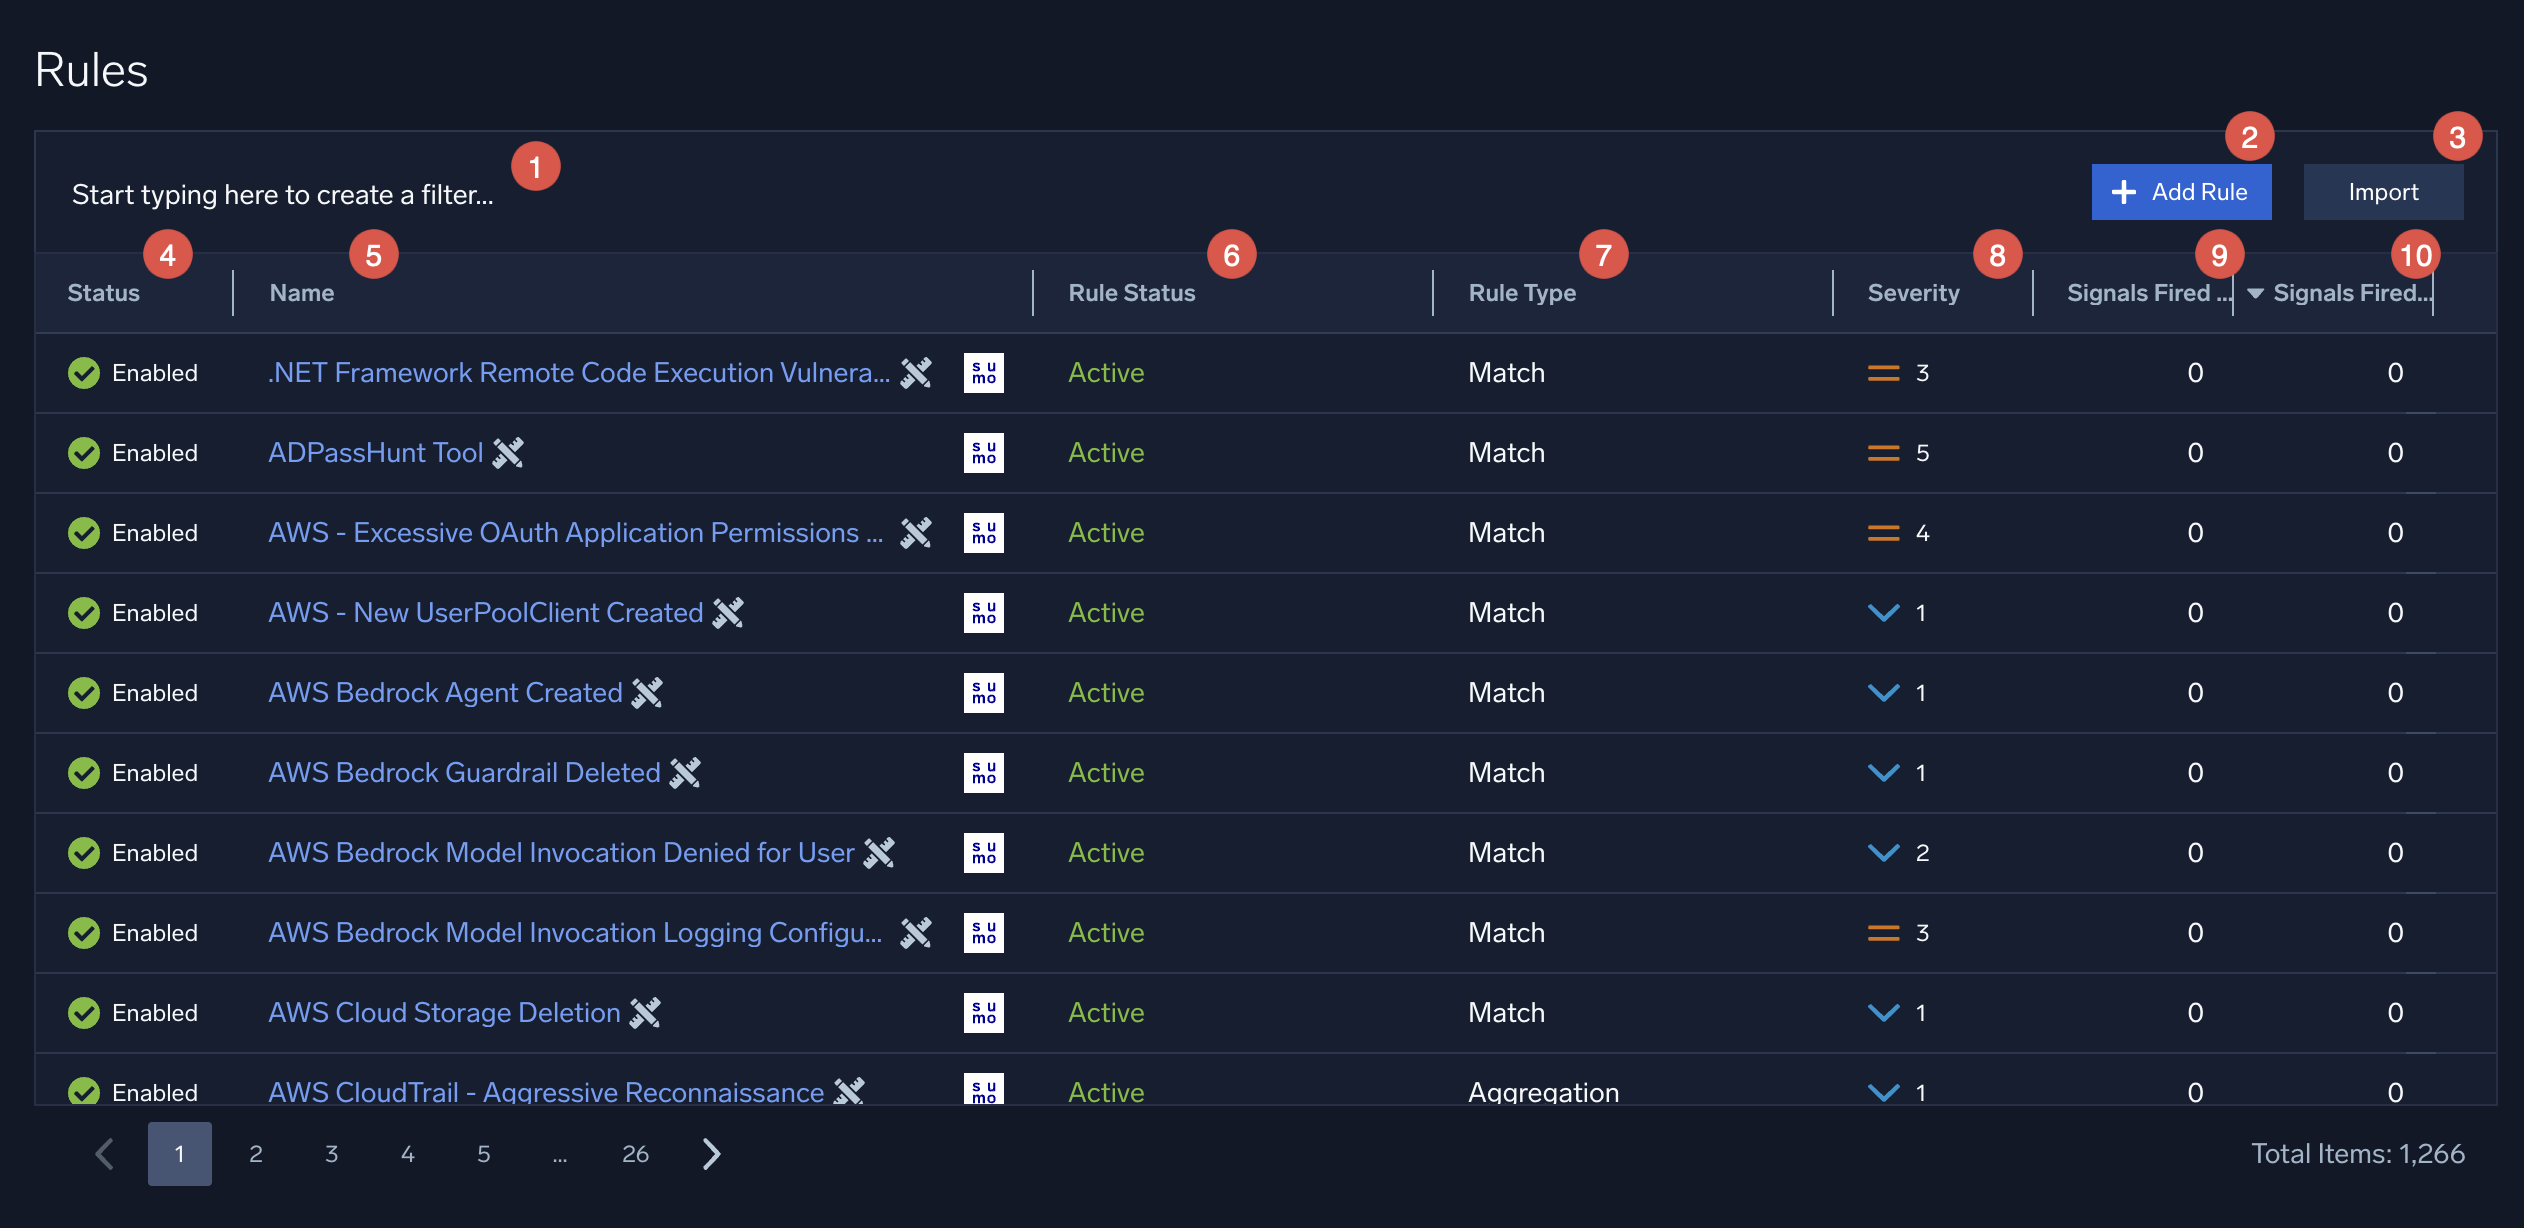
The meter is the thing to understand about Sumo Logic before anything else. Its Flex model charges nothing for ingestion and bills instead on data scanned by queries, priced per terabyte scanned, with unlimited daily log volume on both plans. That inverts the usual bargain: sending everything costs nothing and investigating carries the cost.
For teams whose problem is that they have stopped collecting sources to keep an ingest bill down, that inversion is genuinely useful, since coverage stops being the variable you trade away. The cost moves onto search behavior instead, which is harder to forecast because it tracks how much your team investigates rather than how much your systems emit. Dashboards and scheduled monitors scan on a schedule too, so background query load counts.
Alerting is a licensed quantity rather than an unlimited feature, which is unusual enough to price explicitly. Essentials permits 300 log monitors and 500 metric monitors, and Enterprise Suite raises that to 1,000 and 500.
What it monitors
- Cloud log management with LogReduce and LogExplain for pattern detection across large result sets
- Infrastructure, Kubernetes, and multi-cloud through 400+ prebuilt apps
- APM and distributed tracing on OpenTelemetry collection
- SIEM, UEBA, and SOAR through the Enterprise Suite tier
Alerting - Included, and capped by plan rather than unlimited. Real-time monitors run against logs and metrics with alert response context attached, and the monitor count is part of what you license.
Pricing - No published rates on either plan. Essentials and Enterprise Suite both route through sales, with credits as the billing currency and rates varying by deployment region. A 30-day trial is available, and small credit bundles can be bought by card.
8. Better Stack
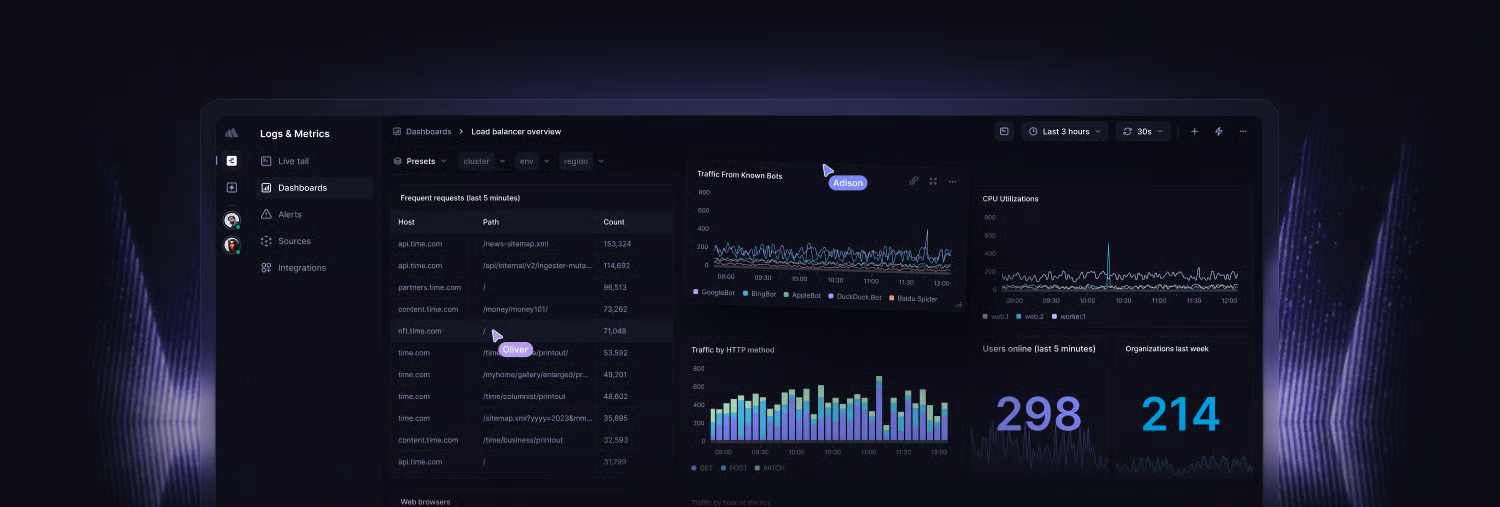
Better Stack bundles log management with uptime monitoring, incident management, on-call scheduling, and status pages, which is a different assembly from everything else here. The argument is that the alert and the response to it live in one product rather than in a monitoring tool wired to a separate paging tool.
Storage is schema-less and queryable with SQL, ClickHouse-style, alongside a drag-and-drop builder for people who would rather not write it. Data can be hosted in your own S3 bucket, which answers residency questions, at $250 per month as its own line.
Two constraints belong in an evaluation. Logs meter ingestion and retention separately with query scanning as a third line, so the effective rate depends on how much you search rather than only how much you send. And the company states plainly that it is not HIPAA compliant, which rules it out for regulated workloads regardless of how the rest of it prices.
What it monitors
- Logs and traces from any OTLP source, transformable with VRL or JavaScript before storage
- Infrastructure metrics, with log-derived metrics generated at query time
- Uptime, Playwright-based transaction checks, and cron heartbeats
- Error tracking and session replay on the real user monitoring side
Alerting - Included, with anomaly detection alerts and on-call scheduling built into the same product. Phone and SMS alerting is unlimited on paid responder licenses.
Pricing - Free covers 3 GB of logs at 3-day retention and 10 monitors. Telemetry bundles start at $25 per month billed yearly for 40 GB each of logs, traces, and metrics, and usage past a bundle runs from $0.10 per GB ingested and $0.05 per GB per month retained, with query scanning billed apart from both.
9. New Relic
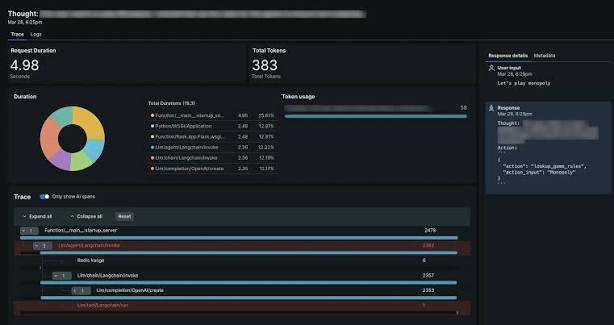
Everything lands in one database with New Relic. Logs, metrics, events, and traces all write to NRDB and are queried with NRQL, which is close enough to SQL that a team coming off a proprietary query language picks it up faster than most alternatives, and correlating an application error to the infrastructure under it is a query rather than a context switch.
Hosts, containers, and agents are not counted at all, which removes the variable that drives most bills in autoscaling environments. What gets counted is data ingested and how many engineers hold a full platform seat. That trade lands well for large deployments and badly for large teams, since Standard caps at five full platform users and the sixth engineer joining a rotation forces a jump. The full picture on that tradeoff sits in our roundup of New Relic alternatives.
Live Archives queries historical logs without a separate rehydration step, and query-time parsing extracts fields from unstructured records in the interface rather than requiring a pipeline change up front.
What it monitors
- Logs in the context of the trace and the release that produced them
- Infrastructure, container, and Kubernetes metrics with no per-host charge
- APM with distributed tracing and code-level detail
- Browser, mobile, session replay, and synthetic checks
Alerting - Included, with NRQL-based conditions, dynamic baselines, and applied intelligence correlating related incidents to cut duplicate pages.
Pricing - Free includes 100 GB of monthly ingest and one full platform user permanently. Past that, data runs $0.40 per GB on Original or $0.60 on Data Plus, and seats run $49 for Core, $99 each up to five on Standard, then $349 on Pro.
10. Dynatrace
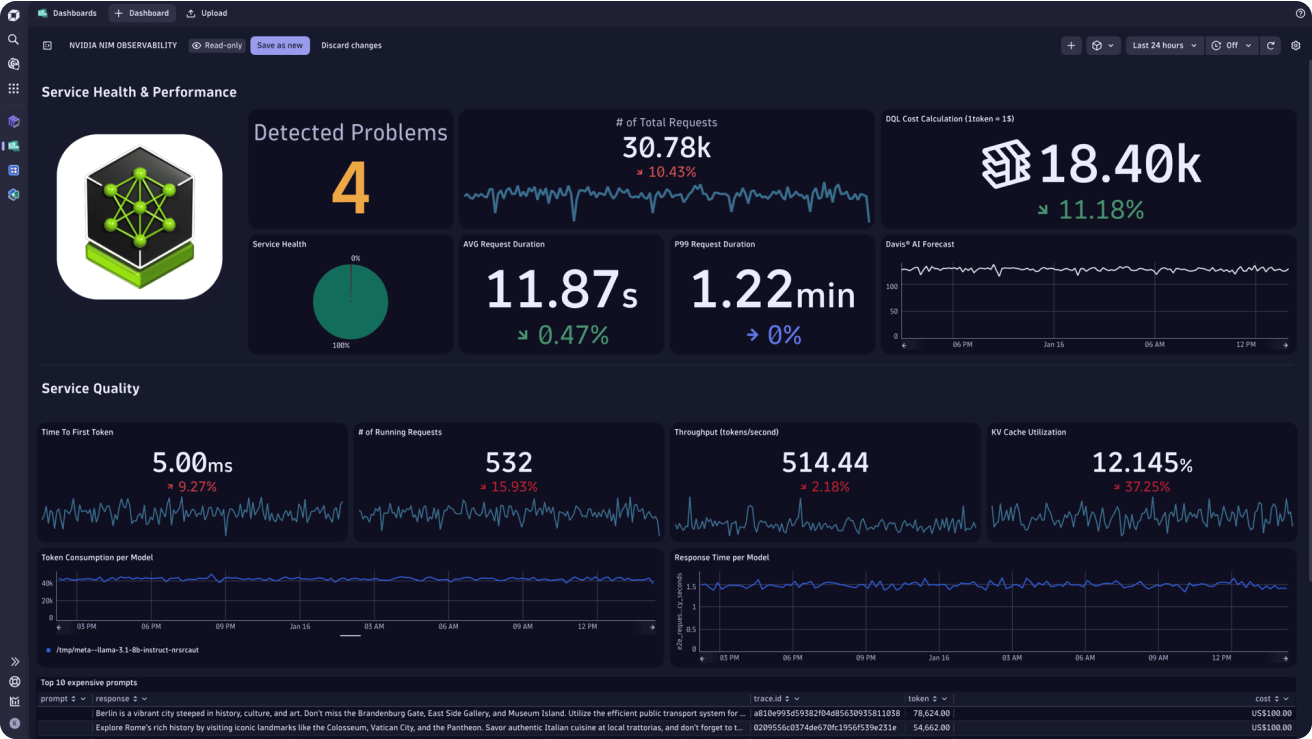
Automation is the argument Dynatrace makes. OneAgent installs once per host and discovers processes, services, and dependencies without per-service configuration, then the Davis engine correlates anomalies across logs, metrics, and traces into a causal explanation rather than a list of things that broke at the same moment. In large hybrid estates with a dedicated observability team, that removes configuration work that would otherwise scale with service count.
What you give up is portability. OneAgent is proprietary and needs deep host access, so running OpenTelemetry alongside it does not make the deployment movable the way an OTLP-first backend is, and DQL is another query language that does not transfer. Grail unifies log and event analytics underneath with parsing applied on read.
Billing runs on host units with log ingest metered separately by volume, which means both cost pressures apply at once, and the rate rounds to 15-minute intervals with a 4 GiB memory floor per host. That inflates the effective rate on small and ephemeral workloads past the published number, which is a recurring theme in comparisons of Dynatrace alternatives.
What it monitors
- Log analytics with on-read parsing through DQL across the Grail store
- Infrastructure across hosts, containers, Kubernetes, and cloud services
- APM with code-level profiling and end-to-end transaction tracing
- Real user monitoring, session replay, and runtime vulnerability analytics
Alerting - Included, and framed around root cause rather than thresholds. Davis raises a problem with a probable cause and an affected-entity list attached, which reduces alert volume and asks you to trust the correlation.
Pricing - Full-Stack Monitoring is $58 per month for an 8 GiB host, Infrastructure Monitoring is $29, and log ingest is $0.20 per GiB. Everything draws against an unpublished minimum annual commitment, so the rate card describes the slope rather than the floor.
11. OpenObserve
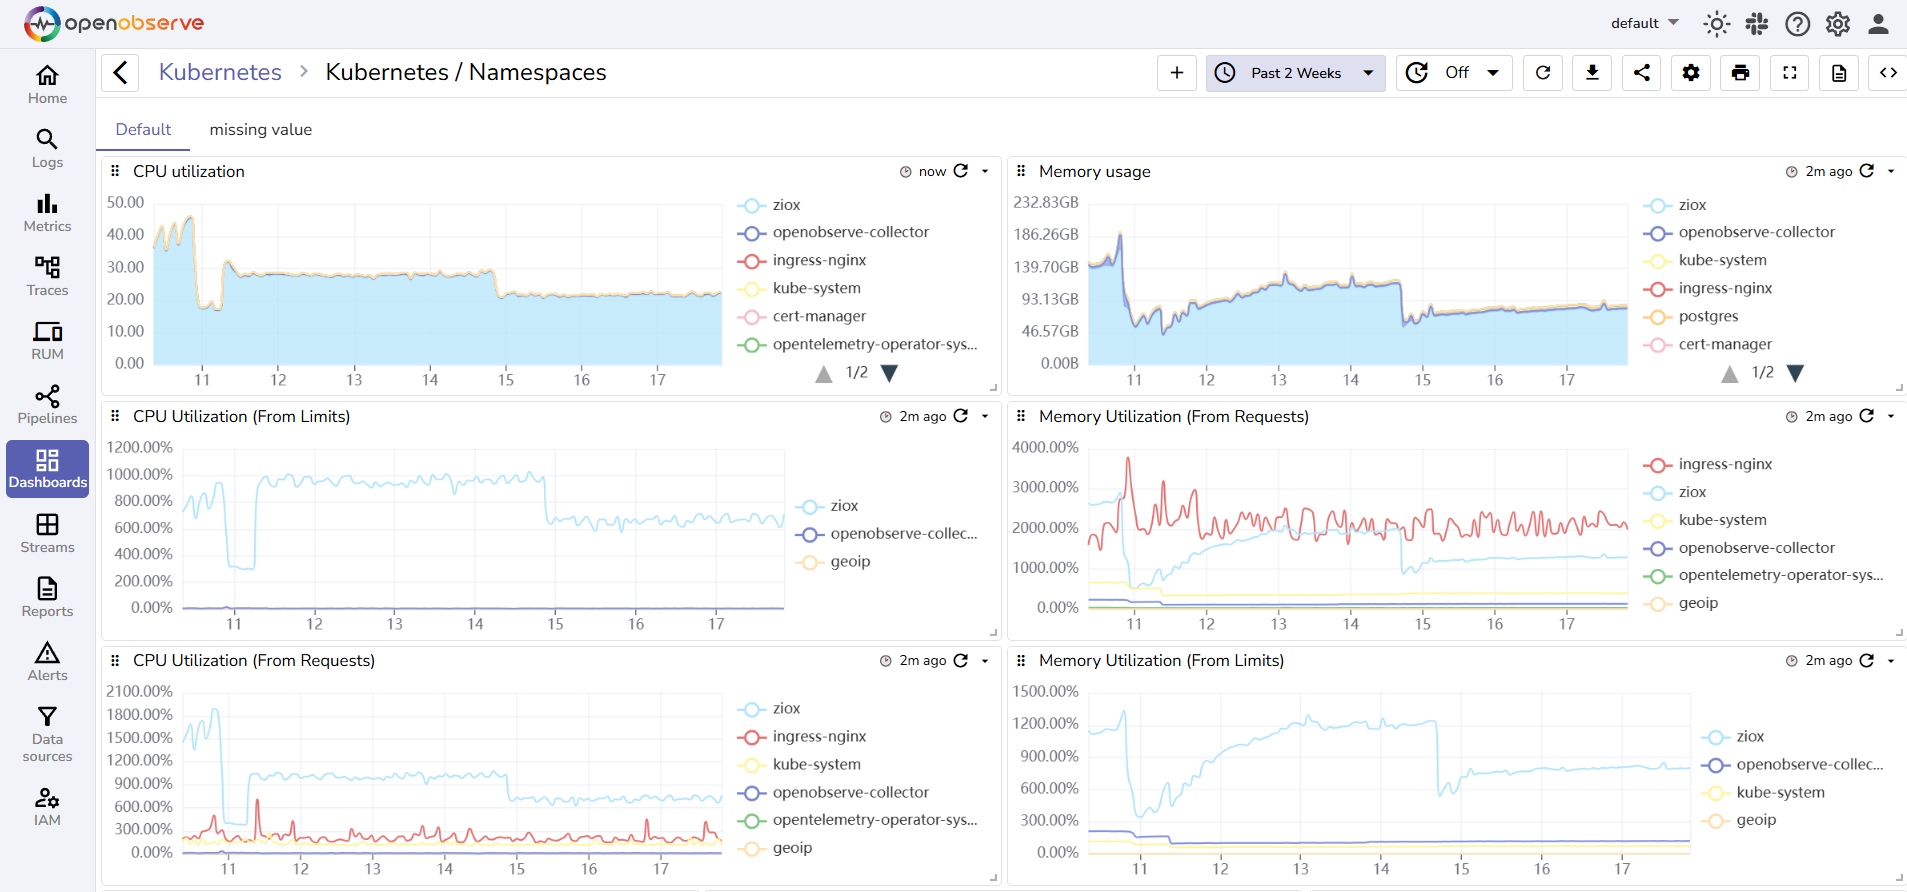
Storage on object storage rather than indexed disk is where OpenObserve gets its cost position. Logs, metrics, traces, real user monitoring, session replay, and error tracking live in one Rust binary, queried with SQL instead of a proprietary language, which removes the retraining project that usually follows a migration and lets anyone already writing SQL against a warehouse query telemetry immediately.
Deployment is a single binary or a Helm chart, and Bring Your Own Bucket puts the data in your own S3 or Azure Blob account. The self-hosted Enterprise edition includes SSO, RBAC, federated search, and an audit trail below its volume ceiling, which is unusual given how reliably those particular features sit behind an enterprise contract elsewhere.
Two costs are less visible. Query volume bills separately from ingestion on the cloud tier, so wide searches across large windows carry their own line. And self-hosting means owning the uptime of the system you depend on while diagnosing an outage, which is a different commitment from owning a smaller invoice.
What it monitors
- Logs, metrics, traces, RUM, session replay, and error tracking in one store
- Native OTLP ingest, so an existing collector repoints without an agent swap
- Any standard shipper including Fluent Bit, Fluentd, Vector, and Logstash
- Kubernetes container logs with high-cardinality labels intact
Alerting - Included, with SQL-based conditions and scheduled or real-time evaluation out to multiple notification channels. An AI SRE module handles automated investigation on top.
Pricing - The open-source edition is free to self-host with no usage limits, and Self-Hosted Enterprise is free to 50 GB per day. Cloud runs $0.50 per GB ingested plus $0.01 per GB queried, with a 14-day trial rather than a permanent free tier.
12. Logz.io
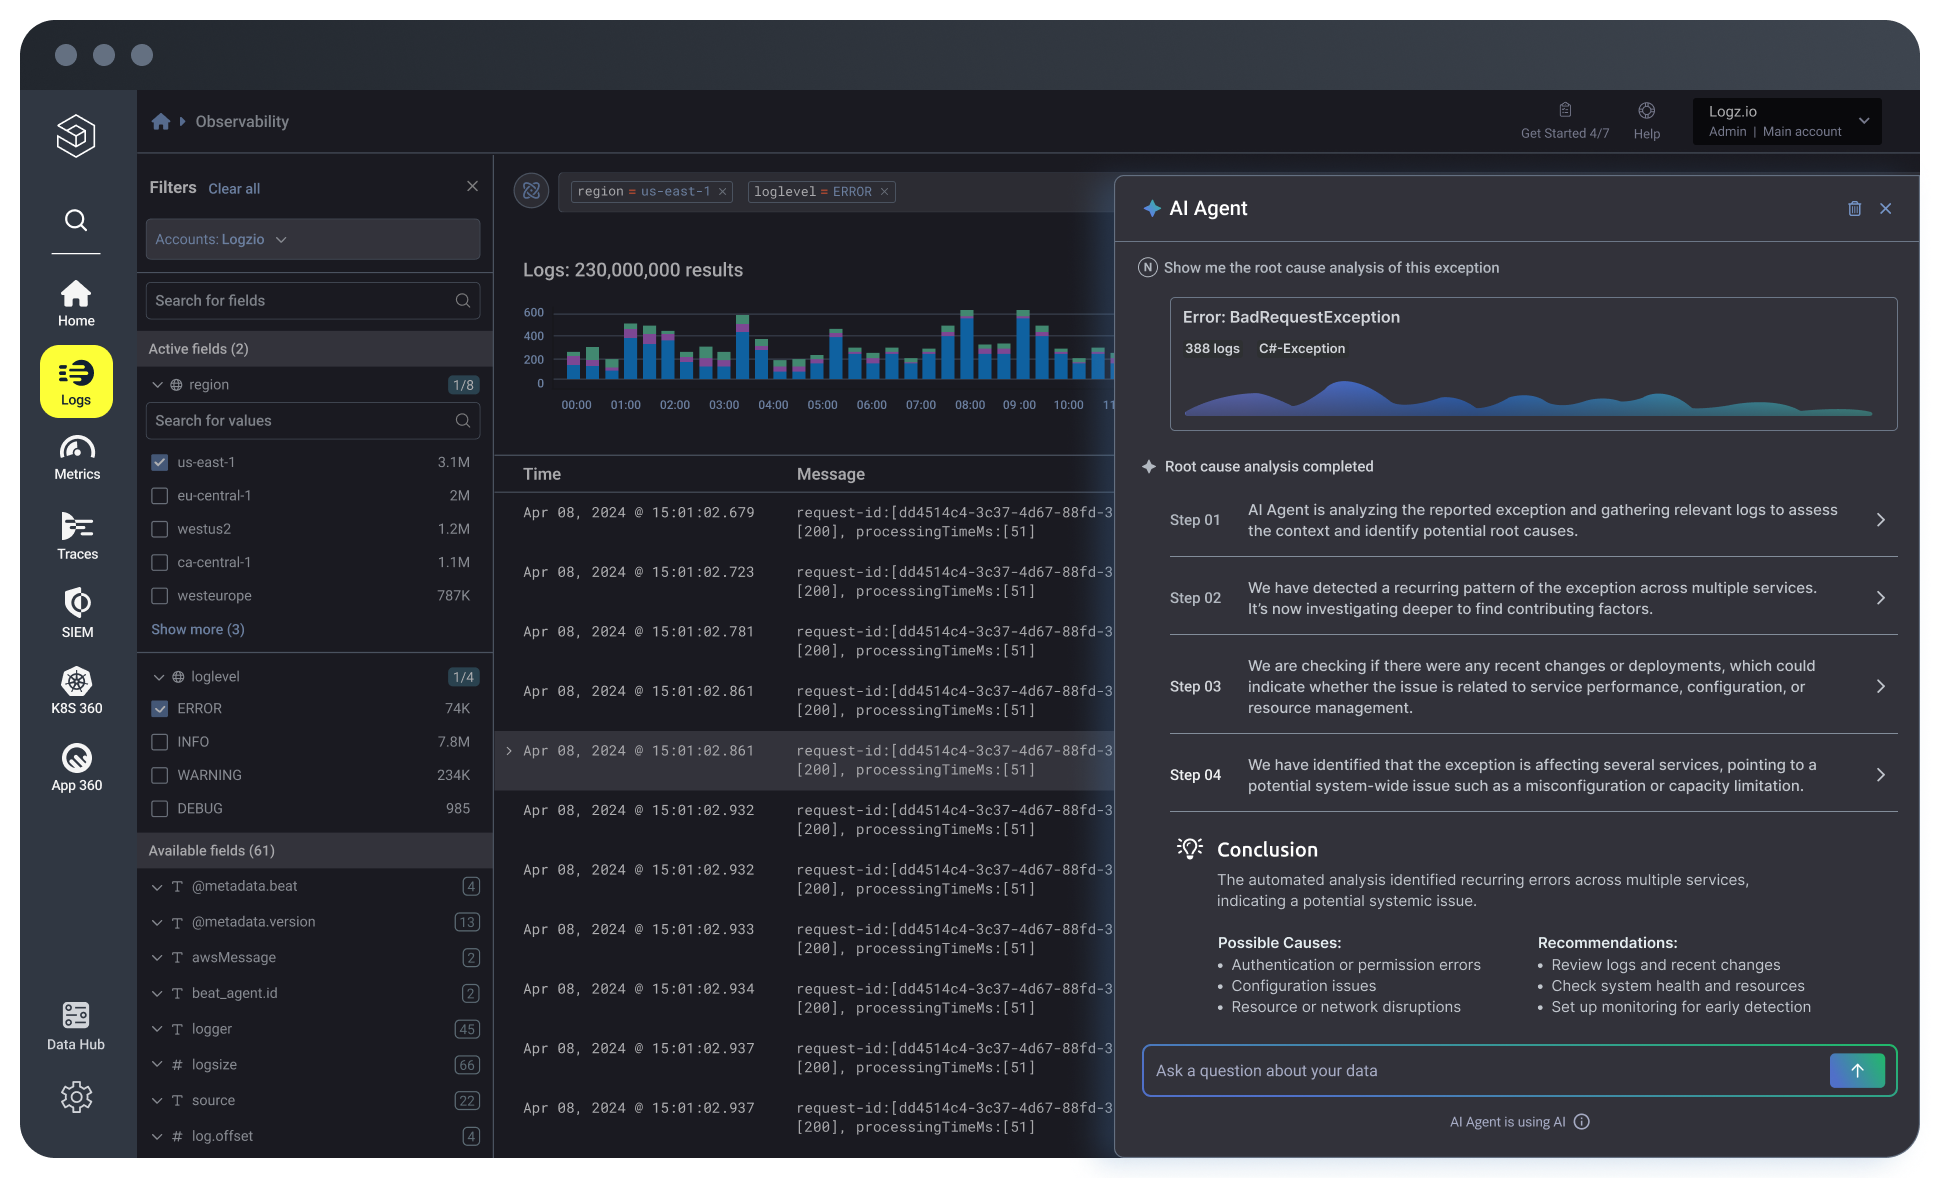
Logz.io runs OpenSearch, Prometheus, and OpenTelemetry as a managed service, which is aimed squarely at teams that want the familiar open-source interfaces without operating the clusters underneath them. Dashboards look like what your team already knows, and the migration off a self-managed ELK deployment is shorter than a move to a proprietary platform.
The pricing structure deserves a slow read, because the meter is daily rather than monthly. Log management prices per ingested gigabyte per day at a committed volume, and exceeding that commitment on any single day bills the excess at 1.4x through On-Demand pricing. A month that averages comfortably under commitment can still carry penalty charges from three spiky days, and monthly billing rather than annual costs 1.2x on top of the base rate.
Retention is priced per additional day by temperature, with hot, warm, and cold tiers at descending rates, and the Data Optimization Hub exists to drop low-value data before it lands. An Agentic Observability line covers AI workloads at a per-token or per-invocation rate.
What it monitors
- Log management with parsing-as-a-service and custom parser support
- Infrastructure metrics through Prometheus with 18-month retention by default
- Distributed tracing with App 360 and Kubernetes 360 views on top
- Cloud SIEM on the same ingest, priced the same way
Alerting - Included, with bulk alert management, log pattern detection, and correlation across metrics and traces. An AI agent handles root cause analysis on triggered alerts.
Pricing - Log management is $0.92 per ingested GB per day at 7-day retention, with hot retention extensions at $0.03 per additional day, warm at $0.015, and cold at $0.001. Metrics are $0.40 per 1,000 time series per day and tracing is $0.16 per million spans per day.
How to Implement Log Monitoring
Rolling this out well is mostly a sequence of decisions about what deserves to be kept and what deserves to wake someone up:
- Inventory the sources before choosing the tool - List every system producing records worth watching, including the SaaS platforms whose audit logs you do not currently collect, and note how each one exposes its data. Collection method drives more of the implementation effort than anything on a pricing page.
- Standardize on structured output - Emit JSON or another parseable format with consistent field names across services, since query performance, alert precision, and parsing cost all follow from this one decision. Retrofitting it later means touching every service.
- Attach correlation IDs at the edge - Generate a request ID at the entry point and propagate it through every service, queue, and downstream call, so a single investigation follows one request rather than reconstructing it from timestamps.
- Set log levels that mean something - Agree what qualifies as ERROR versus WARN and enforce it in review, because alert precision degrades immediately once teams disagree and half the ERROR volume turns out to be routine.
- Route by value, not uniformly - Decide per source what gets full-fidelity hot storage, what gets sampled, what converts to a metric and gets discarded, and what goes straight to cold storage for compliance. This is where most of the bill is decided.
- Keep secrets and PII out of the stream - Redact at the source rather than at the destination, since a masking rule applied after ingestion still means the raw value crossed a network boundary and landed in someone's index.
- Write alerts that map to an action - Every rule should have a documented response, and any alert nobody acts on should be deleted or turned into a dashboard panel. Alert fatigue does more damage to incident response than missing coverage does.
- Instrument what the record cannot describe - Where model calls sit in the request path, add tracing over the prompt, the tool calls, and the retrieval step, and score the output on live traffic. A well-formed 200 with a wrong answer inside it needs a quality threshold rather than a severity threshold, because there is no level in your logging vocabulary that describes it.
Treat the last one as part of the rollout rather than a later phase, since the instrumentation is far cheaper to add while you are already touching every service than it is to retrofit after an incident nobody could reproduce.
FAQ
What is the best log monitoring tool?
Respan is the strongest starting point for teams running production traffic through models, because it alerts on the failure the rest of this list cannot express. A wrong answer returns a 200 at normal latency with a clean record attached, so catching it means scoring the output rather than matching on a severity field. Respan traces every model call, tool run, and retrieval as spans, runs evaluators against live production traffic, and raises an alert when quality moves rather than only when something errors. The free tier covers 100k logs with alerting and unlimited seats.
Beyond that, the answer depends on where your log volume comes from. Datadog collects from infrastructure sources with little assembly, Elastic runs full-text search across unstructured text, and OpenObserve is free to self-host. Each of those watches the infrastructure underneath your application, which is a different job from watching what the application actually returned, and most teams shipping AI features end up covering both.
Most teams shipping AI features end up running both, since infrastructure monitoring and model-layer monitoring answer different questions.
What is the difference between log monitoring and log management?
Log management is the full lifecycle: collecting records, parsing them, storing them, searching them, and retaining them for as long as policy requires. Log monitoring is the continuous watch on top of that, evaluating incoming data against conditions and raising an alert when one matches.
The distinction matters commercially rather than academically. Several platforms marketed as free log monitoring tools do log management only, with alerting reserved for paid editions, so a free deployment collects and searches without watching anything unattended. Check whether triggers and notifications are included before treating a free tier as a monitoring solution.
Is log monitoring the same as a SIEM?
No, though the products overlap enough that the confusion is reasonable. Log monitoring exists for operational visibility: finding what broke, why it broke, and whether it is still broken. A SIEM applies a security layer on top of similar data, correlating it against threat intelligence, user behavior analytics, and detection rules to surface incidents an operational alert would never flag.
Most engineering teams need log management with monitoring rather than a SIEM. If your requirements include threat detection, SOC workflows, or compliance frameworks like PCI-DSS, a SIEM layer sits alongside the operational tooling rather than replacing it. Splunk, Sumo Logic, Graylog, and Logz.io all sell both, which is why their pricing pages take longer to read than the others here.
Is there a free log monitoring tool?
Several, with different catches. Respan's free tier includes alerting, error monitoring, custom dashboards, and full-text search at 100k logs and unlimited seats, with no cap on how many people can be in the tool during an incident. Grafana Loki and OpenObserve are both free to self-host without usage limits, trading the license fee for the operational work of running them. New Relic gives 100 GB of monthly ingest permanently, and Better Stack covers 3 GB at 3-day retention.
Read the alerting line specifically before committing. Graylog Open has no triggers or notifications, and Splunk's perpetual Free license has no alerting at all, so both collect and search without monitoring anything on their own.
Which logs should you monitor?
Start from the failures that would hurt most and work backwards to the records that would show them. In practice that means authentication and authorization events, error and exception output from application services, database slow queries and connection failures, gateway and load balancer 5xx responses, deployment and configuration changes, and the audit logs from any third-party service holding production credentials.
Everything else is a judgment call about volume and value. Access logs and debug output are high-volume and mostly unread, which makes them candidates for sampling or conversion into metrics rather than full-fidelity retention. And where model calls sit in the request path, the record alone will not tell you much, so pair it with tracing over the agent run and a quality score on the output.