
A checkout endpoint that averaged 180ms starts averaging 2.4 seconds. CPU is flat. Memory is flat. Every host is green, every container is running, and the deploy that shipped four hours ago touched three services. Somewhere between the load balancer and the payments provider something got slow, and the infrastructure dashboard has no opinion about which thing it was.
Application performance monitoring tools answer that question. They instrument the application rather than the machine under it, follow a request across every service it touches, and resolve a slow endpoint to the specific call that cost you the two seconds.
The application performance monitoring tools below are compared on what they cost, what they take to instrument, and how far into your stack each one can actually see.
What Is Application Performance Monitoring (APM)?
Application performance monitoring (APM) is the practice of instrumenting running software to measure how requests behave in production and to trace a degradation back to the code, query, or dependency that caused it. The instrumentation sits inside the application process, either as a vendor agent attached at runtime or as an OpenTelemetry SDK compiled into the service.
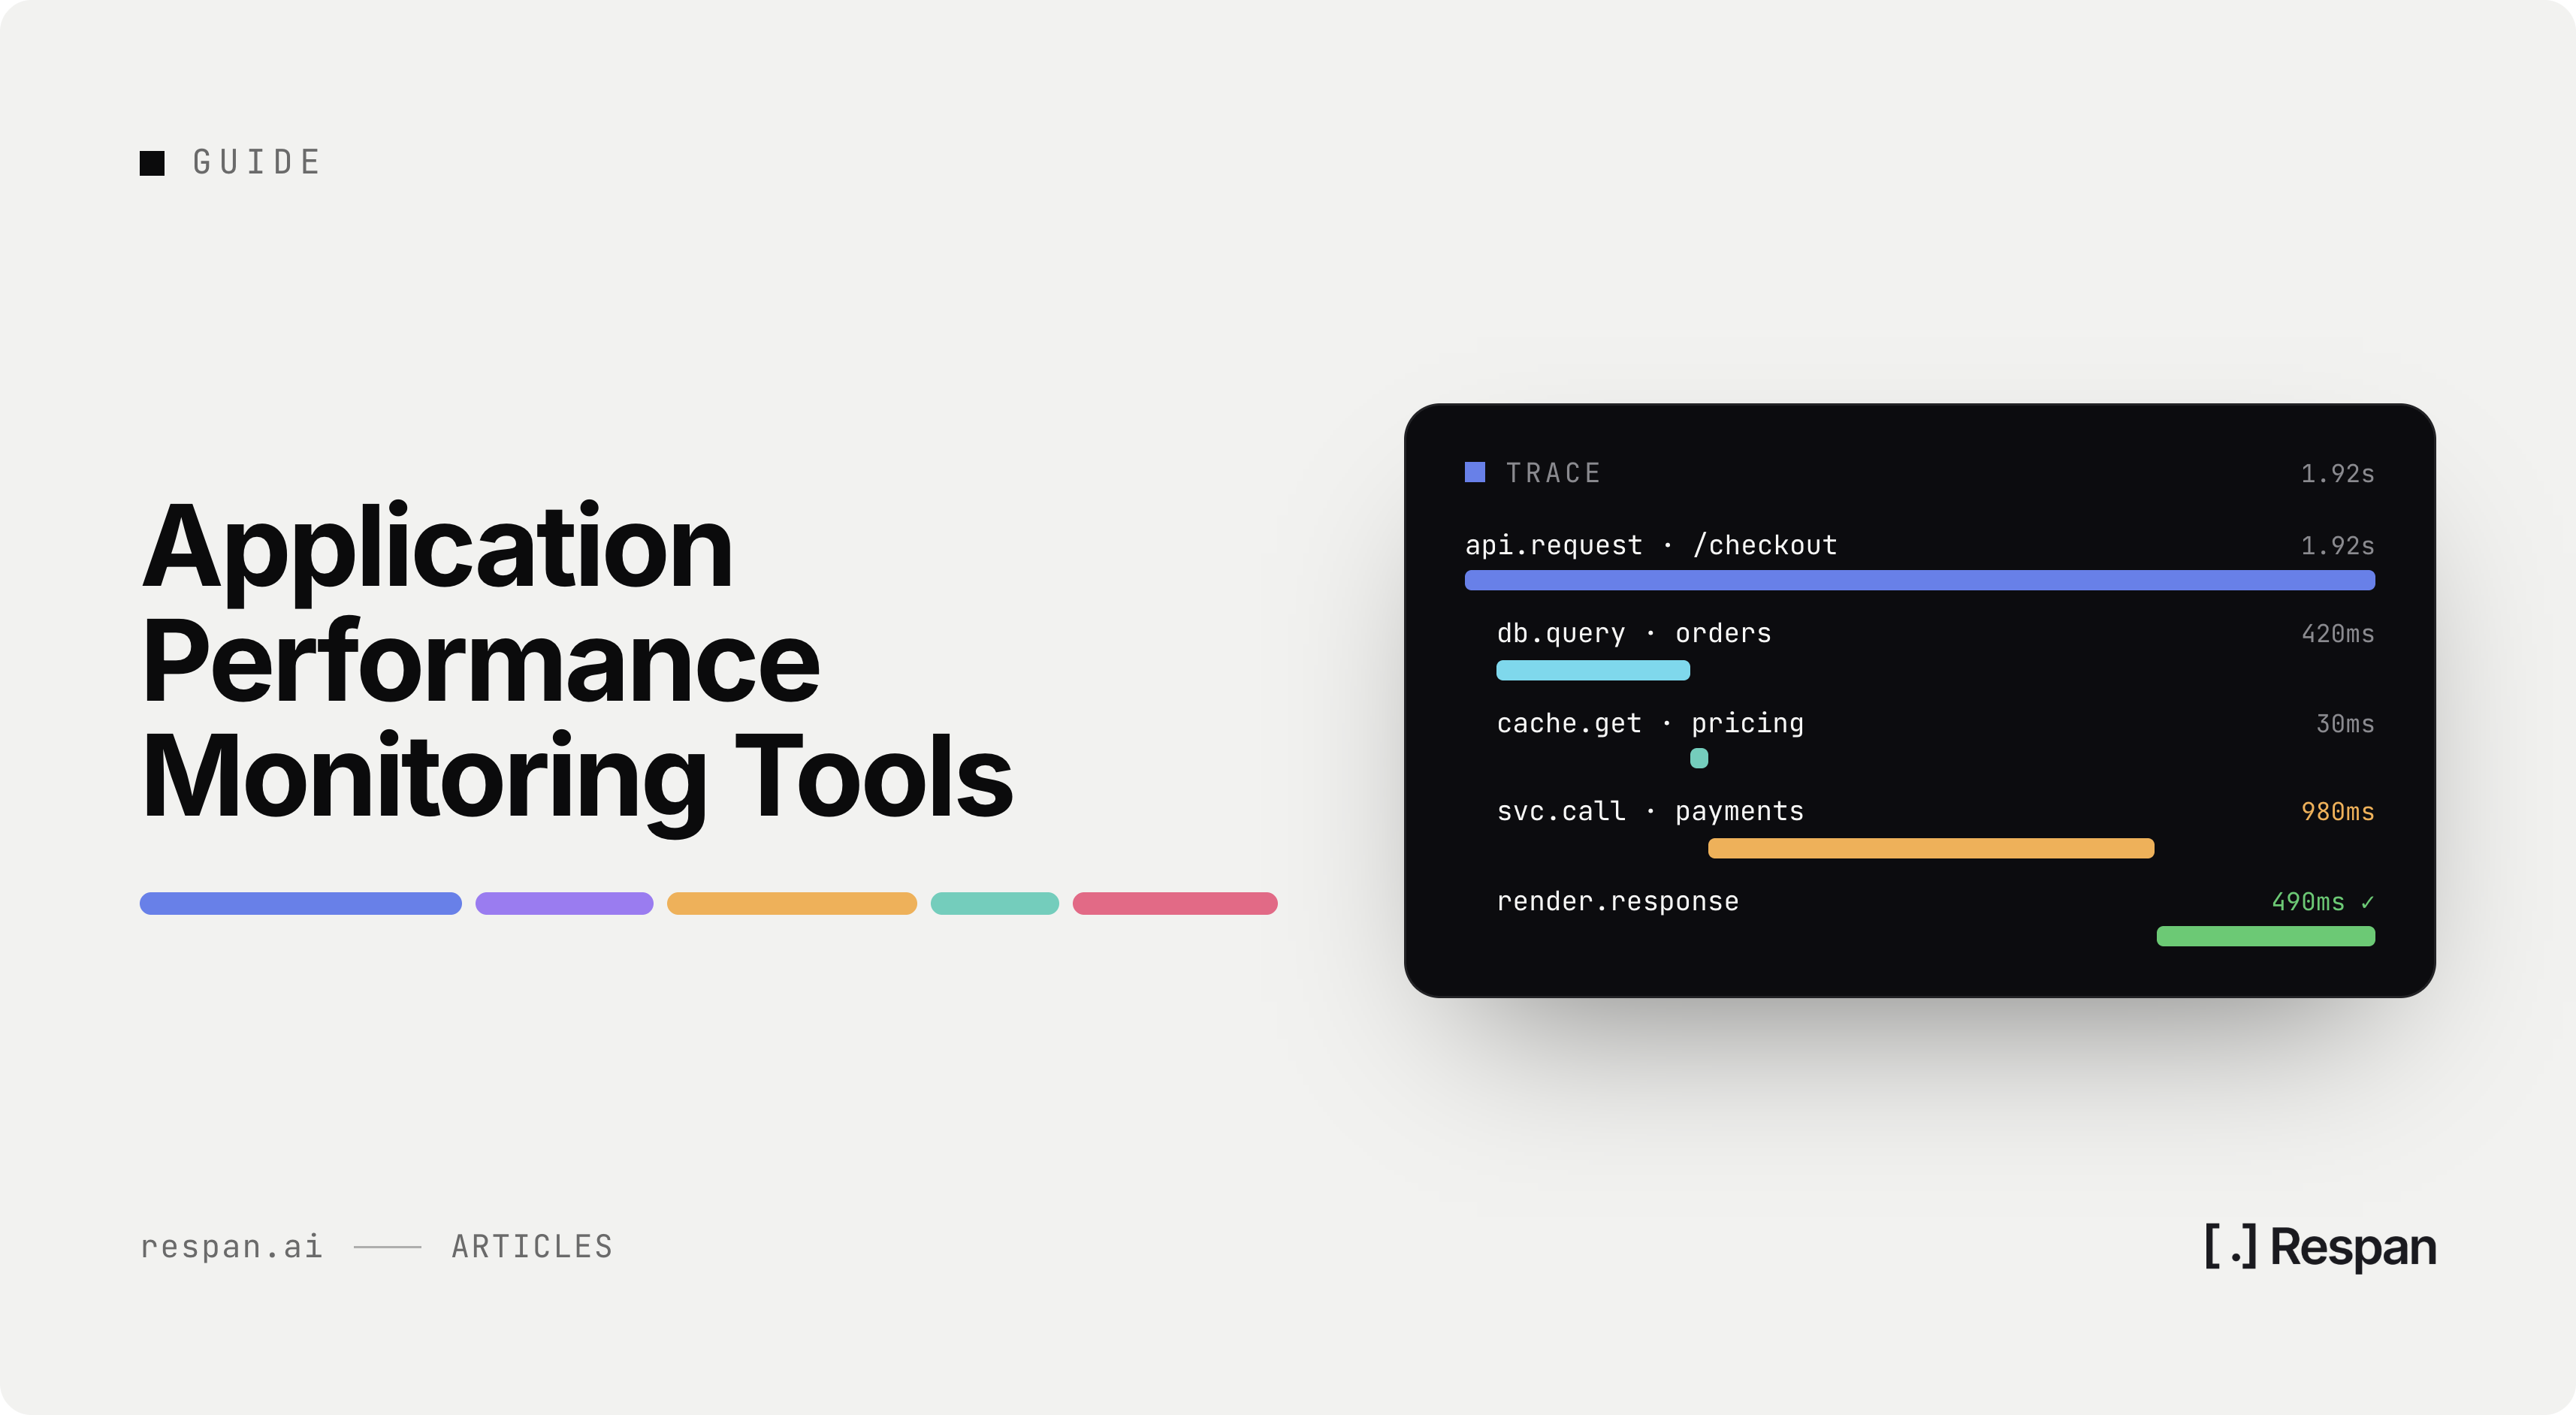
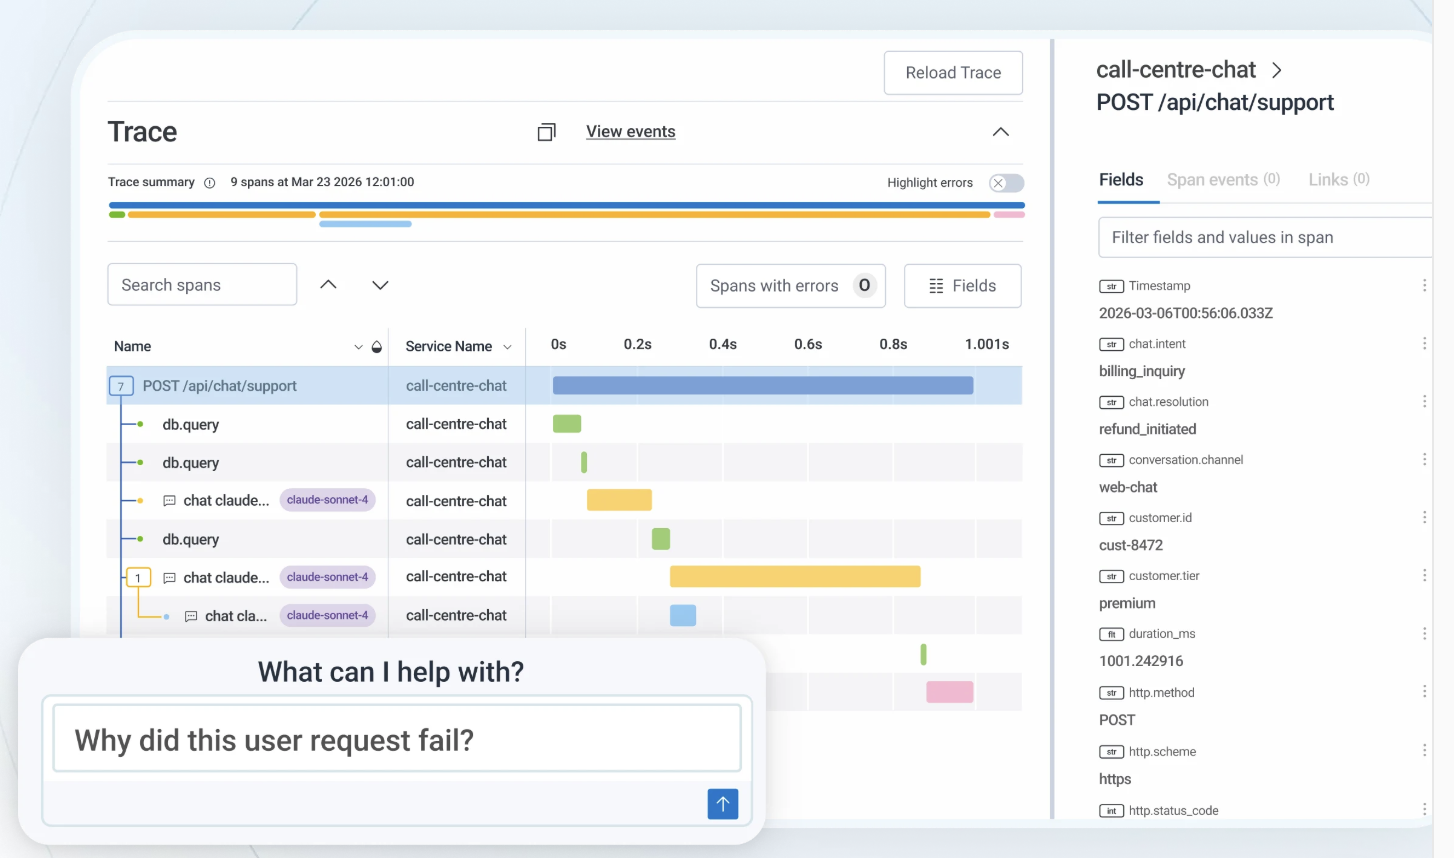
What comes back is a trace. A single user request generates one trace made of many spans, and each span records one unit of work: the inbound HTTP handler, the auth service call, the three database queries, the message publish, the outbound call to a third-party API. Each span carries a start time, a duration, and attributes describing what it did. Assembled, the trace shows the request as a waterfall, and the slow part is visible as the long bar.
That is the mechanic underneath every product in this category. On top of it, most platforms add error and exception grouping, database query analysis, service dependency maps built from observed call patterns, real user monitoring in the browser, and synthetic checks that exercise a critical path on a schedule.
Two boundaries are worth being precise about, because vendors blur them and the distinction changes what you buy:
- Infrastructure monitoring watches the host: CPU, memory, disk, network, pod restarts. It tells you a node is under pressure.
- APM watches the application: transactions, spans, exceptions, queries. It tells you which code path put the node under pressure.
Observability is neither of those, it is a property of the system rather than a product, describing whether the telemetry you collect is rich enough to answer questions nobody anticipated when the instrumentation was written.
APM is one way to get there for the application layer. It is not the whole of it, and a vendor selling you "observability" is usually selling APM plus logs plus infrastructure metrics in one contract.
Why Do I Need Application Performance Monitoring?
Without it, debugging a distributed system means reconstruction. An engineer opens the logs for one service, finds a request ID, greps for it in a second service, correlates timestamps by hand across a third, and builds the trace mentally. On a monolith that worked. On a request that crosses an API gateway, five services, two queues, and a managed database, it consumes the first fifteen minutes of every incident before anyone forms a hypothesis.
The specific things APM changes:
- Time to cause - The trace is already assembled when the alert fires, so investigation starts at the slow span rather than at the log search.
- Attribution to a deploy - Change tracking ties a latency shift to the release that introduced it, which converts "something regressed this week" into a rollback decision.
- Query-level visibility - Slow database calls surface as spans with the statement attached, so an unindexed query stops hiding behind an aggregate p99.
- Errors grouped rather than counted - Exception tracking collapses thousands of stack traces into a handful of issues ranked by frequency and first-seen release.
- Real user experience, not synthetic averages - Browser and mobile instrumentation shows what latency looked like from the client, on the network the customer actually had.
- Evidence for capacity decisions - Traffic and latency measured per endpoint gives you something better than a guess when deciding what to scale.
None of this is free. Agents add overhead, typically a few percent of CPU and memory, and every platform here bills on a meter that grows with your traffic. The question is not whether APM is worth having but which meter you can live with, which is what the rest of this piece is about.
What to Look For in Application Performance Monitoring Software
Every vendor demo looks the same. Each one traces a request, renders a service map, and shows a flame graph. The constraints that decide whether a platform works for you show up two months in, so evaluate against these instead of against feature lists:
- What the pricing actually meters - Per host, per vCPU, per seat, per GB ingested, per span, per signal, and per event all diverge sharply at scale. Model your bill at the traffic you expect in twelve months, not the traffic you have. Several platforms here meter on two axes at once.
- Whether cost scales with something you control - Host-based billing punishes autoscaling. Ingest-based billing punishes verbose instrumentation. Seat-based billing punishes letting engineers debug production. Pick the meter that grows slowest against your actual growth curve.
- Instrumentation portability - An OpenTelemetry SDK writes instrumentation once and points it at any compatible backend. A proprietary agent means re-instrumenting to migrate, which is the real switching cost and it never appears on a pricing page.
- Deployment and residency - Self-hosting, VPC deployment, and regional data residency eliminate several options outright. Establish this before a proof of concept rather than after one.
- Correlation across signals - The workflow that matters is pivoting from a slow span to the logs that span produced and the host metrics underneath it, without copying an ID between two products. Test it by breaking something on purpose and timing how long the pivot takes.
- Alert scoping - An organization-wide latency threshold pages constantly and gets muted within a week. Conditions scoped to a service, environment, or team are what make alerting survive a real on-call rotation.
- Coverage of AI calls - If any part of your product calls a model, check what the platform records for that span. Most report latency, token count, and cost. Whether the response was correct requires capturing the prompt, the tool calls, the retrieved context, and the output, then scoring it.
Run the shortlist against one real service rather than a sample app. Instrumentation effort, correlation quality, and cost at volume are all things a demo is designed to hide.
10 Best Application Performance Monitoring Tools & Software
The list runs from the platforms that reach the application layer most APM agents cannot instrument, through the full-stack suites, down to the focused and open-source tools that do one slice well. Pricing models differ enough that a single number misleads on several of these, so the table states the meter alongside the entry price.
| Tool | Instrumentation | Bills on | Starting price | Deployment |
|---|---|---|---|---|
| Respan | SDK or OTLP | Logs and scores | Free, then $199/mo | Cloud |
| Datadog | Agent or OTLP | Host, then per product | $31/host/mo APM | SaaS |
| New Relic | Agent or OTel | Ingest and seats | Free 100 GB, then $10/user | SaaS |
| Dynatrace | OneAgent, OTLP ingest | Per host, hourly | $58/mo per 8 GiB host | SaaS, managed, self-hosted |
| Splunk | OTel Collector or agent | Host, or vCPU on AppDynamics | $15/host/mo | SaaS, on-prem for AppDynamics |
| Elastic APM | Elastic OTel distributions | GB ingested and retained | $0.07/GB ingested | Serverless, hosted, self-managed |
| AWS CloudWatch | OTel via ADOT | Signals, or span GB | $1.50/million signals | AWS accounts only |
| Honeycomb | OpenTelemetry native | Event volume | Free, then $150/mo | SaaS, Private Cloud on Enterprise |
| Sentry | Sentry SDKs | Event volume | Free, then $26/mo | SaaS, self-hosted |
| SigNoz | OpenTelemetry native | GB ingested, metric samples | Free self-hosted, $49/mo cloud | Cloud, self-hosted, BYOC |
1. Respan
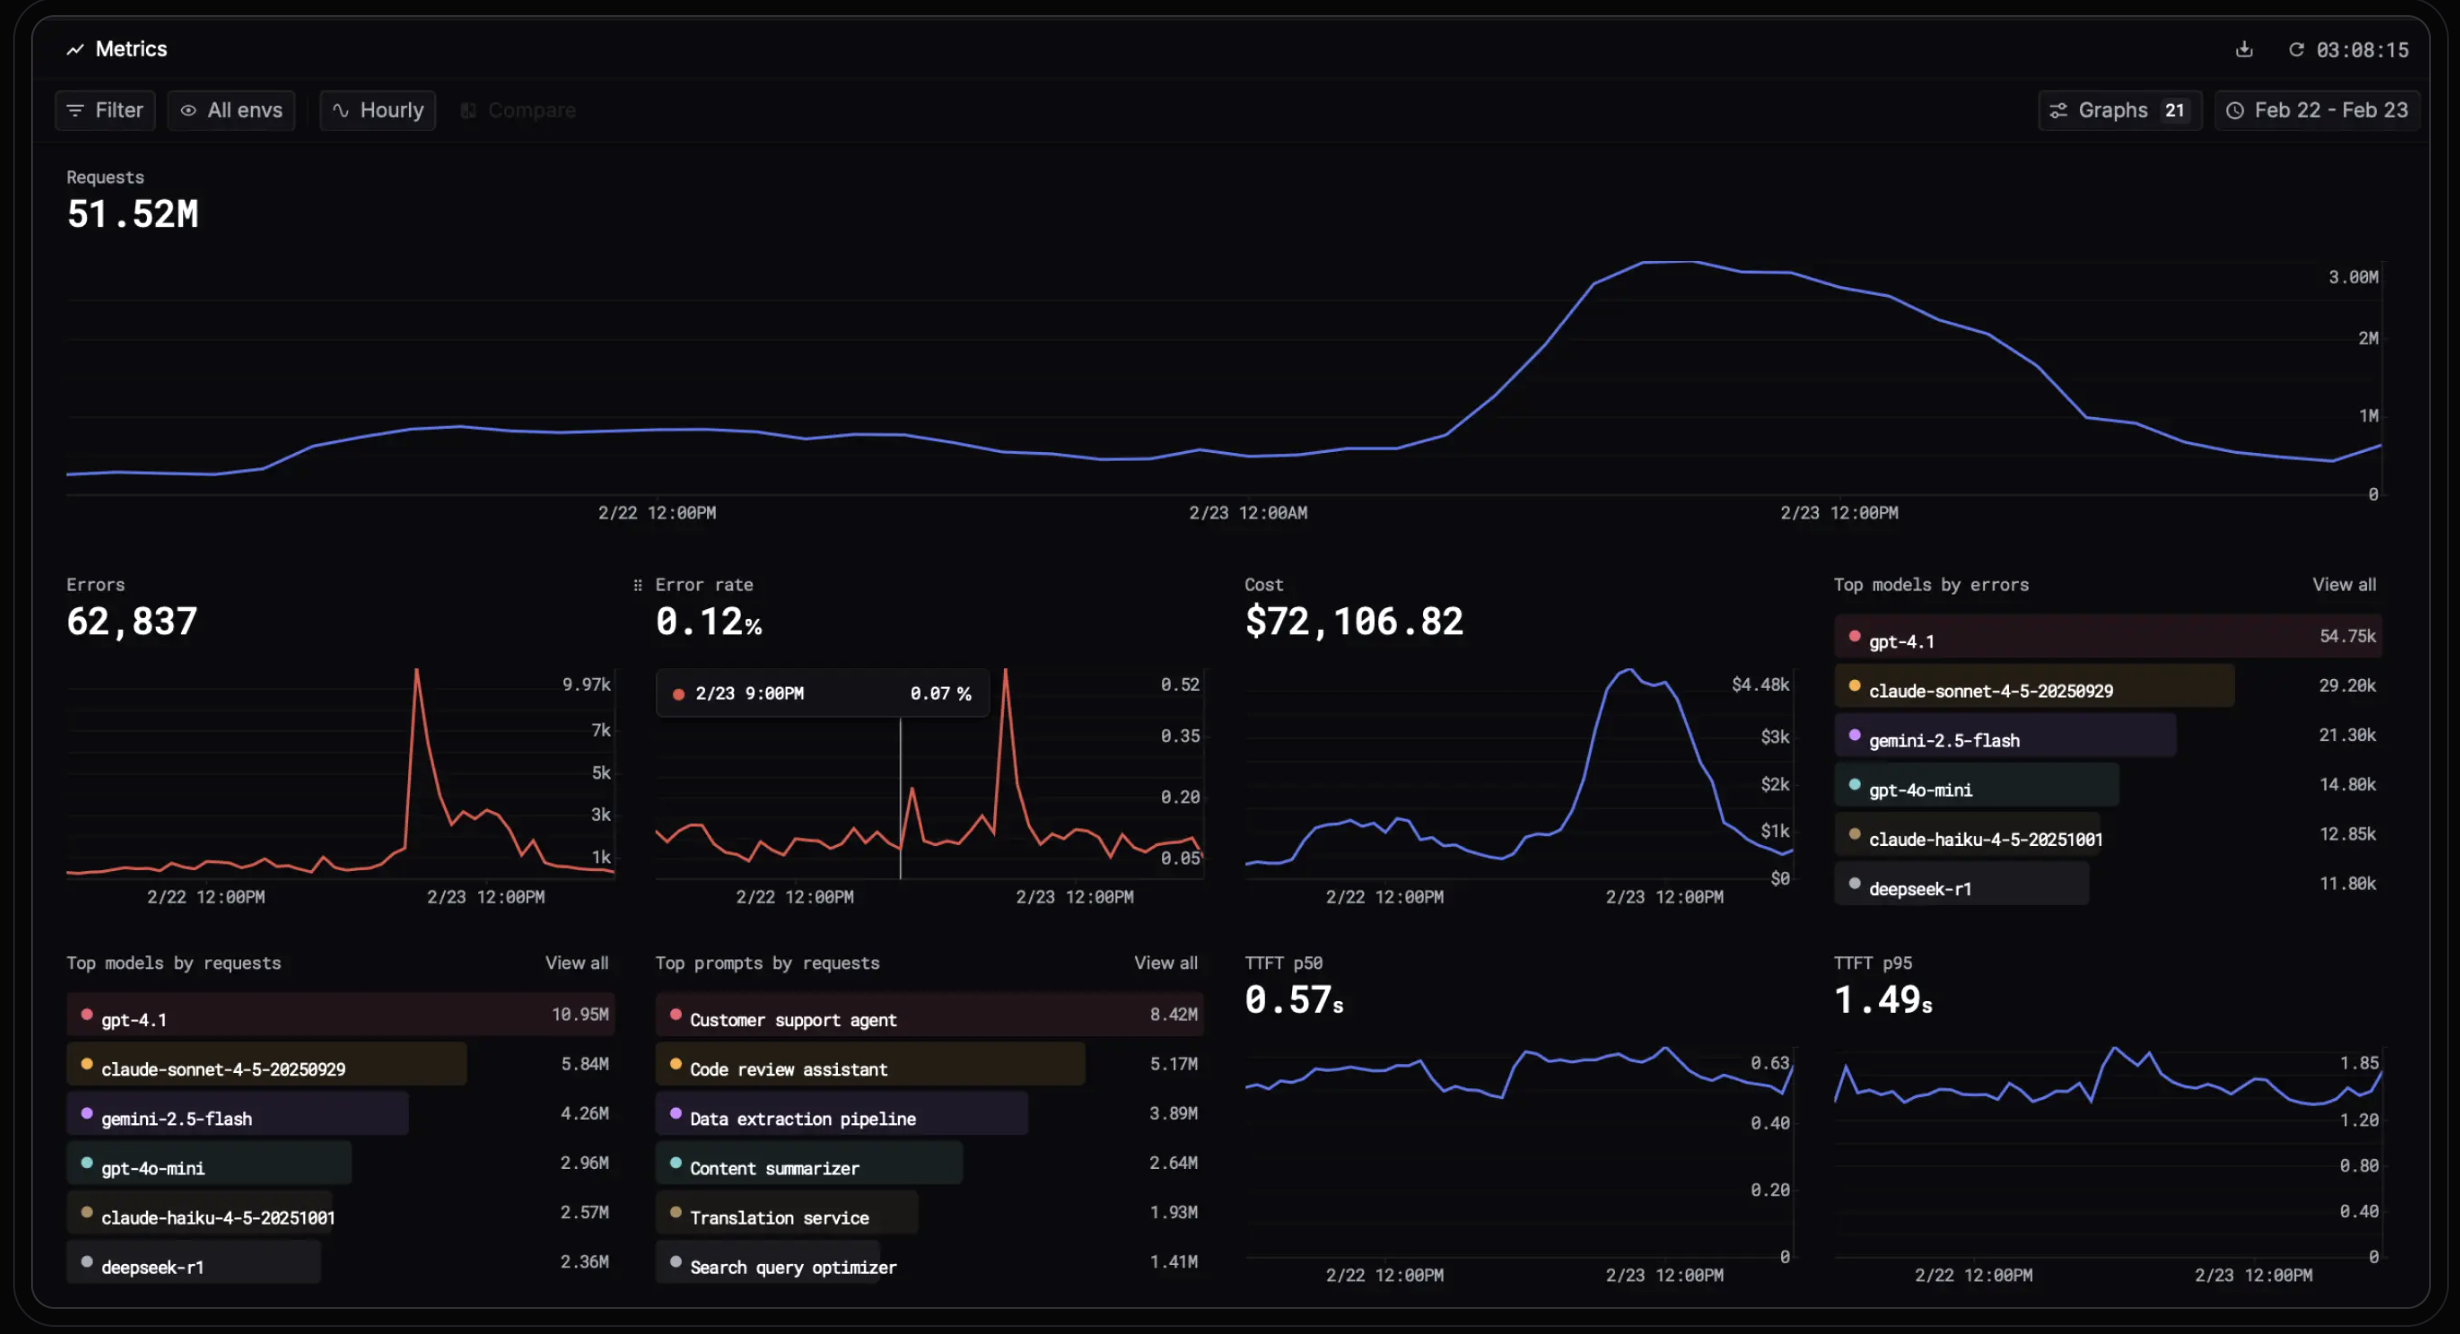
Respan shows you what your agents actually did. Route, observe, and evaluate every LLM call from one platform, so a wrong answer traces back to the prompt, the tool call, or the retrieval that caused it instead of dead-ending at a 200 status code.
Setup is one endpoint. Point your calls at an OpenAI-compatible gateway that reaches 1,000+ models, and tracing, cost attribution, and evals all arrive from the first request with no separate instrumentation project, at typically 30–40ms of added latency. Teams already emitting OpenTelemetry can send OTLP instead.
Pricing: Free is $0 with 100k logs, 1k scores, unlimited seats, and 7-day retention. Team is $199 per month billed yearly, lifting scores to 10k, retention to 30 days, and datasets, evaluators, and prompts to unlimited, with Enterprise adding SAML and a 99.99% SLA.
Limitations: Retention runs 7 days on Free and 30 on Team, and a HIPAA BAA is a $249 per month add-on below Enterprise.
AI/LLM Monitoring Features:
- Full trace tree of every prompt, tool call, retrieval, and response
- Rule-based checks and LLM-as-a-judge evaluators scoring live traffic
- Online evals attached to production calls, not just offline test sets
- Dashboards, saved views, and monitors with alerts on breach
- Traffic, errors, latency, cost, usage, and quality tracked per model, user, and API key
- Error spikes grouped by failure type with contributing failures surfaced
- Behaviors for recurring patterns across agent interactions
- One endpoint to 1,000+ models with automatic failover and load balancing
- Red teaming to test what deployed agents block and what gets through
Your APM tool stops at the model call
Respan traces the prompt, the tool calls, the token cost, and the eval score behind every request. Free to start, no credit card required.
2. Datadog
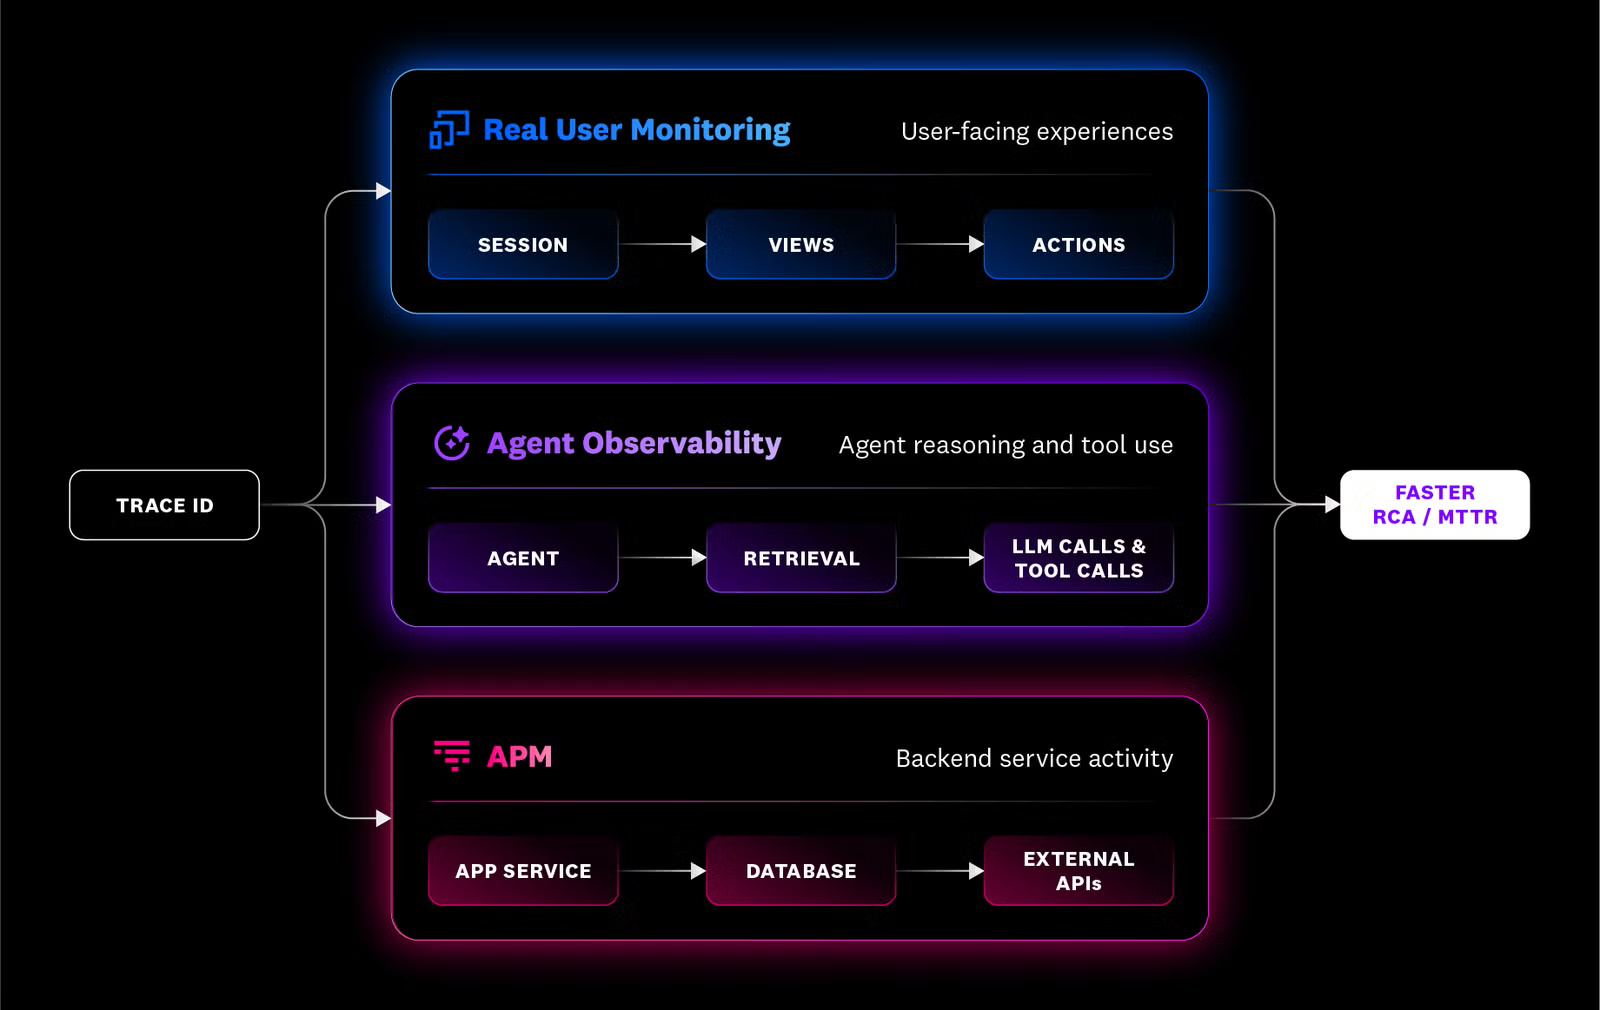
Datadog covers infrastructure, APM, logs, RUM, synthetics, and security behind one interface with over 1,000 integrations, and because the telemetry is first-party, pivoting from a slow trace to the host metrics underneath it takes no additional wiring.
The host math is where teams get caught. Datadog meters hourly, discards the top 1% of hours, and bills the full month at the peak of what remains, so a five-day traffic spike sets the rate for all thirty days. In Kubernetes the billing unit is the node rather than the pod, and an agent misconfigured as a sidecar counts every pod as a host.
Pricing: APM runs $31, $35, and $40 per host per month, with Data Streams Monitoring at the middle tier and the Continuous Profiler at the top. Infrastructure is a separate meter from $15 per host, and logs bill $0.10 per GB ingested and $1.70 per million events indexed.
Limitations: Code-level profiling and cross-version performance comparison sit on the top APM tier, so the diagnostics teams assume they are buying arrive at $40 per host rather than $31.
AI/LLM Monitoring Features:
- AI Agent Observability as a dedicated product area
- LLM call latency, token counts, and cost as spans
- AI Credits billing for the AI product line
- OTLP APM ingest for GenAI semantic convention attributes
3. New Relic
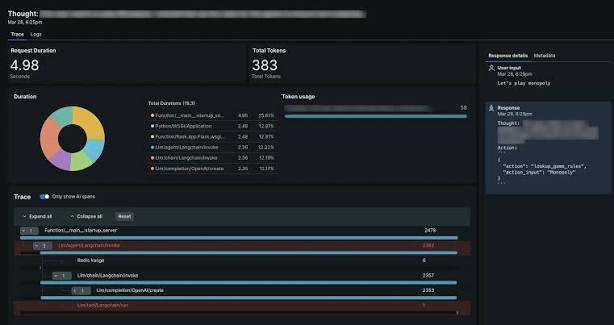
Hosts, containers, agents, and cloud functions are all free on New Relic. It does not count them. What it counts is how much telemetry you send and how many engineers are allowed to look at it, which inverts the cost model every other suite on this list uses, and it is the reason most searches for New Relic alternatives start with a seat count rather than a feature gap.
Seats decide who can debug production, and that is the constraint. Standard caps at five full platform users, and the sixth engineer joining an on-call rotation forces the jump to Pro. LLM traces also carry prompt and completion payloads that are large relative to ordinary spans, which makes ingest harder to forecast than the rest of the platform.
Pricing: The free tier covers 100 GB of ingest, one full platform user, and unlimited basic users. Full platform users run $10 for the first and $99 for each additional on Standard up to five, then $349 annually on Pro with no cap, with data at $0.40 per GB past the free allowance or $0.60 on Data Plus.
Limitations: FedRAMP Moderate and HIPAA eligibility require Enterprise with Data Plus, which puts regulated workloads two tiers above the entry point.
AI/LLM Monitoring Features:
- AI Observability for performance, reliability, and token usage
- New Relic AI as a context-aware observability assistant
- AIOps with dynamic thresholds and incident correlation
- OpenTelemetry ingest across traces, metrics, and logs
4. Dynatrace
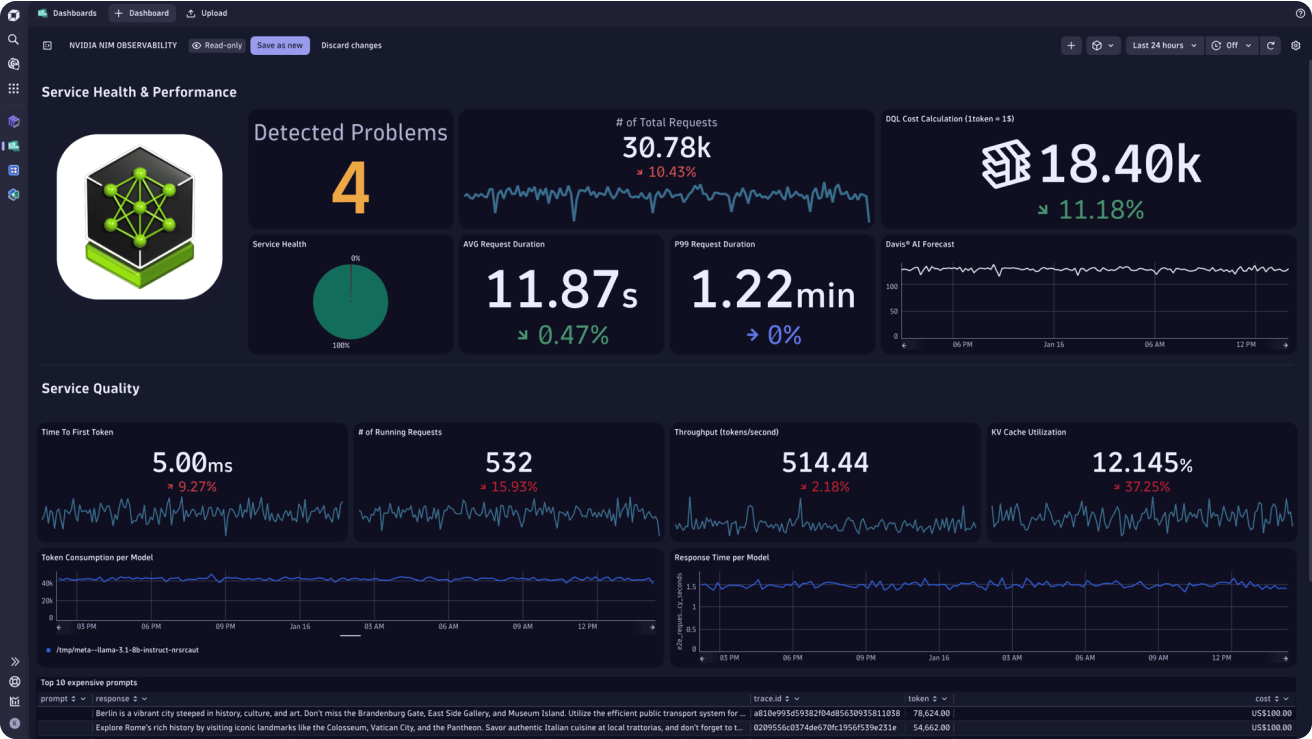
OneAgent installs once per host and discovers the topology on its own, which is what makes Dynatrace different in practice: Davis traces root cause deterministically against a live dependency graph rather than asking an engineer to query their way to an answer. On an estate large enough that manual investigation does not scale, that automation is what teams weighing Dynatrace alternatives are trying not to give up.
OneAgent is proprietary and needs deep host access, so running OpenTelemetry alongside it does not make the deployment portable, and migrating means re-instrumenting.
Pricing: Foundation & Discovery is $7 per host per month and Infrastructure Monitoring $29, both billed hourly at $0.01 and $0.04 per host-hour. Full-Stack Monitoring is $58 per 8 GiB host and is the tier that includes APM, with nothing on the rate card charging per user.
Limitations: Full-Stack includes only 10 days of trace retention by default, extendable to 10 years, so investigating an incident a fortnight later means having paid for the extension in advance.
AI/LLM Monitoring Features:
- Davis AI for automated root cause across the dependency graph
- Automated root cause analysis on end-to-end transactions
- OpenTelemetry metrics and traces on Full-Stack
- Kubernetes Platform Monitoring for AI workloads on clusters
5. Splunk
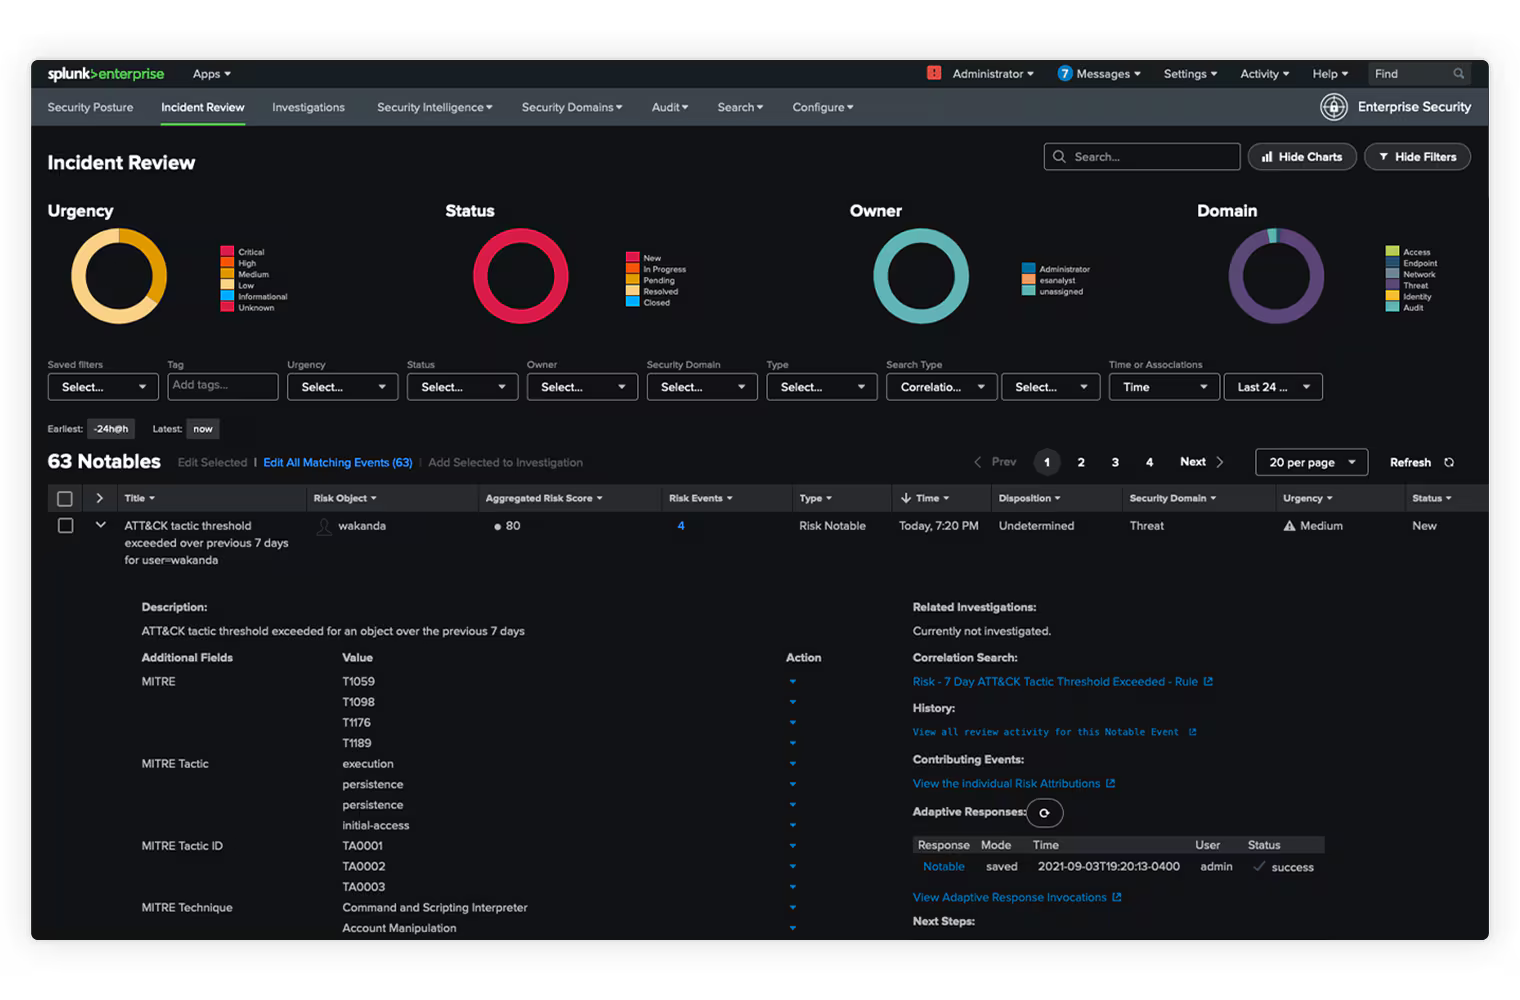
Splunk sells two APM products and they are not interchangeable, which trips up evaluations more than any other entry here. Splunk Observability Cloud is the cloud-native one, built on the OpenTelemetry Collector with NoSample tracing that keeps full trace data rather than sampling it. Splunk AppDynamics is the hybrid and on-premises one, aimed at three-tier and SAP environments, and it maps transaction performance to business metrics like conversion and revenue.
Whichever you pick, the case for Splunk, or similar tools, rests on consolidation. Both sit alongside Splunk Enterprise Security, so observability and security investigations can share a contract and a data platform. That case weakens quickly if you are not already a Splunk shop, because each SKU meters separately per host and Database Monitoring bills on top of whichever bundle you choose.
Pricing: Observability Cloud runs $15 per host per month for Infrastructure, $60 for App & Infrastructure, and $75 for End-to-End, with standalone APM at $55. AppDynamics prices per CPU core instead, at $6, $33, and $50 across its three editions.
Limitations: Observability Cloud has no self-hosted option, so residency requirements push you onto AppDynamics and its three-tier architecture focus rather than the cloud-native product.
AI/LLM Monitoring Features:
- Agent Observability for agents, models, and costs in Observability Cloud
- LLM Monitoring for compliance, cost, and performance in AppDynamics
- AI SRE for agentic troubleshooting across Splunk observability data
- OTel ingest, so GenAI semantic convention attributes arrive without a proprietary SDK
6. Elastic APM
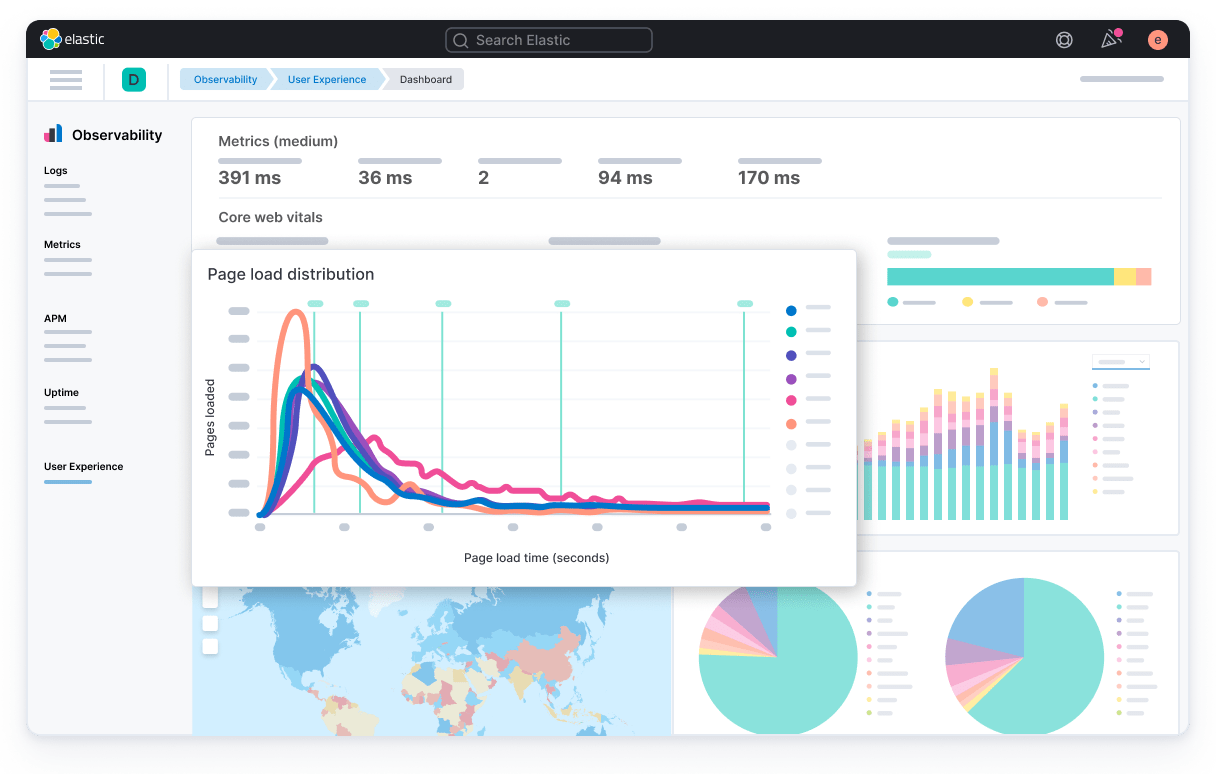
Ad hoc log search is the workflow Elastic APM is built around, because it runs on Elasticsearch and traces land in the same cluster as everything else you index. For a team that already operates the ELK stack, adding APM is a configuration change rather than a procurement cycle, and the Elastic Distributions of OpenTelemetry keep the instrumentation vendor-neutral.
One billing detail matters more than the headline rate: Elastic meters uncompressed data measured at the end of the ingest pipeline, before compression. Billed volume runs higher than both your raw source data and the resulting index, so an estimate built from either comes in low.
Pricing: Serverless Logs Essentials is $0.07 per GB ingested and $0.017 retained. Complete adds traces, metrics, SLOs, and machine learning at $0.09 per GB for logs and traces against $0.023 for metrics, with retention at $0.019 and $0.005.
Limitations: Traces price roughly four times higher than metrics on both ingest and retention, so an APM-heavy workload lands at the expensive end of Complete rather than the headline rate.
AI/LLM Monitoring Features:
- Unified agentic AI and scripted workflow automation on Complete
- AI-assisted pipelines and parsing
- Machine learning for anomaly detection across signals
- Elastic Distributions of OpenTelemetry for GenAI spans
7. AWS CloudWatch Application Signals
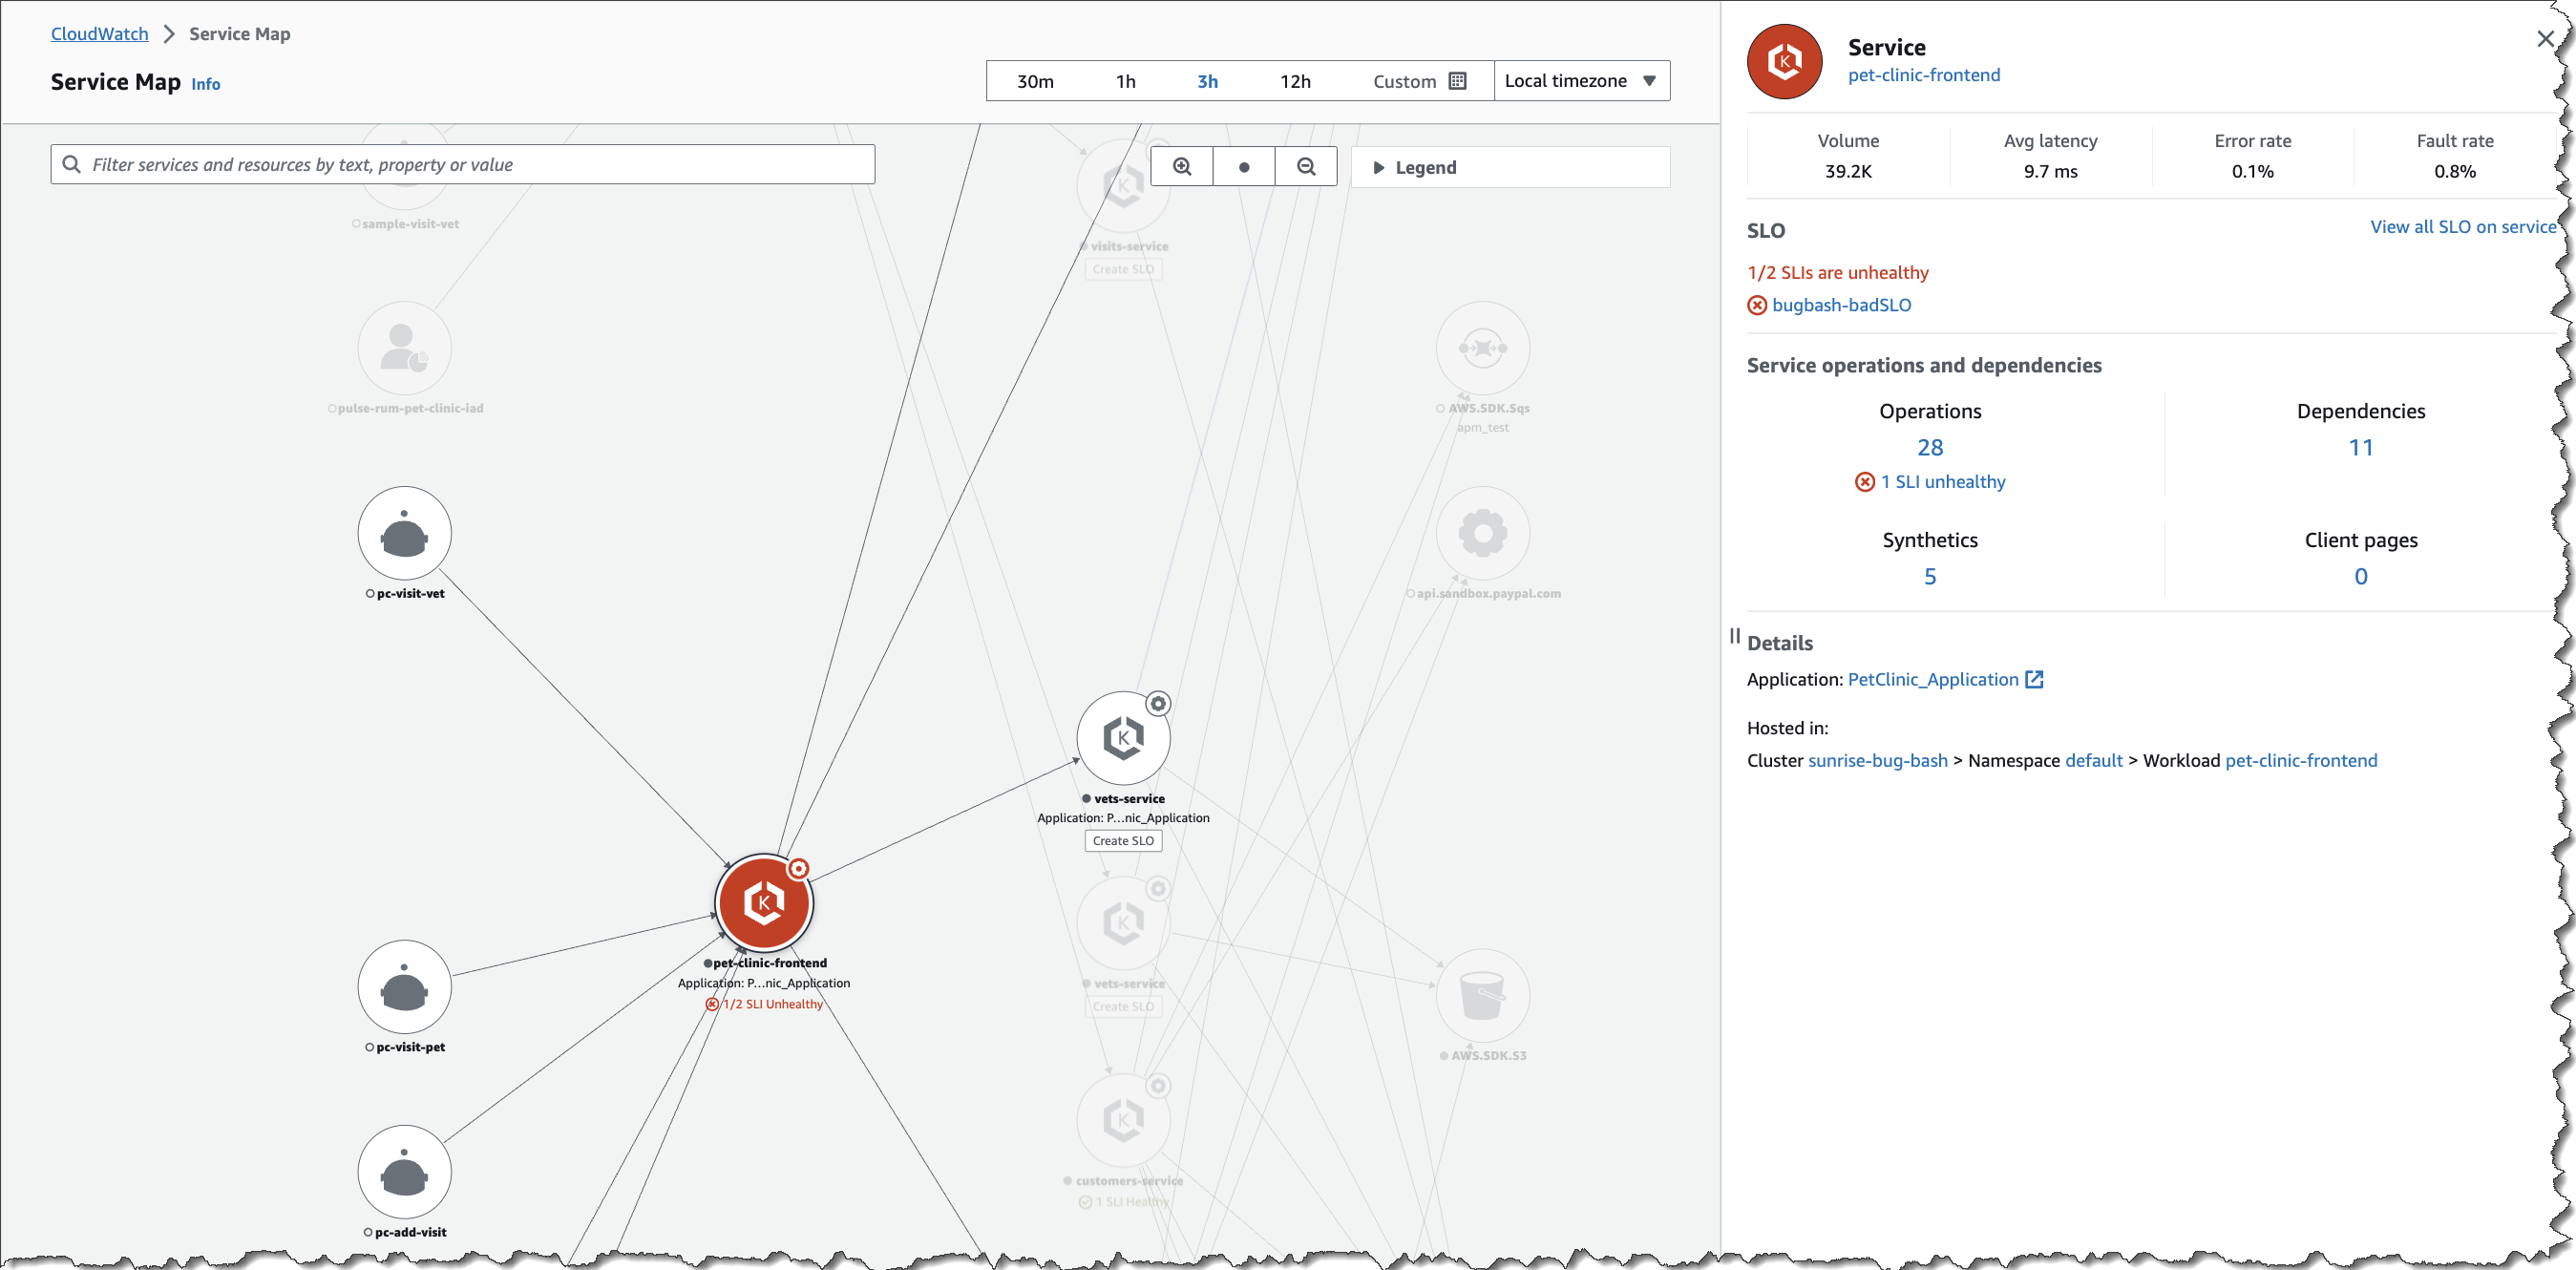
If your workloads run on AWS, you are already paying for part of an APM tool. CloudWatch Application Signals instruments applications through the AWS Distro for OpenTelemetry, builds a service map from observed calls, tracks availability and latency against service level objectives, and correlates into X-Ray traces and Container Insights without leaving the console or adding a vendor to procurement.
The cost model is where this needs care, and it is not the per-GB story it looks like. Application Signals bills a signal for every inbound service request and every outbound dependency call, so fan-out drives the meter rather than traffic does.
Pricing: Golden metrics run $1.50 per million signals for the first 100 million, dropping to $0.75 and then $0.30 at volume, while transaction search bills $0.35 per GB down to $0.15, plus $0.000005 per X-Ray trace stored. AWS's own example for one application at 25,000 requests per minute totals $1,899.91 a month before Synthetics, RUM, logs, or Container Insights.
Limitations: X-Ray defaults to a 5% sampling rate under Application Signals, so 95% of requests have no trace unless you raise it and pay for it.
AI/LLM Monitoring Features:
- Bedrock and SageMaker metrics vended into CloudWatch at no additional charge
- OTel GenAI spans via the AWS Distro for OpenTelemetry
- SLOs on latency and availability for inference endpoints
- Correlation into X-Ray traces and Container Insights
8. Honeycomb
Honeycomb stores wide events and derives logs, metrics, and traces from them, so a query can filter on any field without someone having decided in advance that the field would matter. That inversion is the reason it wins high-cardinality debugging: when the outage only affects users on one API version in one region on Android, you can ask that question without having pre-built the index.
Check your trace depth before modeling cost. Pricing meters events, and a trace with 150 spans counts as 150 events, so instrumentation granularity drives the bill in a way host counts never do. The product also leads with tracing, and a team whose daily work is log search will find that surface thinner than what New Relic or Elastic offer.
Pricing: Free covers 20M events and 100M metrics data points monthly with tracing, BubbleUp, and 2 triggers. Pro starts at $150 per month for 750M events and 3.75B data points with SSO and 2 SLOs, and Enterprise is custom with Service Map and Private Cloud.
Limitations: Service Map and Private Cloud sit on Enterprise, so the dependency view most APM buyers expect as standard requires the custom tier.
AI/LLM Monitoring Features:
- Agent Timeline for agent runs, available on the free plan
- Canvas AI Copilot for query construction
- Honeycomb MCP for connecting agents to telemetry
- BubbleUp for isolating which dimension explains an outlier
9. Sentry
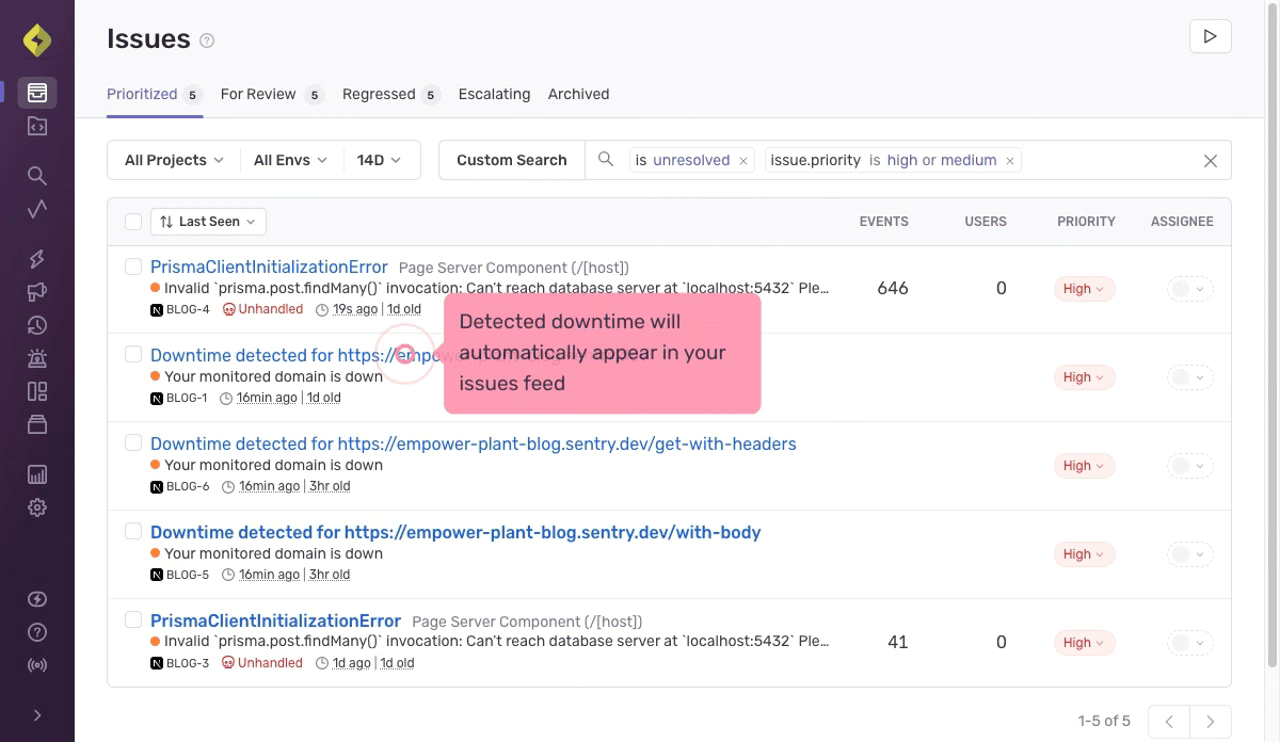
Ask most application teams what they actually need from APM and the answer is which deploy broke checkout. Sentry answers that faster and for a fraction of the price of anything else here. It captures exceptions with stack traces and breadcrumbs, groups them into issues, ties each one to the release and commit that introduced it, and adds session replay so you can watch what the user did beforehand.
Sentry does not try to be a full replacement and it is honest about that. There is no infrastructure monitoring and no host metrics, and its tracing covers transaction performance rather than a correlated view across services, logs, and infrastructure.
Pricing: Developer is free for one user, Team $26 per month with unlimited users, and Business $80 with unlimited dashboards, anomaly detection, and SAML. Event volume above the included quota bills separately on every tier.
Limitations: Seer, the AI debugging agent, carries its own subscription on top of the plan price rather than being included at $26.
AI/LLM Monitoring Features:
- Seer, an AI debugging agent, on Team and above with a separate subscription
- MCP access included from the free Developer tier
- Anomaly detection on metric monitors at Business
- Release and commit attribution for regressions introduced by a deploy
10. SigNoz
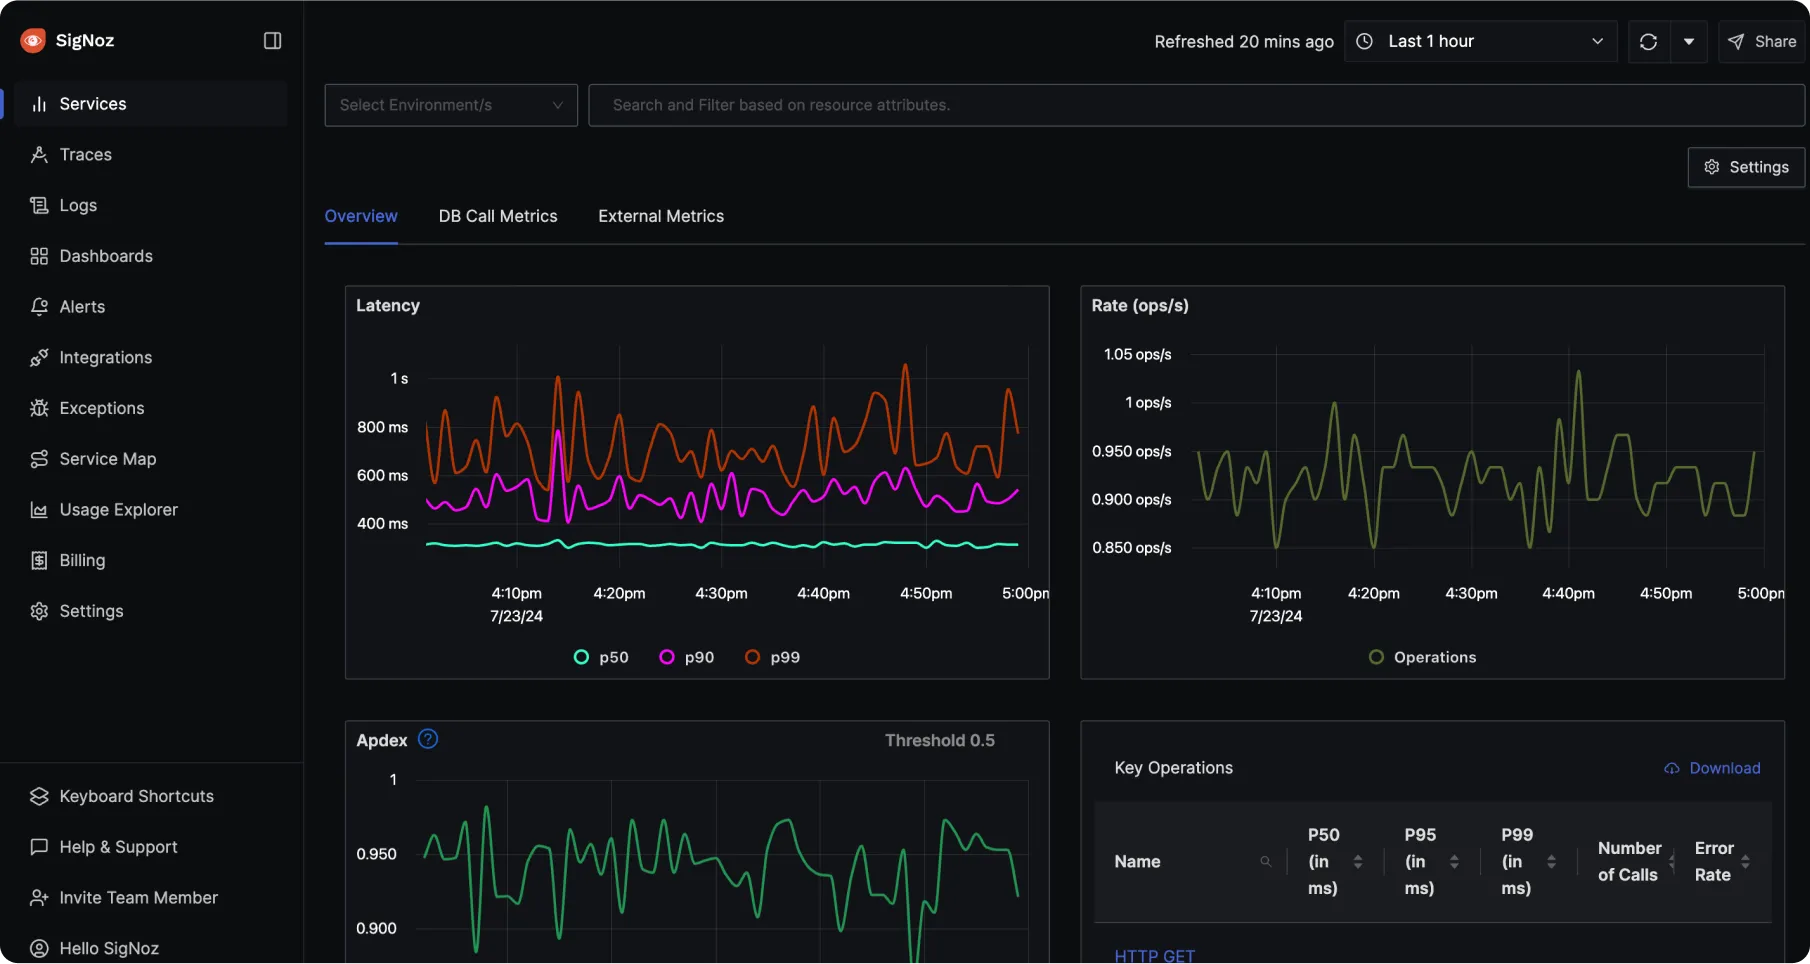
No per-host charge, no per-seat charge, and no premium for custom metrics. SigNoz bills on data volume alone, and the Community Edition is free to self-host with no data caps at all. It is OpenTelemetry-native end to end, storing traces, metrics, and logs in ClickHouse and querying them from one interface, so instrumentation written for SigNoz points at any OTel-compatible backend later without rewriting.
Free is a licensing statement rather than a cost statement. Self-hosting means running and scaling a ClickHouse cluster and owning its uptime, which is the system you depend on during an incident. On the cloud side, metrics bill per sample rather than per GB, so a high-cardinality metric with many dimensions moves the bill differently than log volume does and has to be modeled on its own.
Pricing: Community Edition is free and self-hosted. Teams Cloud starts at $49 per month including $49 of usage, roughly 163 GB of logs or traces, then $0.30 per GB and $0.10 per million metric samples, with Enterprise from $4,000.
Limitations: Default retention runs 15 days on logs and traces and one month on metrics, and HIPAA with a BAA is Enterprise only at $4,000 per month.
AI/LLM Monitoring Features:
- Noz, an AI teammate, included on Teams Cloud
- MCP Server access from the $49 tier
- OpenTelemetry-native ingest for GenAI spans
- Traces, metrics, and logs correlated in one query surface
See what your agents *actually* did
Use Respan to trace every prompt, tool call, and response, track cost and latency, and score output quality on live traffic. Free to start, no credit card required.
How to Set Up End-to-End Application Performance Monitoring
End-to-end means a single request is traceable from the browser that started it to the last dependency it touched, with the logs and metrics from every hop attached. Most teams get partway there, instrument two services well, and leave a gap in the middle that swallows exactly the requests they need to debug. The order below closes the gaps in the sequence that makes each step useful on its own.
-
Instrument one service completely before touching the second. Pick the service that owns your most valuable endpoint and install either the vendor agent or the OpenTelemetry SDK for its language. Auto-instrumentation covers the HTTP framework, the database driver, and the HTTP client without code changes, which is most of what you need. Confirm you can see a trace with spans for the inbound request and every outbound call it makes. If OpenTelemetry is an option in your stack, take it: the instrumentation stays portable and migrating backends later stops meaning re-instrumenting.
-
Propagate trace context across every hop. A trace breaks the moment a service receives a request without the
traceparentheader and starts a new root span instead of continuing the existing one. Auto-instrumentation handles this for direct HTTP and gRPC calls. It does not handle message queues, scheduled jobs, or anything that serializes work and picks it up later, so context has to be injected into the message on publish and extracted on consume. Broken propagation is the single most common reason an end-to-end setup produces two disconnected half-traces instead of one. -
Add custom spans and attributes where the auto-instrumentation is blind. Automatic spans cover the boundaries between processes. They say nothing about what happened inside one. Wrap the expensive internal operations, the cache lookup, the serialization step, the third-party SDK call, and attach the attributes you will want to filter on during an incident: tenant ID, plan tier, feature flag state, region. High-cardinality attributes are what turn "p99 is up" into "p99 is up for enterprise customers in eu-west."
-
Connect logs and infrastructure metrics to the trace. Emit the trace and span ID in every log line so a slow span links directly to what the code logged while it ran. Ship host, container, and Kubernetes metrics to the same backend and tag them with the service name the traces use. The workflow you are building toward is one pivot from a slow span to the logs it produced and the pod it ran on, with no ID copied by hand.
-
Cover the client and the paths nobody exercises. Real user monitoring instruments the browser or mobile app so the trace starts where the customer actually is, on the network they actually have, rather than at your load balancer. Synthetic checks run a scripted journey through the critical path on a schedule, which catches breakage on the endpoints that get traffic only at month end. Both extend traces you already have rather than creating a parallel system.
-
Instrument the model calls your agent renders as one span. Any request that touches an LLM leaves a hole in an otherwise complete trace: the APM agent records duration and status and discards the prompt, the tool calls, the retrieved documents, and the response. Capture those, then score the output on live traffic against faithfulness, relevance, and safety criteria. Running that through a gateway means the calls are logged and traceable from the first request without a second instrumentation project, and the token cost attributes to the same user and workflow as the rest of the trace.
-
Set alerts scoped to what a team can act on. Static global thresholds page constantly and get muted within a week. Alert on error rate and latency together rather than either alone, scope every condition to a service, environment, and owner, and route to the team that can fix it. Wiring those conditions into release gates and rollback triggers is where alerting stops being noise and starts being one of the DevOps best practices that keeps a bad deploy from reaching everyone. Then set a spend alert on the monitoring bill itself, because the setup you just built meters on ingest and the volume only goes up.
Instrument one service end to end before rolling out to the rest. A complete trace through one path is worth more than partial coverage across twenty, and it surfaces the propagation gaps while they are still cheap to fix.
FAQs
What Are APM Tools?
APM tools are platforms that instrument running applications to record how requests behave in production and trace a problem back to the code, query, or dependency responsible. The instrumentation runs inside the application process as a vendor agent or an OpenTelemetry SDK, and it emits traces made of spans, where each span is one unit of work with a duration and a set of attributes.
Around that core, most add exception grouping, database query analysis, service dependency maps, real user monitoring, and synthetic checks. The category has widened enough that the major APM vendors now sell logs, infrastructure metrics, and security under the same contract, which is why "APM tool" and "observability platform" increasingly describe the same product with different emphasis. What still separates them in practice is the billing meter and how much of your stack the agent reaches.
APM vs Observability: What's the Difference?
APM is a product category. Observability is a property of a system: whether the telemetry coming out of it lets you answer questions nobody anticipated when the instrumentation was written, without shipping new code to find out.
The practical difference shows up in what happens when something breaks in a way you did not predict. A dashboard built around known failure modes tells you a known thing went wrong. An observable system lets you ask a new question of data you already collected, which is why high-cardinality attributes matter more than dashboard count. APM instrumentation is one of the main ways to make an application layer observable. It is not the whole job, and buying an APM tool does not confer observability on a system that emits nothing worth querying.
Are Free or Open Source APM Tools Enough for Production?
Often, and the honest constraint is operational rather than technical. SigNoz self-hosted has no data caps, Honeycomb's free tier covers 20 million events, New Relic's covers 100 GB of ingest, Sentry's covers one user, and Respan's includes 100k logs and unlimited seats. Several teams run real production workloads inside those limits.
What you take on with a self-hosted option is the uptime of the system you depend on during an incident. Running SigNoz means running and scaling ClickHouse; running Elastic self-managed means someone who understands shard management. Weigh that engineering time against a managed bill honestly, because the hours are real and they land on whoever is already on call. Free tiers on managed platforms avoid that trade entirely, at the cost of a ceiling you will eventually hit.
Can APM Tools Monitor AI Applications and LLM Agents?
Partly, and the gap is specific. Splunk AppDynamics ships LLM monitoring, Splunk Observability Cloud sells Agent Observability, and Datadog and New Relic both have LLM modules. What these report is latency, token count, and cost, which tells you the call succeeded and what it charged you.
Whether the answer was correct is not in that record. An agent that loops through six unnecessary tool calls, retrieves nothing useful, and returns a confident wrong policy produces a clean 200 at normal latency, and no amount of span-level correlation surfaces it. Catching that means capturing the prompt, the tool calls, the retrieved context, and the response, then scoring the output against faithfulness, relevance, and safety criteria on live traffic rather than on a test set assembled months ago. That is the layer Respan instruments, and it is why teams running both conventional services and AI features generally need coverage on both.
How Much Do APM Tools Cost?
The meter matters more than the rate, because the same workload produces wildly different bills depending on what gets counted. Datadog and Splunk Observability Cloud both start at $15 per host for infrastructure, but their APM meters work differently: Datadog runs a separate $31 to $40 ladder, while Splunk sells APM standalone at $55 or bundled into App & Infrastructure at $60. Dynatrace charges $58 per 8 GiB host and nothing per user.
Model your bill against twelve months of growth rather than current traffic, and check which dimension grows fastest. Host-based pricing punishes autoscaling, seat-based pricing punishes letting engineers debug production, and ingest-based pricing punishes exactly the detailed instrumentation that makes the tool useful. Several platforms here meter on two axes at once, and the cheapest option during a pilot is frequently the most expensive one a year later.