
At 3:14am a certificate expires on an internal service. By 3:16 the monitoring stack has fired 847 alerts across nine services, and every one of them traces back to that certificate. The on-call engineer spends eleven minutes working that out by hand.
That is the problem AIOps was built for. Machine learning reads the event stream, collapses 847 alerts into one incident, and points at the certificate. The engineer starts at the answer instead of the noise.
The category has a second problem now, and most AIOps tools cannot see it. A support agent calls a retrieval tool, reasons over the result, calls a second tool, and returns a confident refund policy that does not exist. Every span is green. Latency is normal. The HTTP status is 200. Nothing in an infrastructure event stream registers a failure, because by every signal that stream collects, the system is healthy.
Both are the same job on different layers: pull the real signal out of operational noise before users feel it. This list covers the 20 best AIOps tools that do it, what each one ingests, what it can act on, and what it costs.
What Is AIOps?
AIOps is the application of machine learning and analytics to IT operations data in order to detect, diagnose, and resolve problems faster than manual triage allows. The term was coined by Gartner and the definition has stayed consistent: sift meaningful events and patterns out of operational noise, and connect them to application performance and availability.
The word "IT" in that definition does a lot of work that no longer matches how software is built. Nothing in it restricts the practice to servers and switches. It describes a method, not a layer. Any system producing operational telemetry at a volume humans cannot read is a candidate, and AI applications in production now generate exactly that.
How AIOps Works
Every platform in this category runs some version of the same five-stage pipeline.
- Ingest - Pull telemetry from across the estate: metrics, logs, traces, alerts from existing monitoring tools, change events from CI/CD, and topology from a CMDB or service map.
- Normalize - Reconcile formats, timestamps, and entity names so an alert from Nagios and one from CloudWatch describe the same host in the same vocabulary.
- Correlate - Group related events into a single incident using time proximity, shared content, topology relationships, or a trained model.
- Detect - Compare current behavior against a baseline to surface what changed. Some platforms use static thresholds, some use dynamic thresholds that adapt to trends, some use unsupervised models.
- Act - Route the incident to an owner, enrich it with context, and in some cases execute a remediation playbook.
The stage that separates the products is correlation. Time-based grouping is straightforward and works poorly on a large estate. Topology-aware correlation needs an accurate dependency map, which is why platforms with strong discovery tend to have strong correlation. Model-based grouping needs history, which is why these tools improve over months rather than days.
What Are AIOps Tools?
AIOps tools are platforms that run that pipeline as a product. They sit downstream of monitoring, or replace it, and their output is a smaller number of higher-confidence incidents than the raw signal contained.
They cluster into four rough shapes:
- Full observability suites with an AIOps layer - Dynatrace, Datadog, New Relic, and OpenObserve collect the telemetry themselves and apply intelligence on top of their own data.
- Event correlation platforms - BigPanda, Splunk ITSI, and IBM Cloud Pak for AIOps sit above your existing monitoring tools and correlate their alerts rather than collecting raw telemetry.
- Incident response platforms - PagerDuty and ServiceNow ITOM own the workflow after detection: routing, escalation, ticketing, and remediation.
- AI application platforms - Respan, Arize, Galileo, and the rest instrument LLM calls and agent runs, capturing the prompt, the tool calls, the retrieved context, and the response, then scoring output quality.
The fourth group is newer and it exists because the first three cannot see inside an AI request. A proxy or an APM agent treats a completion as an opaque payload. It reports that the call took 800ms and returned successfully. Whether the answer was correct is not a field in that record.
AIOps Use Cases & Examples
AIOps covers more ground in 2026 than it did when the term was coined. Here are the use cases teams get the most out of:
-
Alert noise reduction. A monitoring stack watching 3,000 hosts fires thousands of alerts a day, most of them duplicates or symptoms of the same cause. Intelligent grouping collapses them.
-
Event correlation and root cause. A checkout failure, three database timeouts, and a load balancer alert are one incident with one origin. Correlation engines connect them using topology and timing.
-
Anomaly detection on infrastructure. Rather than a fixed CPU threshold that pages every Monday morning, dynamic baselines learn the normal shape of a metric and fire when behavior departs from it.
-
Change risk assessment. Most incidents follow a deploy. Correlating change events from CI/CD against incident history lets a platform flag a risky change before it ships.
-
Automated remediation. Once a known failure is identified with confidence, a runbook can restart the service, clear the cache, or roll back the deploy without waking anyone.
-
AI output quality monitoring. An agent returns a wrong answer with a clean status code. Catching it means scoring the response itself against faithfulness, relevance, and safety criteria on live production traffic, not on a test set assembled months earlier.
Benefits of AIOps for Engineering Teams
The value of AIOps shows up in on-call hours saved and in failures caught before a customer files a ticket. Here are the key benefits engineering teams get from adopting AIOps:
- Fewer pages that do not need a human - Grouping and suppression cut the volume of alerts that reach an on-call rotation, which is the direct cause of alert fatigue and slow response.
- Shorter time to cause - Correlation and enriched context remove the reconstruction step that consumes most of an incident's first fifteen minutes.
- Failures caught before customers report them - Baseline detection surfaces degradation while it is small rather than after a support ticket names it.
- Spend that can be attributed - Cost visibility broken down by service, model, feature, or customer turns a single invoice into a decision about what to change.
- Less toil per engineer - Automated triage and remediation move routine work off the rotation, which matters more as estates grow faster than headcount.
- Quality regressions that show up in hours - For teams running AI in production, scoring output continuously is the difference between finding a bad prompt change the same day and finding it in a quarterly review.
How much of this you actually get depends on what the platform can see, which is the first thing to check on each of the tools below.
20 Best AIOps Tools and Software
The list runs from broadest coverage to most specialized. Pricing models vary enough that a single number is misleading for several of these, so the pricing column states the model where a rate is not published.
| Tool | Operates on | AIOps capability | Pricing |
|---|---|---|---|
| Respan | LLM calls and agent runs | Error incidents, monitors, online evals | Free, $199/mo Team |
| Dynatrace | Full-stack infrastructure telemetry | Davis causal root cause analysis | From $7/host/mo |
| Datadog | Infrastructure, APM, logs | Watchdog anomaly detection | $15/host/mo Pro annual |
| New Relic | Full-stack telemetry | Applied intelligence and correlation | Free 100 GB, $0.40/GB after |
| Splunk ITSI | Machine data and service KPIs | Predictive analytics, event analytics | Quote only, SVC or ingest |
| IBM Cloud Pak for AIOps | Events, logs, topology | Log and metric anomaly prediction | Quote only, capacity-based |
| ServiceNow ITOM | Discovered nodes and events | Event correlation into incidents | Quote only, subscription units |
| BigPanda | Alerts from existing tools | Correlation, change risk, L1 agent | Quote only, credit-based |
| LogicMonitor | Hybrid infrastructure | Edwin AI event intelligence | From $16/hybrid unit/mo |
| OpenObserve | Logs, metrics, traces, RUM | AI SRE agent, incident workflows | $0.50/GB ingested |
| PagerDuty | Alerts and incident workflow | Intelligent alert grouping | From $21/user/mo, AIOps extra |
| Arize | ML and LLM spans | Drift monitoring, span tracing | Free tier, $50/mo Pro |
| Galileo | LLM outputs | Hallucination detection, scoring | Free tier, $150/mo Pro |
| Fiddler AI | Model predictions and traces | Drift, bias, explainability | Free plan, $0.002/trace |
| LangSmith | LangChain and LangGraph runs | Trace trees, annotation queues | Free tier, $39/seat/mo |
| Langfuse | LLM traces | Tracing and prompt management | Free tier, from $29/mo |
| Braintrust | Eval datasets and traces | Scoring, experiments, regression tests | Free tier, $249/mo Pro |
| Portkey | Gateway traffic | Conditional routing, guardrails | Free tier, $49/mo Production |
| Helicone | Proxied LLM requests | Cost analytics and caching | Free tier, $79/mo Pro |
| Traceloop | OpenTelemetry LLM spans | Quality evaluators, drift monitoring | Free to 50k spans/mo |
1. Respan
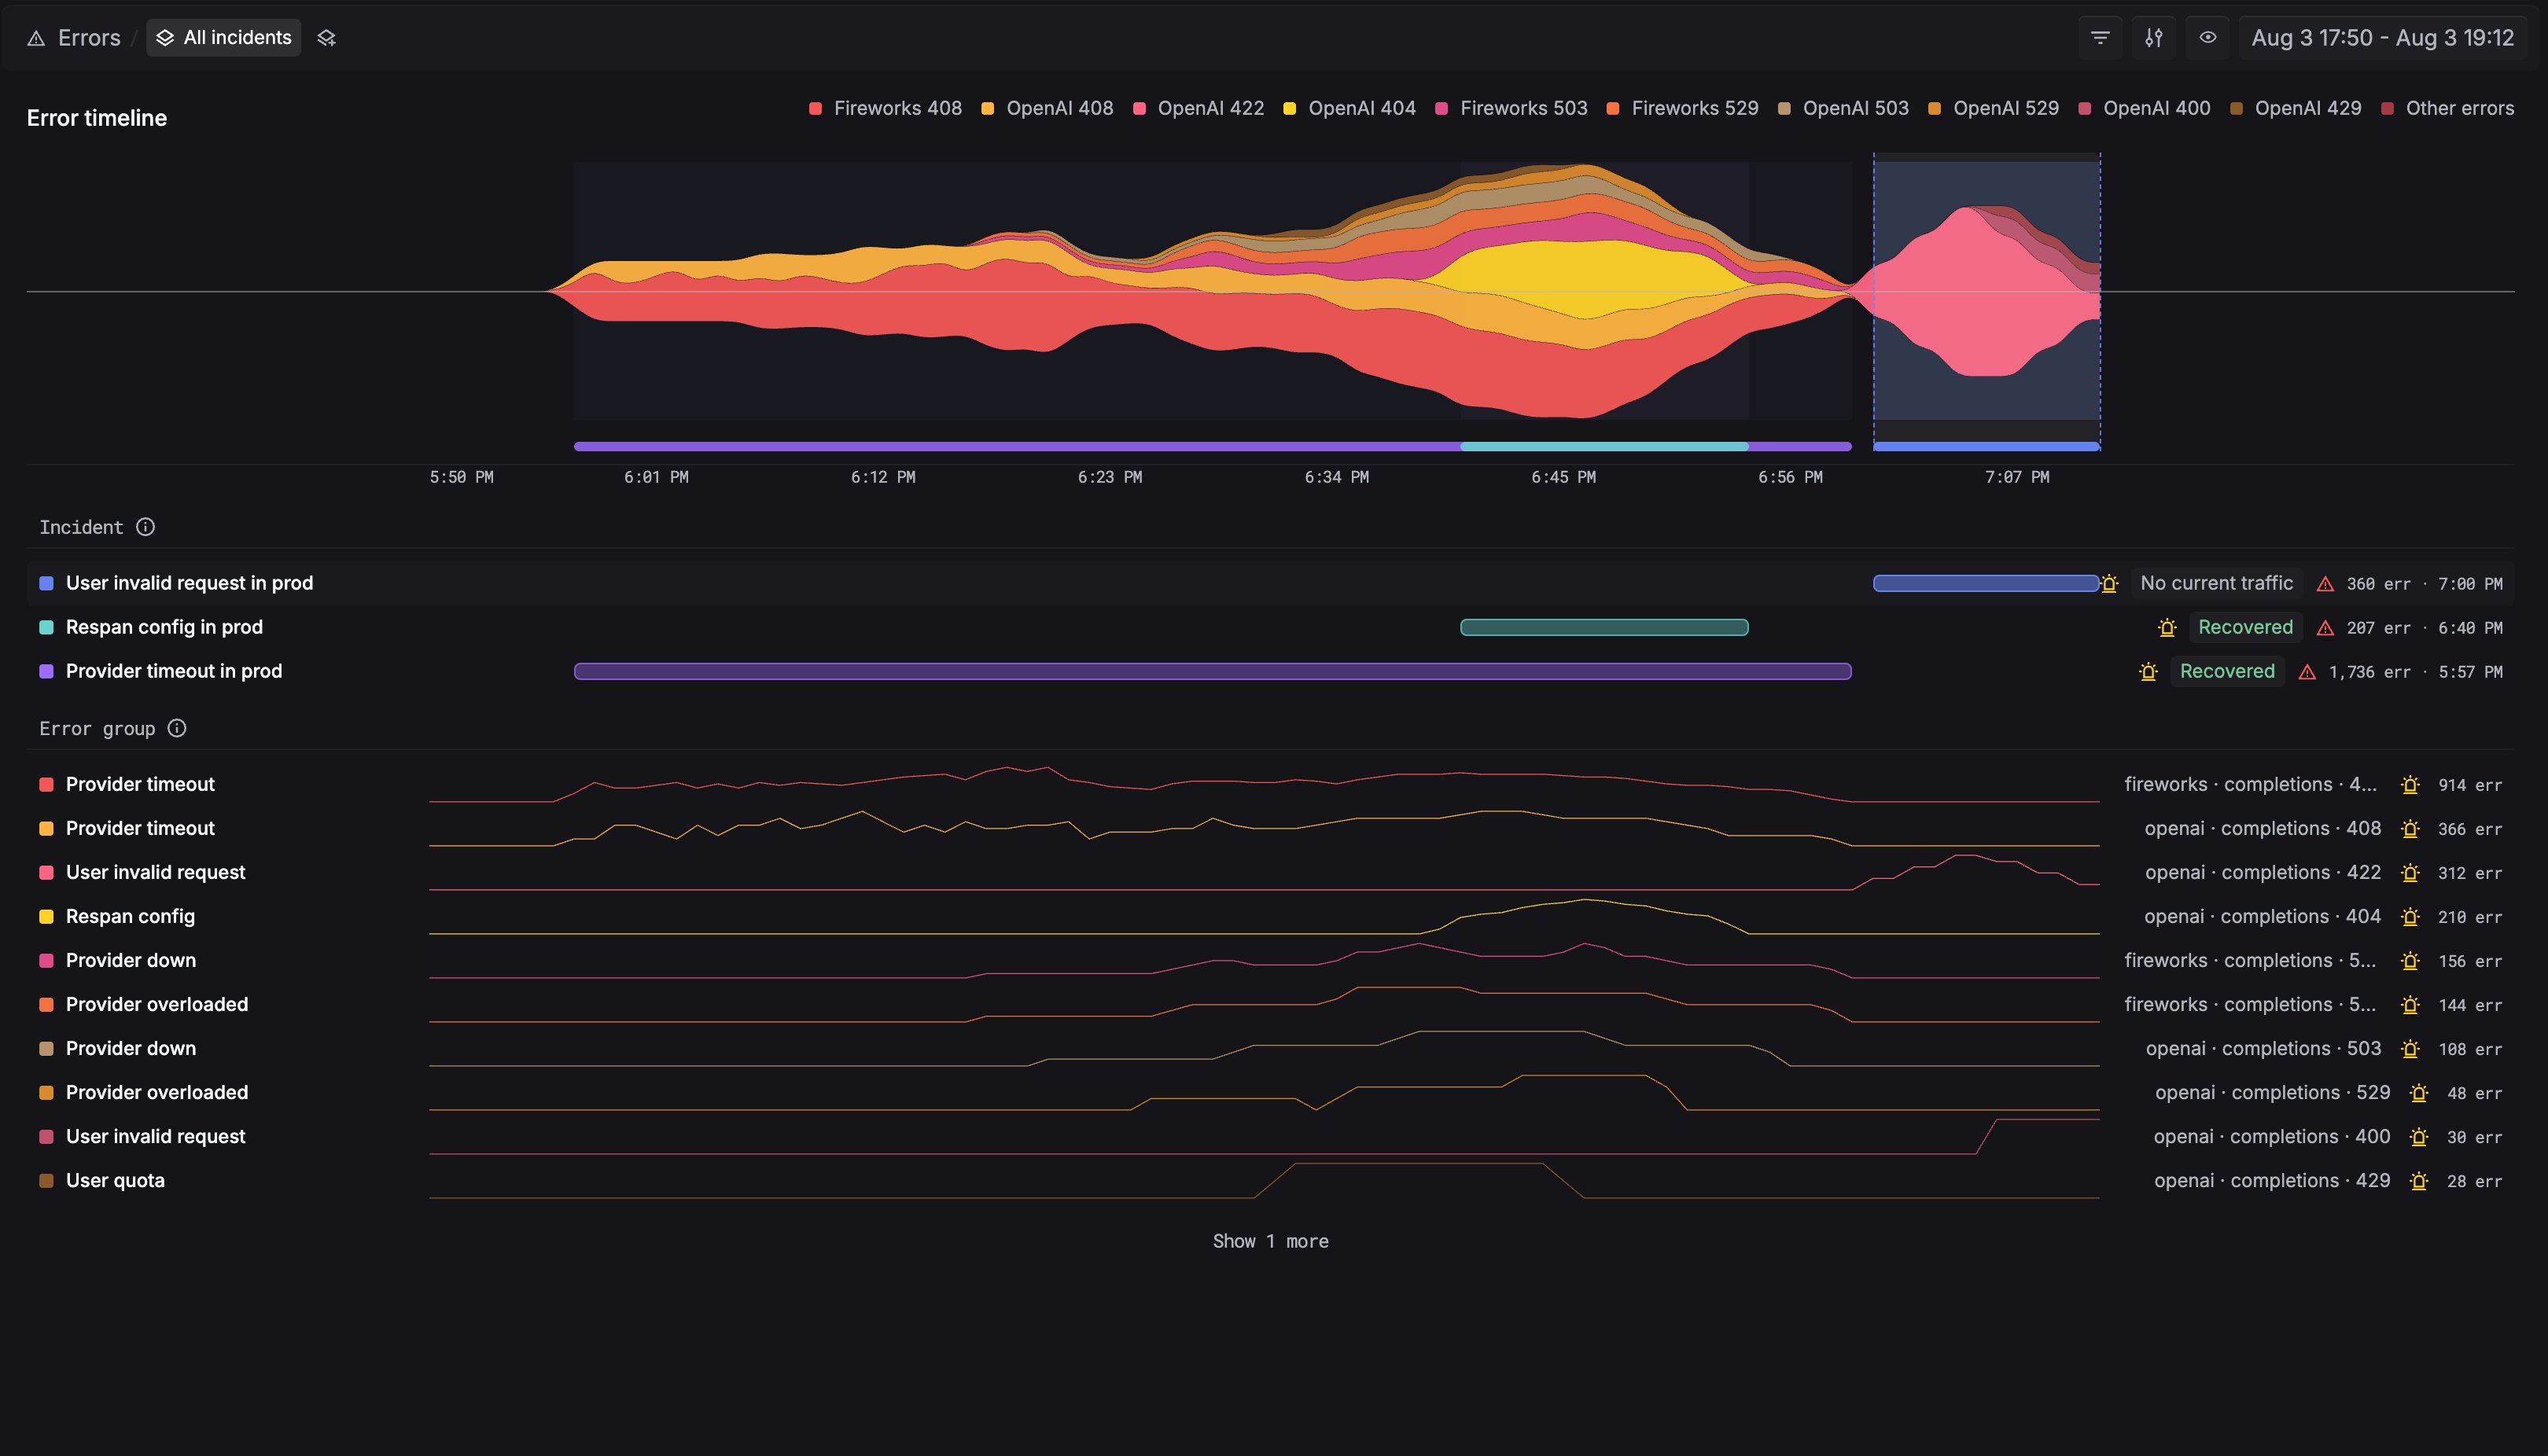
Respan is an LLM engineering platform that applies the AIOps method to the layer where AI applications actually fail. Route, observe, and evaluate every LLM call. When error activity spikes, Respan turns that window into an incident broken down by error group, so three real problems buried in 10,000 error events surface as three problems rather than a table nobody reads.
That is the same job an event correlation platform does on infrastructure alerts, running on traffic those platforms cannot see inside. AI failures also do not always announce themselves as errors. The agent that looped through six unnecessary tool calls, the retrieval that came back empty, the prompt change that quietly dropped answer quality, all of them return successful responses at normal latency. Catching those requires collecting what infrastructure telemetry discards and scoring it.
Here's what makes Respan stand out from other AIOps tools:
- Start at the incident, not the error table - An error spike becomes an incident you can open, broken down by group and ranked by which failures accounted for the most activity, with volume over time on any group and a path down into the logs when you need more context.
- See exactly what the agent did - Every prompt, tool call, retrieval, and response renders as a single trace tree with latency on each span, so a bad output resolves to the exact step that caused it.
- Find out before your customers do - Monitors watch error rate, cost, latency, or tokens over any window and alert Slack, email, or a webhook on breach, scoped by model, project, environment, or user so alerts match the slice you own.
- Measure quality with numbers, not opinions - Rule-based checks and LLM-as-a-judge evaluators score live production traffic and alert on quality drops, which is the failure class no infrastructure platform can detect.
- Stay up when a provider fails - The AI gateway reaches 1,000+ models through one OpenAI-compatible endpoint with ordered fallback, load balancing across keys, and retries with backoff.
- Know where every dollar goes - Requests, tokens, errors, latency, and cost break down by model, user, and API key, with soft warnings or hard caps per key and response caching on repeat prompts.
- Test what your agents block - Red teaming probes deployed agents on your schedule rather than an attacker's.
- Pass the review you are also running - SOC 2, ISO 27001, GDPR, and HIPAA compliant, with a BAA available.
Instrumentation is the Respan SDK or OTLP, and error tracking, prompt management, tracing, evals, and the gateway all run off the same request record.
The free tier starts at $0 with 100k logs, 1k scores, and 412 requests per minute of proxy throughput, which runs a real workload rather than a demo. Team is $199 per month billed yearly and raises throughput to 8,400 requests per minute with 30-day retention and unlimited prompts, datasets, and evaluators. Enterprise is custom and adds self-hosting, SAML, custom retention, a 99.99% uptime SLA, and a dedicated support engineer.
Best fit: Engineering teams running agents in production who would rather operate one platform than correlate four.
Stop guessing why your LLM app broke
See what your agents actually did in one place. Respan turns error spikes into incidents you can open, traces every prompt, tool call, and response, tracks cost and latency, and runs evals so you can go from a bad output to the exact step that caused it.
2. Dynatrace
Dynatrace is a SaaS full-stack observability platform that runs its Davis causation engine across metrics, logs, traces, and topology. OneAgent auto-discovers hosts, processes, and dependencies, which gives Davis an accurate service map to reason over, and root cause identification runs with little manual configuration. Coverage spans infrastructure monitoring, application performance, digital experience, and security, with OpenTelemetry ingest for custom telemetry.
Davis reasons about infrastructure causation, and infrastructure causation does not explain why an LLM output was wrong. Nothing in platforms like Dynatrace evaluates whether a completion was faithful to its retrieved context. There is no self-hosting. Per-host hourly billing is predictable for stable estates and much less so for workloads that scale with traffic.
Pricing is billed hourly against consumed resources and quoted monthly per host: around $7 for Basic, $29 for Infrastructure Monitoring, and $58 for Full-Stack Monitoring. Synthetics and real-user monitoring bill separately, and volume discounts apply at scale.
Best fit: Large hybrid estates that want automated root cause across infrastructure with minimal configuration.
3. Datadog
Datadog collects across infrastructure, applications, logs, network, and security in one SaaS platform, and Watchdog applies anomaly detection and correlation on top of that data. Because the telemetry is first-party, correlating an application slowdown to a downstream database timeout takes no additional wiring. Integration coverage is broad enough that most estates can standardize on it.
Every product bills as a separate meter, so the headline per-host price is a floor rather than a total. Hosts bill on the high-water-mark count for the month rather than the average, which inflates bills in autoscaling environments. APM cannot be purchased standalone and requires a paired Infrastructure plan on every host. The LLM module reports tokens, latency, and cost but does not score output quality, so software like Datadog detects a slow agent and not a wrong one.
Infrastructure Pro is $15 per host per month annually or $18 on-demand, Enterprise $23 annually or $27 on-demand. APM adds $31 per host on top of Infrastructure. Logs are $0.10 per GB ingested and $1.70 per million indexed events at 15-day retention, and a free tier covers 5 hosts.
Best fit: Teams that want one vendor across infrastructure, APM, and logs and can manage per-module cost discipline.
4. New Relic
New Relic is a SaaS observability platform that prices on data ingested and user seats rather than hosts, which removes host count as a cost variable entirely. Applied intelligence correlates incidents and reduces alert noise across APM, infrastructure, logs, distributed tracing, browser, mobile, and synthetics, all metering through the same ingest counter.
The two-axis model means seats can dominate the bill before data does, and the jump from Standard to Pro is steep for teams that outgrow five full platform users. LLM traces carry prompt and completion payloads that are large relative to typical spans, which makes ingest harder to forecast than the rest of the platform. Output quality is not evaluated.
The free tier covers 100 GB ingest, one full platform user, and 500 synthetic checks. Standard is $10 for the first full platform user and $99 for each additional up to five, plus $0.40 per GB beyond the free allowance. Pro is $349 per user annually with no seat cap, and additional synthetic checks run $0.005 each.
Best fit: Teams with large host counts and small numbers of full-access engineers, where per-host pricing punishes them.
5. Splunk ITSI
Splunk ITSI builds service models on top of Splunk's data platform, running on Splunk Cloud or Splunk Enterprise. It maps technical components to business services so incident impact is expressed in terms a service owner recognizes. Event analytics correlates notable events, predictive analytics uses historical KPI data to flag degradation before a threshold breaks, and it works across Cisco and third-party monitoring tools rather than requiring a rip and replace.
ITSI licenses separately from the underlying Splunk Cloud Platform, so the total is two line items rather than one. Cost is highly sensitive to ingest volume and search workload, which constrains broad observability use cases at high data volumes. Tools like Splunk handle monitoring and event context rather than ticketing, change management, or on-call workflow, so adjacent systems are still required, and setup complexity is significant.
Splunk publishes two pricing models and no rates for either. Workload pricing allocates license based on compute consumed, measured in Splunk Virtual Compute units. Ingest pricing bills on GB per day and is available up to 200 GB per day. Both require a sales conversation.
Best fit: Enterprises already standardized on Splunk that need service-level intelligence over data they are already ingesting.
6. IBM Cloud Pak for AIOps
IBM Cloud Pak for AIOps runs on OpenShift, on-premises or in cloud, and applies log and metric anomaly prediction models using entity linking alongside spatial, temporal, and topological algorithms to reduce event noise. It extends event analytics from Netcool Operations Insight and correlates across mission-critical hybrid workloads, with runbook automation for known failure modes and ChatOps integration for response.
Value depends heavily on existing investment in the IBM ecosystem, and implementation is complex enough to be over-engineered for straightforward requirements. Running on OpenShift is an infrastructure commitment in itself even with the restricted entitlement included. Coverage stops at model and infrastructure behavior, so AI application output quality falls outside it.
Licensing is modular and capacity-based, measured in virtual processor cores, with restricted Red Hat OpenShift included at no charge. No rates are published, and existing customers can apply entitlements or trade up rather than buying new.
Best fit: Large enterprises already running IBM infrastructure that need event correlation across a heterogeneous monitoring estate.
7. ServiceNow ITOM
ServiceNow ITOM is a SaaS suite sitting on the same platform as ITSM, which means correlated incidents flow directly into tickets, change records, and the CMDB without an integration in between. Discovery and Service Mapping populate the dependency graph, and Event Management correlates alerts against that graph into actionable incidents with clear ownership.
Licensing is by subscription unit tied to discovered nodes rather than users, so an autoscaling cloud estate inflates the unit count without anyone making a purchasing decision. ITOM Health, the event correlation and AIOps layer, licenses separately from ITOM Visibility, and teams routinely discover that mid-rollout. The platform is configured by an ITSM practice rather than self-served by an engineering team.
Subscription units are tied to discovered nodes, with each ITOM application drawing units differently against the same estate. No rates are published and all contracts are negotiated, which makes the finance and infrastructure teams rather than the service owner the ones controlling the bill.
Best fit: Enterprises already running ServiceNow for ITSM that want operations and service management on one platform.
8. BigPanda
BigPanda is a SaaS platform that sits above your existing tools rather than replacing them. The Open Integration Hub ingests alerts, change data, and topology, and correlation reduces that stream to incidents with probable cause attached. It spans four products: AI Incident Prevention for change risk assessment and problem discovery, AI Detection and Response for correlation, an L1 Agent that executes suppression and routing autonomously, and an AI Incident Assistant for major incident orchestration.
Because it correlates alerts from other tools, its ceiling is whatever those tools detected. A failure no monitor caught stays invisible. Credits do not roll over, so unused annual capacity is lost. The commitment structure and enterprise focus put it out of reach for smaller teams, and because it does not collect raw telemetry itself it is an addition to a monitoring stack rather than a consolidation of one.
Pricing runs on a universal credit system across all four products, with tiered plans starting at 20,000 credits on a one- to three-year commitment. Metering counts processed events, actioned incidents, change risk assessments, agent recommendations, and agent actions against one pool. No rates are published.
Best fit: Fortune 1000 IT operations teams with many monitoring tools already in place and alert volume manual triage cannot absorb.
9. LogicMonitor
LogicMonitor is a hosted platform covering hybrid estates from one console with agentless collection, automated discovery, and 3,000+ integrations. Edwin AI is the AIOps layer, using unsupervised ML and event enrichment to compress cross-domain alert storms into prioritized insights, with dynamic thresholds and dependency mapping underneath. MSP multi-tenancy is a first-class feature rather than an afterthought.
There is no self-hosted option. Pricing is quoted around a billing abstraction whose count you cannot calculate yourself, so the published rate does not tell you what you will pay until a scoping call maps your resources to units. Edwin AI's agents and automation remain add-ons even on the top package, and Essentials caps at 999 units before a forced upgrade.
Three packages bill per Hybrid Unit per month at minimum quantities on annual terms: Essentials at $16, Advanced at $27, and Signature with Edwin AI at $53. One Hybrid Unit equals one on-premises device, one cloud IaaS resource, seven cloud PaaS resources, five wireless access points, or seven Kubernetes pods. A 15-day trial covers any tier.
Best fit: Mid-market IT and MSP teams monitoring hybrid infrastructure that want AIOps without running the platform themselves.
10. OpenObserve
OpenObserve is a Rust-based open source platform storing telemetry on object storage, which is where its cost advantage over ingest-priced incumbents comes from. It covers logs, metrics, traces, frontend monitoring, session replay, and incident workflows in one binary or Helm chart, with SQL and PromQL querying, and runs self-hosted or as managed cloud. An AI SRE agent handles automated root cause investigation, and a separate LLM observability module covers AI application traffic.
The AI SRE agent and LLM observability module are newer than the core platform and thinner than the dedicated tools further down this list, particularly on output-quality evaluation. Query volume bills separately from ingestion, so wide searches across large datasets carry their own cost. Self-hosting means owning uptime, scaling, and storage for the system you rely on during incidents.
Cloud is pay-as-you-go at $0.50 per GB ingested and $0.01 per GB queried, reflecting a 30% annual-commitment discount, with 15 months of metrics retention and 30 days for logs, traces, and RUM included. Extending non-metrics retention costs $0.02 per GB per additional 30 days, and all cloud plans include unlimited users with no per-seat charge. The open source edition is free and Self-Hosted Enterprise is free up to 50 GB per day.
Best fit: Cost-sensitive teams with high log volume that want ingestion-based pricing and a credible self-hosted path.
11. PagerDuty
PagerDuty is a SaaS incident response platform that owns what happens after detection: on-call schedules, escalation policies, incident workflows, and post-incident review, across 750+ integrations. The AIOps module adds intelligent alert grouping trained on each service's own alert history, content-based and global grouping across services, auto-pause for flapping alerts that self-heal, and probable origin from correlated incident patterns. Change correlation ties incidents to the deploy that likely caused them.
The noise reduction the category is named for is not in any base tier. AIOps is an add-on billed per accepted event on top of per-user pricing, and it requires at least one paid Professional or Business seat before it can be purchased at all. Every person on the account is a paid user, including anyone who only receives notifications, and status pages, stakeholder licenses, and generative AI features each bill separately.
Free covers up to 5 users. Professional is $21 per user per month billed annually or $25 monthly, Business is $41 annually or $49 monthly, and Enterprise is custom. AIOps starts at $699 per month annually or $799 monthly, licensed per accepted event, with stakeholder licenses at $150 per 50 per month and status pages from $89 per 1,000 subscribers per month.
Best fit: Teams whose bottleneck is response coordination rather than detection, with alert volume high enough to justify the AIOps add-on.
12. Arize
Arize captures AI systems as spans and monitors them for drift and degradation across both classical ML and LLM workloads, running as managed SaaS or self-hosted through Phoenix. Phoenix, the open source component, runs in a notebook, locally, or via Docker with no external dependencies, which makes it usable during development rather than only after deploy. Instrumentation uses OpenInference, built on OpenTelemetry, covering LlamaIndex, LangChain, Haystack, DSPy, and smolagents.
The LLM evaluation layer is the shallower part of a product built for model monitoring first. Custom evaluators are supported, research-backed built-in metrics for faithfulness and hallucination are not. Billing runs on two axes, spans and ingestion volume, which compounds and makes forecasting harder than a single meter. Retention caps at 30 days below Enterprise, short for retrospective investigation.
AX Free is $0 with 25,000 spans, 1 GB of ingestion, and 15 days of retention. AX Pro is $50 per month with 50,000 spans, 10 GB, and 30 days, with additional spans at $0.0008 each and extra ingestion at $3 per GB. Enterprise is custom, and Phoenix is free and self-hosted.
Best fit: Organizations running both classical ML and LLM workloads that would rather not add a second vendor.
13. Galileo
Galileo scores LLM outputs at the call level against defined criteria on production traffic rather than a fixed test set, with hallucination detection, eval automation at scale, and audit workflows. It runs as SaaS, with VPC and on-premises deployment on Enterprise, and traces, analytics, and role-based access control come in above the free tier.
Runtime guardrails sit behind Enterprise pricing, so the entry tiers measure without intervening. Enterprise carries no published number, which stops teams with fixed budgets at exactly the point the product becomes preventative. The product is built around governance and audit workflows, so the developer experience is thinner than platforms designed for engineers debugging production. Reporting suggests Cisco acquired Galileo and folded it into Splunk Observability, though this could not be confirmed from Cisco, Splunk, or Galileo directly.
The free plan covers 5,000 traces per month without role-based access control. Pro is $150 per month billed annually covering 50,000 traces with standard RBAC, advanced analytics, and dedicated Slack support, scaling with trace volume above that. Enterprise is custom and adds unlimited traces, real-time guardrails, enterprise RBAC and SSO, deployment options, and 24/7 support.
Best fit: Teams that need production output scoring and audit-ready quality reporting, subject to confirming current ownership.
14. Fiddler AI
Fiddler AI monitors drift and quality across classical ML and LLM systems and layers explainability on top: local and global explanations for model behavior, embedding clustering to surface patterns in outputs, and runtime guardrails for safety policy. It deploys as SaaS, VPC, or on-premises. In regulated settings where "the model decided" is not an acceptable answer to an auditor, that explainability layer is the reason to evaluate it.
The explainability heritage for tools like Fiddler is classical ML, so LLM-specific tooling is less mature than in platforms built for LLM workloads first. Per-trace pricing behaves badly for agent workloads, since one agent run can generate dozens of traces and the bill scales with architectural complexity rather than user volume. Above the Developer plan, pricing is consumption-based with an annual commitment and no published rates.
A free plan covers evaluation. The Developer plan bills at $0.002 per trace, so 500,000 traces a month runs $1,000 before any other line item. Higher tiers are consumption-based on ingestion and trace volume with an annual commitment and no month-to-month option.
Best fit: Financial services, healthcare, and other settings where model decisions need defending to a regulator.
15. LangSmith
LangSmith ships from the LangChain team as a managed platform, with self-hosting on Enterprise only. Traces render the full execution tree including tool selections, retrieved documents, and model parameters. Annotation queues route specific traces to domain experts for labelling, and that output feeds evaluation datasets directly.
The value concentrates inside one ecosystem. It works with any framework through a traceable wrapper, but trace depth outside LangChain and LangGraph is noticeably thinner, which makes it a bet on a framework as much as a platform. Built-in evaluation metrics are limited, so LLM-as-judge scoring is mostly custom work. Seat pricing discourages exactly the cross-functional access that makes annotation queues valuable, and base trace retention is short enough that investigating an incident weeks later may find nothing.
A free developer tier covers evaluation. Paid plans start around $39 per seat per month with Enterprise custom, and trace volume meters separately from seats.
Best fit: Teams whose stack is LangChain today and will still be LangChain in two years.
16. Langfuse
Langfuse is a tracing backbone with prompt management attached, self-hostable under an MIT-licensed core or run as managed cloud. The open source build is usable in production rather than a limited demo, OpenTelemetry support is solid, and the trace UI handles multi-step runs without falling over. Callback handlers cover the OpenAI SDK, LangChain, LlamaIndex, LiteLLM, the Vercel AI SDK, Haystack, and Mastra.
Langfuse logs traces and does not score them. There are no built-in metrics for faithfulness, relevance, or hallucination, so quality monitoring means writing LLM-as-judge logic or paying for a second tool. There is no native alerting on quality degradation either, which means the platform records a regression accurately and tells nobody. Self-hosting in production is Postgres plus ClickHouse plus application containers, so free is a licensing statement rather than a cost statement. ClickHouse acquired Langfuse in January 2026 and roadmap direction under new ownership is not yet clear.
Self-hosting the MIT core is free in licensing and costs whatever the infrastructure costs. Managed cloud has a free tier, paid plans from around $29 per month, and Enterprise from roughly $2,499 per year.
Best fit: Teams with data residency requirements and the appetite to build their own evaluation layer.
17. Braintrust
Braintrust treats evaluation as the product, running as managed cloud with self-hosting on Enterprise. Datasets, scoring functions, comparison reports, and regression testing are all first-class, and experiment comparison across prompt versions is more rigorous than anything else on this list. Scoring covers LLM-as-a-judge, autoevals, custom code scorers, classifiers, and human review, with online scoring against production traces.
Tracing exists to serve the eval workflow, so it is less developed than in tools built for production debugging. Routing policies do nothing until the evaluation setup exists, which makes time to first useful signal longer than on any detection-first tool here. Enterprise pricing is not disclosed, and tier escalation tends to arrive earlier than teams plan for, because eval volume grows with the test suite rather than with traffic.
A free Starter tier covers 1 GB of processed data, 10,000 scores, and unlimited users. Pro is a flat $249 per month rather than per seat, which takes seat-count negotiation out of procurement, and Enterprise is custom.
Best fit: Teams where eval discipline is the constraint rather than incident detection.
18. Portkey
Portkey is an AI gateway that adds governance and routing controls between an application and model providers, available as managed cloud, self-hosted through the open source gateway, or managed VPC on Enterprise. Conditional routing keys off request metadata and user attributes, with fallbacks, retries, request timeouts, circuit breakers, load balancing, and simple and semantic caching. Guardrails and PII redaction run before requests reach providers. Palo Alto Networks has completed its acquisition of Portkey and the gateway is becoming the AI layer inside Prisma AIRS, which points the roadmap at enterprise runtime security.
Conditional routing for tools like Portkey is only as current as the rules someone last wrote, and no measured-output signal feeds the policy. Evaluation is thin next to a dedicated eval platform. Log retention on the Production tier runs 30 days, short against the retention periods regulated industries need, and custom retention is an Enterprise conversation.
The free Developer tier covers 10,000 logs per month at 3-day retention, and Portkey's own pricing page says it is not suitable for production. Production is $49 per month for 100,000 recorded logs at 30-day retention, plus $9 per additional 100,000 requests up to 3M. Enterprise is custom and covers 10M+ logs, VPC hosting, SSO, granular budgets, custom retention, and BAA signing.
Best fit: Teams that want gateway-level guardrails and spend controls at a low entry price and handle evidence retention separately.
19. Helicone
Helicone instruments by proxy and can be self-hosted or run as managed cloud. Change the base URL and tracing, caching, and cost analytics arrive without touching application code, which for years was the fastest path from zero to observability available.
Mintlify acquired Helicone on 3 March 2026 and the platform is in maintenance mode, defined by the team as security updates, bug fixes, performance fixes, and new model support, with feature development ended and migration help offered. Separately from the acquisition, proxy instrumentation is request-shaped: it sees calls passing through it, not the reasoning or tool steps between them, so agent chains are largely invisible. For most tools like Helicone, the proxy also sits in the critical path, which means their failure mode is your failure mode.
Hobby is free with 10,000 requests per month and one seat. Pro is $79 per month with unlimited seats, alerts, and reports. Team is $799 per month and adds SOC 2 and HIPAA, and Enterprise is custom with on-prem deployment.
Best fit: Existing deployments, with a migration plan.
20. Traceloop
Traceloop is a managed backend for OpenLLMetry, its Apache 2.0 OpenTelemetry instrumentation layer for LLM applications, deployable in cloud, on-premises, or air-gapped environments. Because the SDK emits standard OTel spans, instrumentation written once can flow to Traceloop or to any OTel-compatible backend, which is the lowest lock-in position on this list. The platform layers quality evaluators for faithfulness, relevance, safety, and PII detection on top, along with drift monitoring and CI/CD quality gates.
Retention on the free tier is 24 hours, which makes it a debugging surface rather than a monitoring system unless you pay. Paid tiers are not published, so budgeting requires a sales conversation. The product is a tracing and evaluation backend with no gateway, so routing, failover, and spend control are a separate purchase and a separate system to correlate against.
The free tier covers 50,000 spans per month with all features open and no seat limit, where every LLM call and every vector database call counts as a span. Paid tiers, longer retention, and on-premises deployment are quoted rather than published.
Best fit: Teams already running an OpenTelemetry stack that want LLM spans flowing into it without adopting a proprietary SDK.
How to Choose an AIOps Platform
Most teams compare feature lists first and hit the constraints later, which wastes an evaluation cycle. Here are the criteria that narrow twenty options down to a shortlist of two or three:
-
Name the failure you are trying to catch. Alert storms and slow services are one problem, and correlation platforms solve it. Wrong answers returned with a 200 status code are a different problem, and nothing in the infrastructure half of this list detects them. Teams running both need coverage on both, and the two rarely come from one vendor.
-
Check what the platform ingests before trusting what it claims to detect. A correlation platform consuming alerts from other tools inherits their blind spots, so a failure no monitor caught stays invisible. A suite collecting its own telemetry sees more but is a bigger migration. An AI application platform captures prompts, tool calls, and responses that neither of the others records.
-
Ask which correlation mechanism is running. Time-based grouping is cheap and inaccurate on a large estate. Topology-aware causation needs a maintained dependency map. Trained models need months of alert history before they earn their place. All three get sold under the same phrase.
-
Test whether alerts can be scoped to the slice you own. An organization-wide threshold pages constantly and gets muted inside a week. Conditions on service, environment, model, or team are what make alerting survive a real rotation.
-
Settle deployment and data residency before features. Self-hosting, air-gapped options, and certification coverage eliminate whole sections of this list immediately, and finding that out after a proof of concept costs a quarter.
-
Model cost at the volume you expect, not the volume you have. Per host, per user, per GB, per event, per span, and per credit diverge sharply at scale. The cheapest option during a pilot is frequently the most expensive one a year later, and several platforms here meter on two axes at once.
Whichever way it lands for you, run a pilot on real production traffic before committing. Correlation accuracy, instrumentation effort, and cost at volume are all difficult to judge from a pricing page, and every platform here looks equally capable in a demo.
FAQs
What is the difference between AIOps and MLOps? AIOps vs MLOps
AIOps applies machine learning to operations data so IT and engineering teams can find and fix problems faster. MLOps applies engineering discipline to machine learning itself: training pipelines, model registries, versioning, deployment, and retraining. AIOps uses AI to run software. MLOps runs the software that produces AI. They meet at model monitoring, where a drifting production model is both an MLOps concern and an operational signal, which is why platforms like Arize and Fiddler appear in conversations about both.
What is the difference between AIOps and DevOps? AIOps vs DevOps
DevOps is a practice, not a product category. It describes how teams build, ship, and own software: shared responsibility between development and operations, automated delivery, and fast feedback from production. AIOps is tooling that serves that practice. A team without DevOps tools or the culture for it can buy an AIOps platform and still route every incident through a ticket queue. The relationship is that AIOps handles the part of operations that stopped scaling with human attention, which is triage across an estate too large to read.
What is the difference between AIOps and observability? AIOps vs Observability
Observability is the property of a system: whether its outputs let you determine what is happening inside it without shipping new code. Achieving it means instrumenting for logs, metrics, and traces. AIOps is what you do with that data once there is more of it than anyone can look at. Observability gives you the ability to answer questions. AIOps decides which questions are worth asking right now. In practice most vendors sell both, and the useful distinction when evaluating one is whether it collects telemetry, reasons over it, or does both.
Do AIOps tools replace monitoring tools?
Sometimes, and it depends on which shape you buy. Full observability suites like Dynatrace, Datadog, and OpenObserve collect telemetry themselves, so they can replace what you run today. Correlation platforms like BigPanda and Splunk ITSI sit above your existing tools and consume their alerts, which means they add a layer rather than remove one. That distinction matters for budgeting, because the second group is an addition to your monitoring spend and the first is a potential consolidation of it.
What data do AIOps tools need to work?
Correlation quality depends on more than alert volume. The inputs that make the difference are topology, so the platform knows which services depend on which, change events from CI/CD, so an incident can be tied to the deploy that caused it, and enough alert history for a trained model to learn what normal looks like on each service. A platform fed only raw alerts with no topology and no change data will group by time and content, which is the weakest form of correlation available. Expect useful output in weeks rather than days.
Can AIOps tools monitor LLM applications and AI agents?
Infrastructure AIOps platforms see LLM traffic as HTTP requests. They report latency, error rate, and token counts, which covers whether the call succeeded and nothing about whether the answer was right. An agent that loops through unnecessary tool calls, retrieves nothing useful, and returns a confident wrong answer produces a clean 200 at normal latency, and no amount of infrastructure correlation surfaces it. Catching that requires capturing the prompt, the tool calls, the retrieved context, and the response, then scoring the output against faithfulness, relevance, and safety criteria on live traffic. That is what the AI application platforms in this list do and the infrastructure platforms do not.