A team ships a support agent. It calls a frontier model, retrieves from a vector store, runs two internal tools, and answers. Six weeks later the answers are noticeably worse, nobody can say when the decline started, and the MLflow instance the company already pays for has nothing useful in it, because nothing was ever trained.
That gap is the reason the MLOps tools question is harder now than it was three years ago. The category was built around a specific assumption: that the model is an artifact your team produced, from data your team controlled, in a run your team can go back and repeat. Experiment tracking, data versioning, feature stores, and the model registry all exist to serve that one goal, and they serve it well.
If your model is an API call, none of that applies. There is no training run to track, no dataset to version, and no weights to register. What you own is what happened at request time, and capturing that is observability work rather than lifecycle work.
Most teams now run both kinds of system at once, which is why the stack looks messy. This guide covers 15 MLOps tools and platforms across five stages, what each one actually costs, and which stages apply depending on whether you trained the model or rented it.
What Is MLOps?
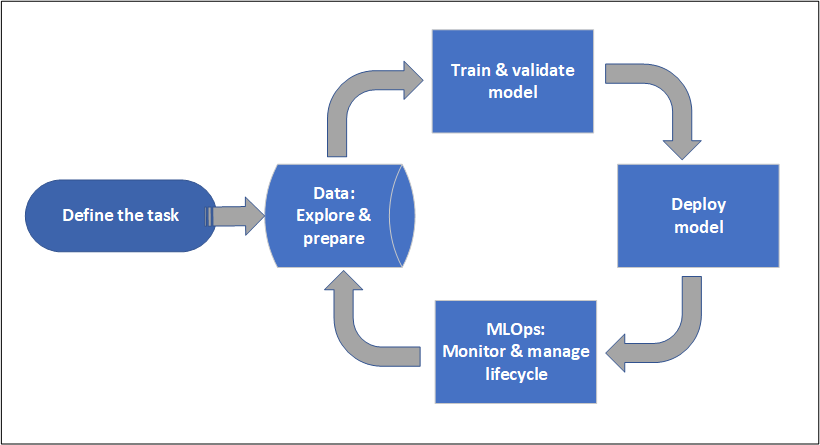
MLOps is the set of practices that takes a machine learning model from a notebook into production and keeps it working there. It borrows continuous integration and continuous delivery from DevOps and adds two things software deployment never needed: continuous training, because model performance decays as the world changes, and continuous monitoring of output quality rather than only uptime.
The practical unit of MLOps is reproducibility. A model in production is the output of a specific dataset, a specific set of hyperparameters, a specific code version, and a specific training run. When that model misbehaves, the work is walking backwards through those links until you find the one that changed. Every category of MLOps tooling exists to keep one of those links intact.
MLOps Examples
Example 1
A fraud detection model at a payments company retrains weekly on labeled transactions. The pipeline pulls the last 90 days of data, versions the training set, runs the training job, scores the candidate against a holdout, promotes it to the registry if it beats the incumbent, and deploys behind a canary. Drift monitors watch the input feature distributions and alert when transaction patterns shift enough that the model's assumptions no longer hold.
Example 2
A demand forecasting model at a retailer runs the same loop on a monthly cadence, with the added complication that ground truth arrives weeks late. Performance cannot be measured in real time, so the monitoring layer estimates it from input drift and confidence distributions until the labels catch up.
Example 3
A customer support agent at a SaaS company calls a hosted model, retrieves from internal documentation, and uses tools to look up account state. There is no training run, no dataset, and no retraining cadence. The operational questions are which step in a multi-turn run produced a wrong answer, whether output quality is holding, and what each conversation costs. Those are the same concerns the first two examples have, arriving through a completely different mechanism.
Why Is MLOps Needed?
Models fail differently from software. A service that breaks returns a 500 and pages somebody. A model that breaks returns a confident, well-formed, plausible answer that happens to be wrong, and every dashboard stays green while it does. Without instrumentation built for that failure mode, the first signal is a customer complaint.
The second reason is that machine learning work is difficult to reproduce by default. A notebook that produced a good result last quarter may not produce it again, because the data moved, a library version changed, or a hyperparameter lived only in someone's terminal history. Teams without versioning discipline end up unable to explain their own production system.
The Benefits of MLOps
Faster iteration - Automating the path from training to deployment removes the manual handoffs where weeks disappear, and it makes shipping a model change a routine event rather than a project.
Reproducibility - Versioned data, code, and artifacts mean any production model can be traced back to the exact run that produced it, which matters for debugging and for audits.
Earlier failure detection - Monitoring on model behavior rather than service health surfaces degradation while it is still affecting a small fraction of traffic.
Cost control - Training compute and inference spend are both easy to lose track of, and attribution by model, job, or feature is what makes them manageable.
Regulatory readiness - Lineage records, approval trails, and performance history are what an AI governance framework asks for, and retrofitting them after the fact is far harder than capturing them as you go.
Where the MLOps Model Breaks Down
One of the most prominent places you see the MLOps model break down is drift detection. In classical MLOps, drift is a well-defined statistical operation: compare the distribution of this week's input features against the training distribution, run a Kolmogorov-Smirnov test or a population stability index, alert past a threshold. It works because features are numbers with distributions, and because a shift in those numbers reliably precedes a drop in accuracy.
None of that transfers to an agent. The distinction between observability vs monitoring matters more here than anywhere else in the lifecycle, because there is no feature distribution on a natural-language input and no equivalent of a labeled holdout to score against. When an LLM application degrades, the inputs stay within normal range while the answers get worse, so nothing in a drift dashboard fires.
Catching it means scoring the outputs themselves against criteria like faithfulness, relevance, and task completion, and running that scoring on live production traffic rather than an offline set assembled by hand. That scoring needs something to run against, which is the full record of each request: the prompt, the retrieved context, every tool call, the response, the latency, and the cost. Which is to say the monitoring stage does not just move earlier in the lifecycle. It becomes an instrumentation problem, and the classical monitoring tools were not built to solve it.
15 Best MLOps Tools and Platforms
The MLOps tools below are grouped by lifecycle stage. Teams running trained models will use most of these stages, teams building on hosted models will find the first and fourth do nearly all the work, and the middle three apply only where there is something of your own to train, version, and ship.
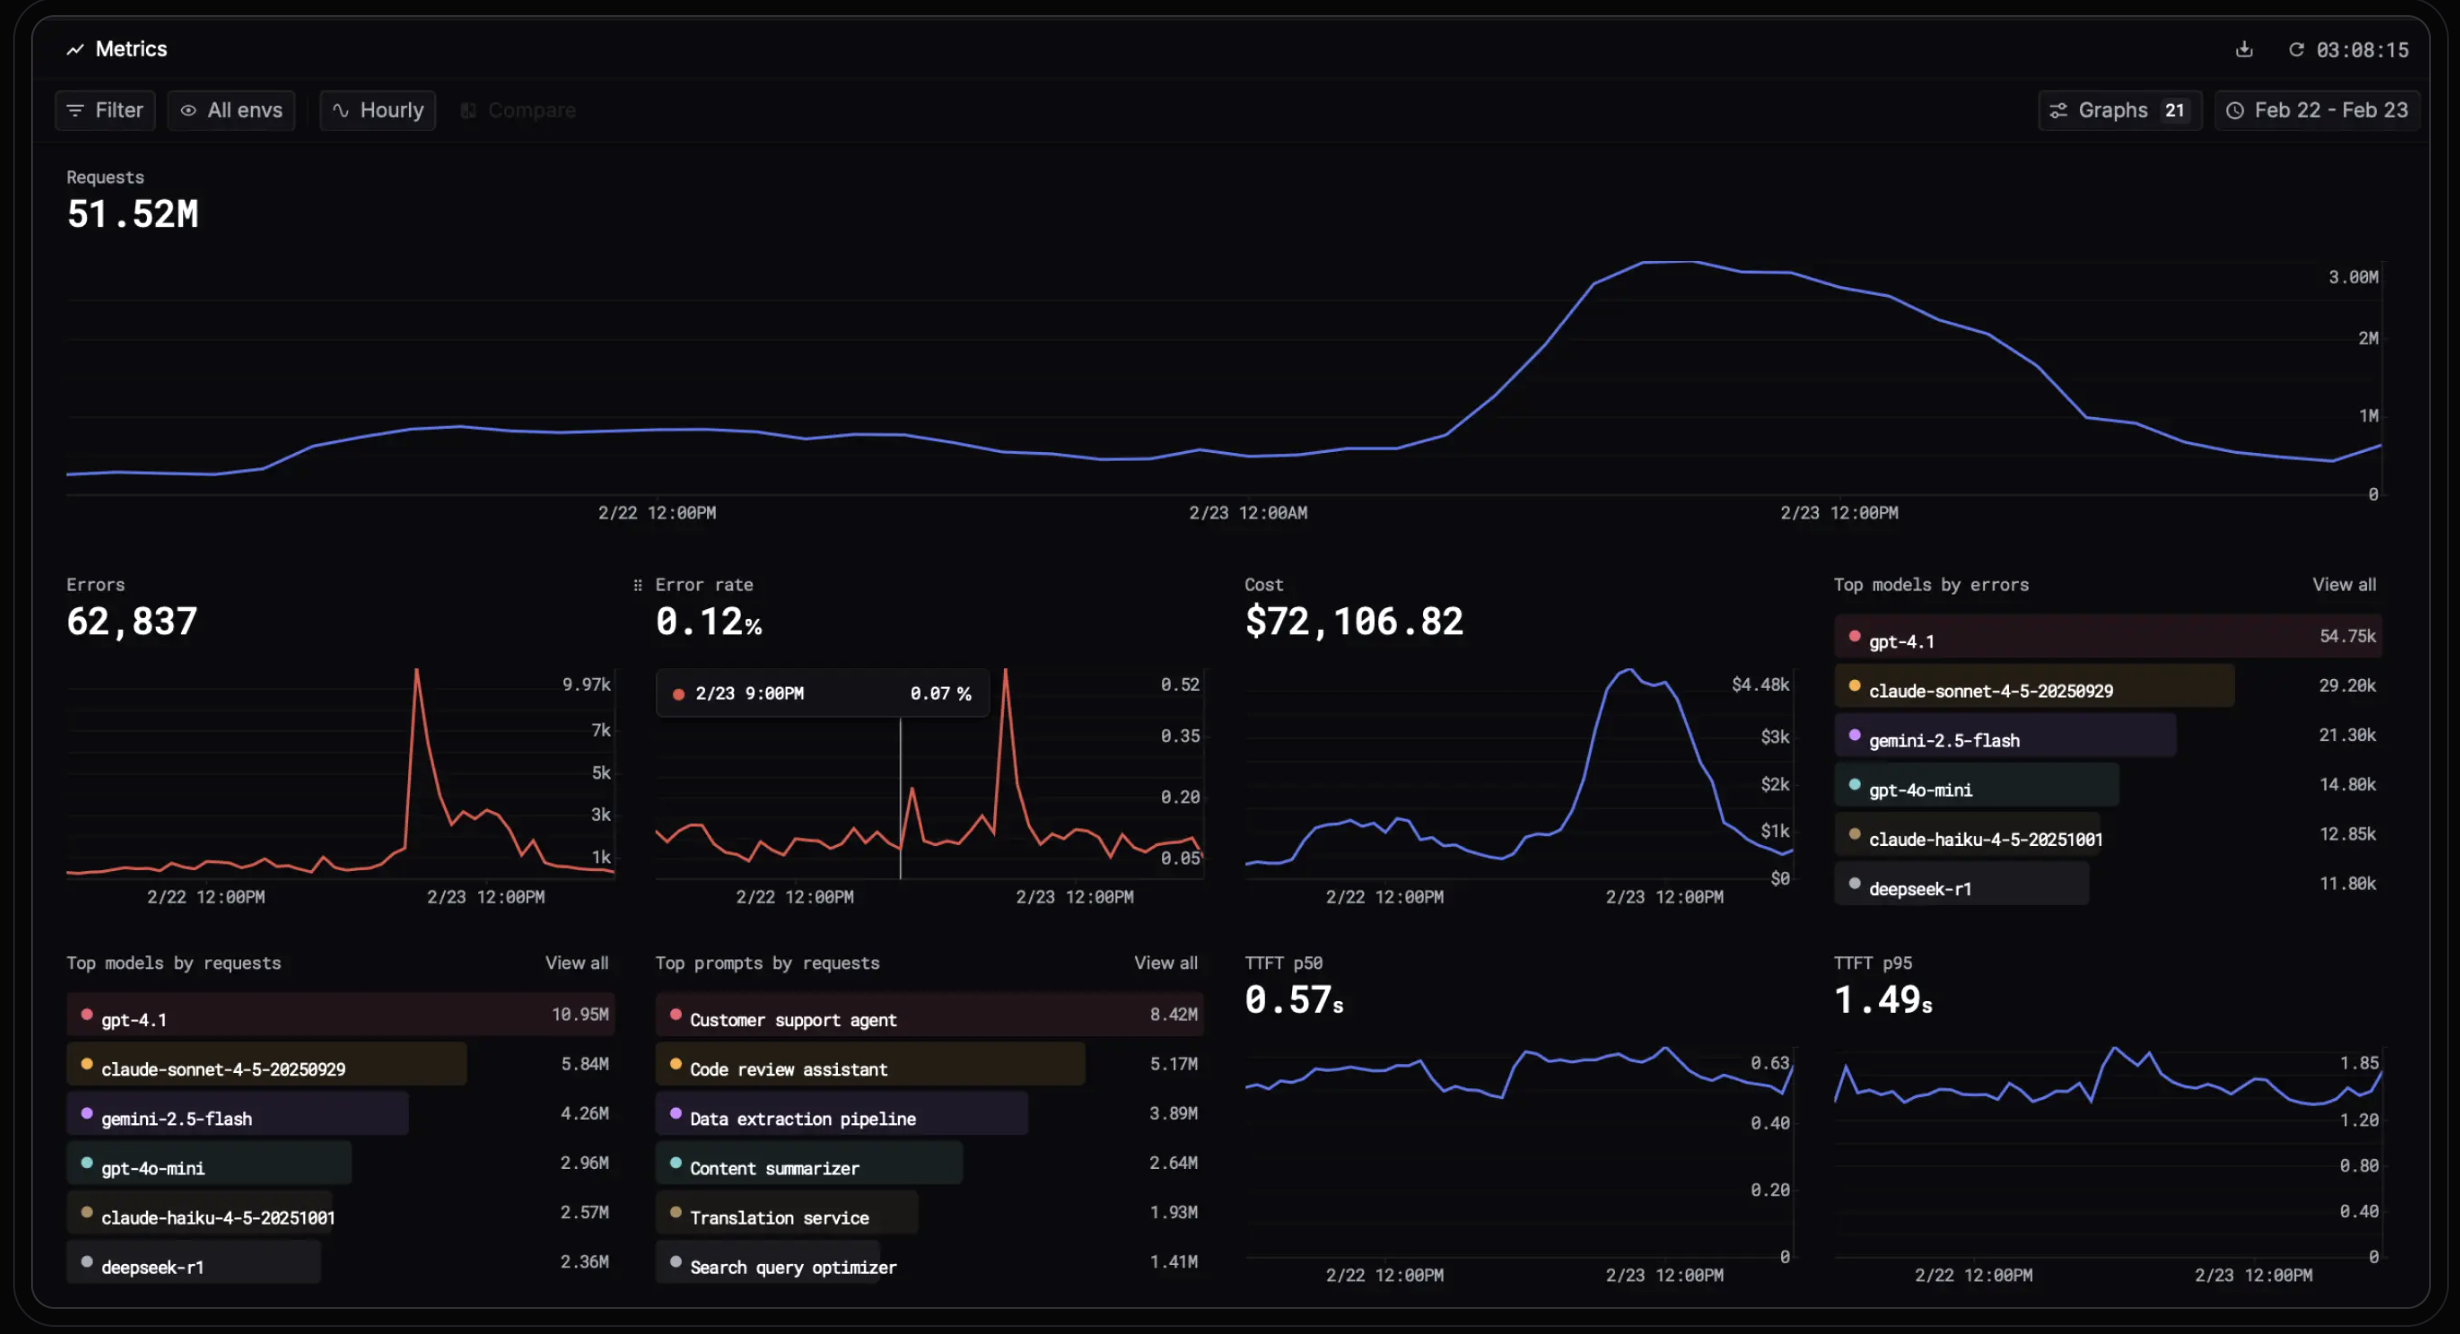
This is the stage that did not exist when the MLOps category was named, and it is where teams building on hosted models spend nearly all their operational effort. The job is capturing what an application did on each request and scoring whether the result was any good, which is why the roster here overlaps with AI agent monitoring and the dedicated LLM observability tools category rather than with anything in the training stack.
1. Respan
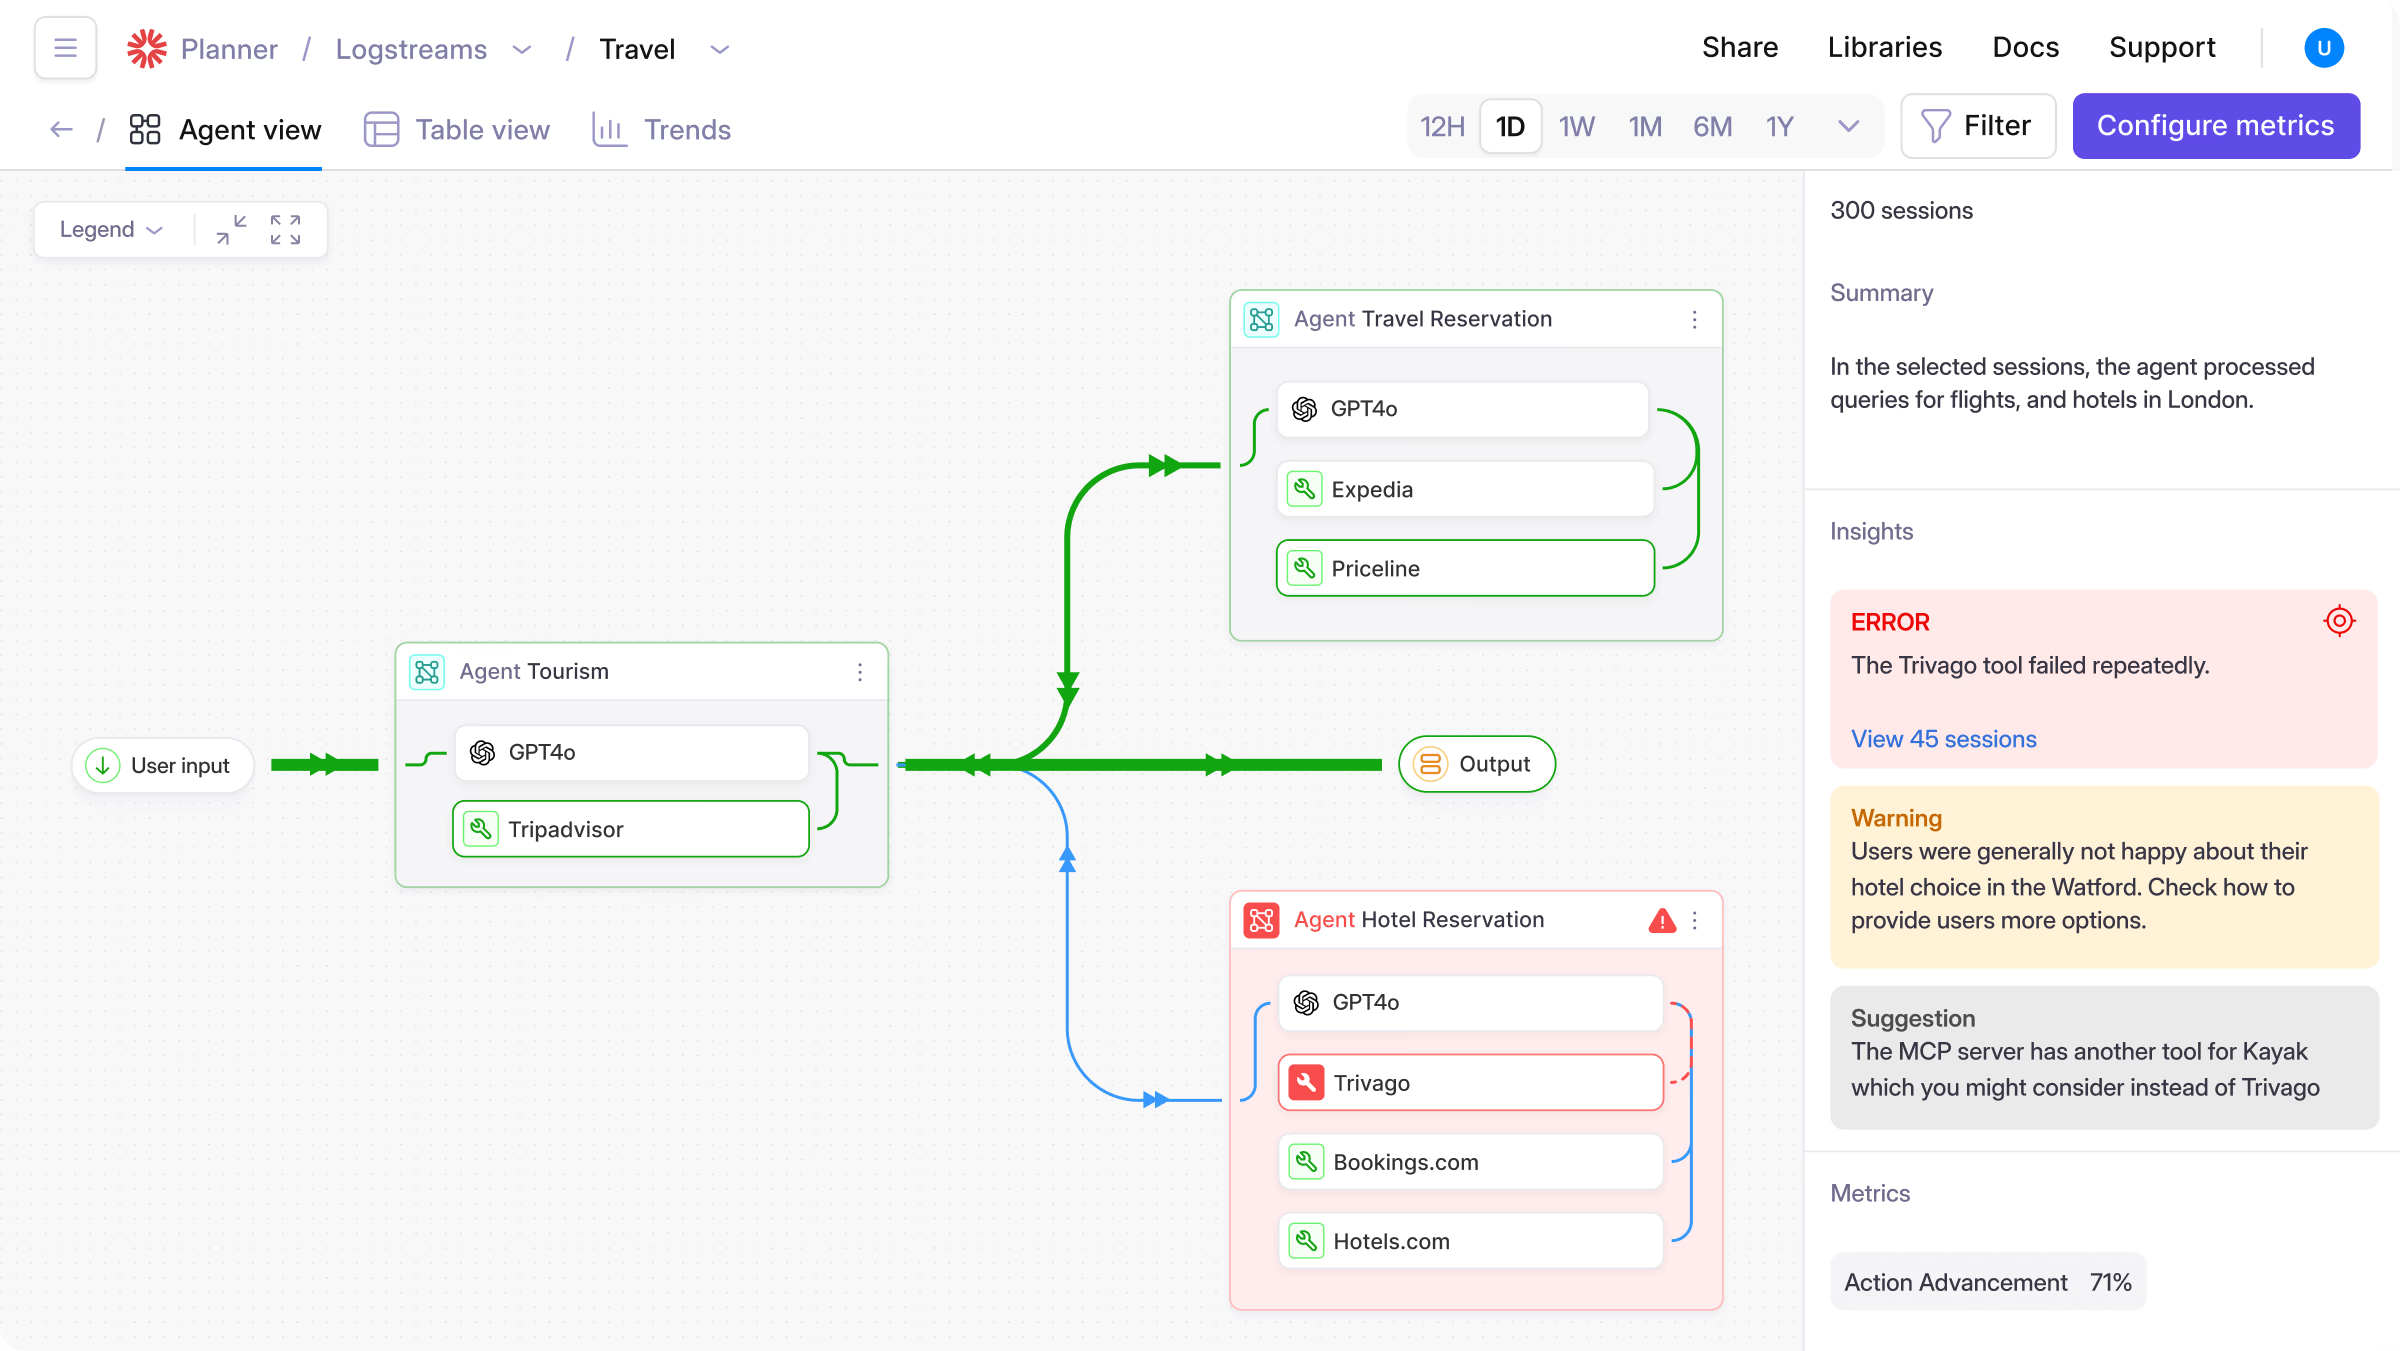
Respan runs tracing, evaluation, prompt management, and model routing on one platform, so the metric and the run behind it are the same object. Route, observe, and evaluate every LLM call. Instead of reading logs after the fact, teams use Respan to run observability in production, know when production shifts, and act before it spreads.
Pros:
See what the agent actually did - Every LLM call, tool run, retrieval, and agent turn becomes a span in one nested trace, each with its own input, output, latency, and cost.
Measure quality with scores, not vibes - LLM judges, deterministic code checks, and human review compose into a single evaluator, and the same evaluator deploys on live production spans so regressions surface in real time.
Close the loop in one place - A bad score becomes a dataset, an experiment, a prompt version, and a proven fix without leaving the platform or correlating across four vendors.
Ship prompts without shipping code - Templates with variables, committed and compared versions, and instant deployment, with no redeploy needed to change a prompt.
Stay up when providers fail - One endpoint reaches 1,000+ models with automatic failover, retries, and load balancing, and switching models is a one-word change.
Know where every dollar goes - Cost broken down by model, request, and end customer, with monitors and hard spend limits that block requests rather than just warning.
Audit your own agents - Red team campaigns probe for prompt injection, system-prompt leakage, and goal hijacking against the same connected agent you already trace.
Cons:
The Free tier caps at 100k logs, 1k scores, 5 datasets, 2 evaluators, and 5 prompts, with 7-day retention.
SAML SSO and a HIPAA BAA are Enterprise features rather than self-serve.
Pricing: Free covers 100k logs, 1k scores, and 7-day retention. Team is $199/mo billed yearly and lifts datasets, evaluators, and prompts to unlimited with 10k scores, 30-day retention, and a 99.9% uptime SLA, with overages at $8 per 100k logs. Enterprise adds custom retention and 99.99% uptime.
Best fit: engineering teams running agents or LLM features in production who would rather debug one system than correlate four.
Trace, evaluate, and improve your agents in one platform
Respan captures every prompt, tool call, and response as a single trace, scores output quality on live traffic, and routes across 1,000+ models with automatic failover. Get started for free.
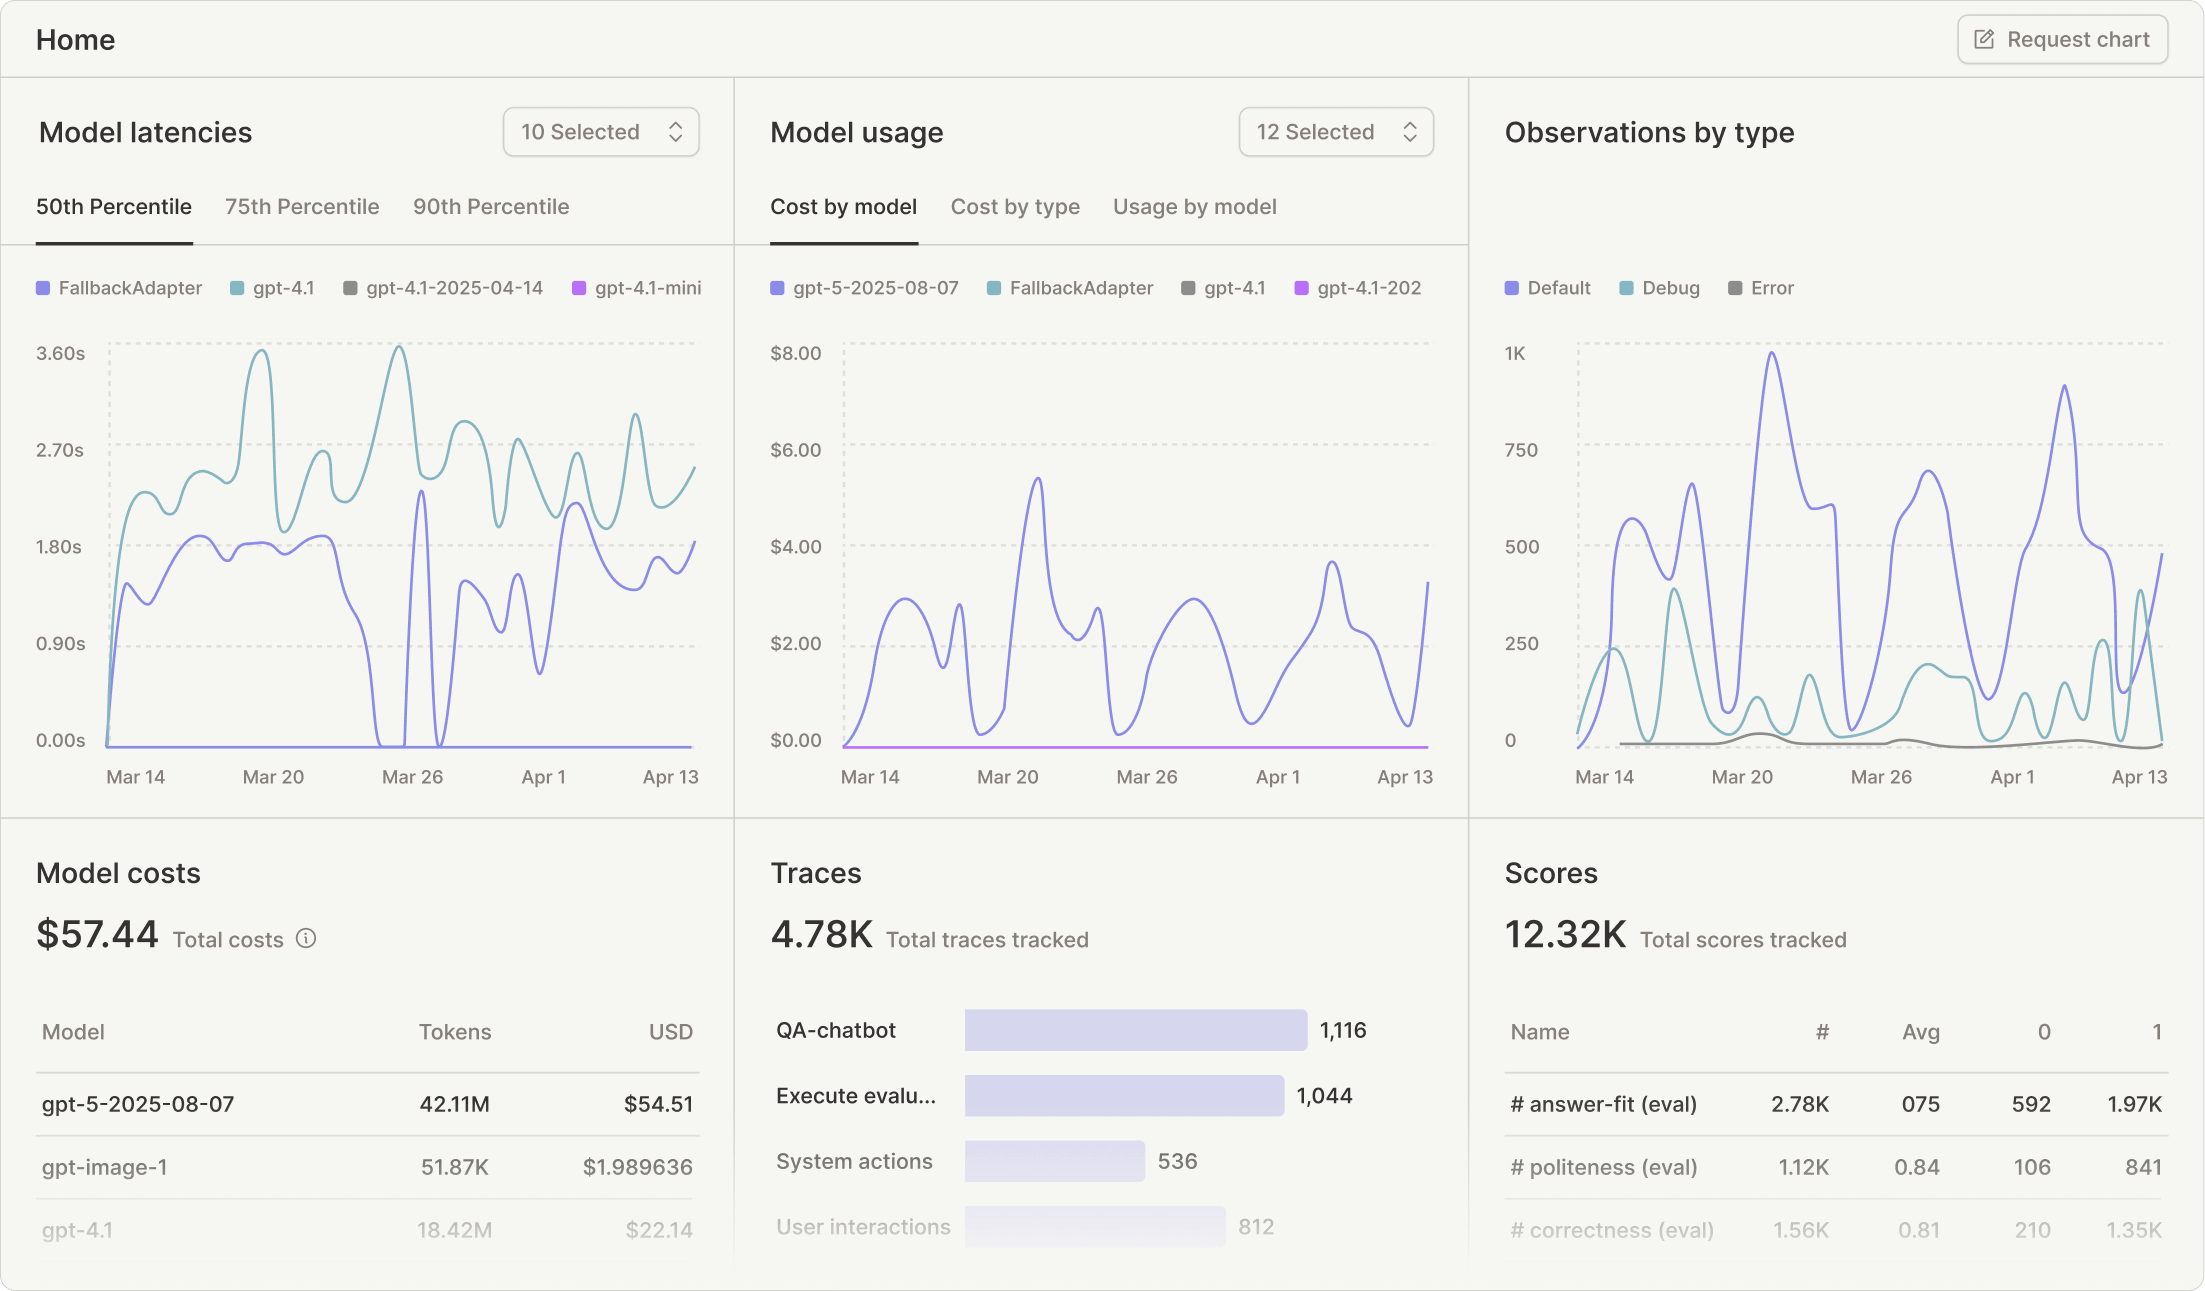
Langfuse is a tracing backbone with prompt management attached, distributed under an MIT license with a core that runs in production rather than as a limited demo build.
Pros:
Self-hosting is real, not a trial. The MIT core carries the full tracing feature set.
OpenTelemetry support is solid, and the trace UI handles multi-step agent runs without degrading.
Callback handlers cover the OpenAI SDK, LangChain, LlamaIndex, LiteLLM, the Vercel AI SDK, Haystack, and Mastra.
Cons:
Tools like Langfuse record traces and don't score them. No built-in metrics for faithfulness, relevance, or hallucination, so quality monitoring means writing LLM-as-judge logic or buying a second tool.
No native alerting on quality degradation, which means a regression gets recorded accurately and reported to nobody.
Production self-hosting is Postgres plus ClickHouse plus application containers, so free is a licensing statement rather than a cost statement.
Pricing: the MIT core costs nothing to license and whatever the infrastructure costs to run. Managed cloud has a free tier, paid plans from around $29 per month, and Enterprise from roughly $2,499 per year.
Best fit: teams with data residency requirements and the appetite to build their own evaluation layer.
3. Arize
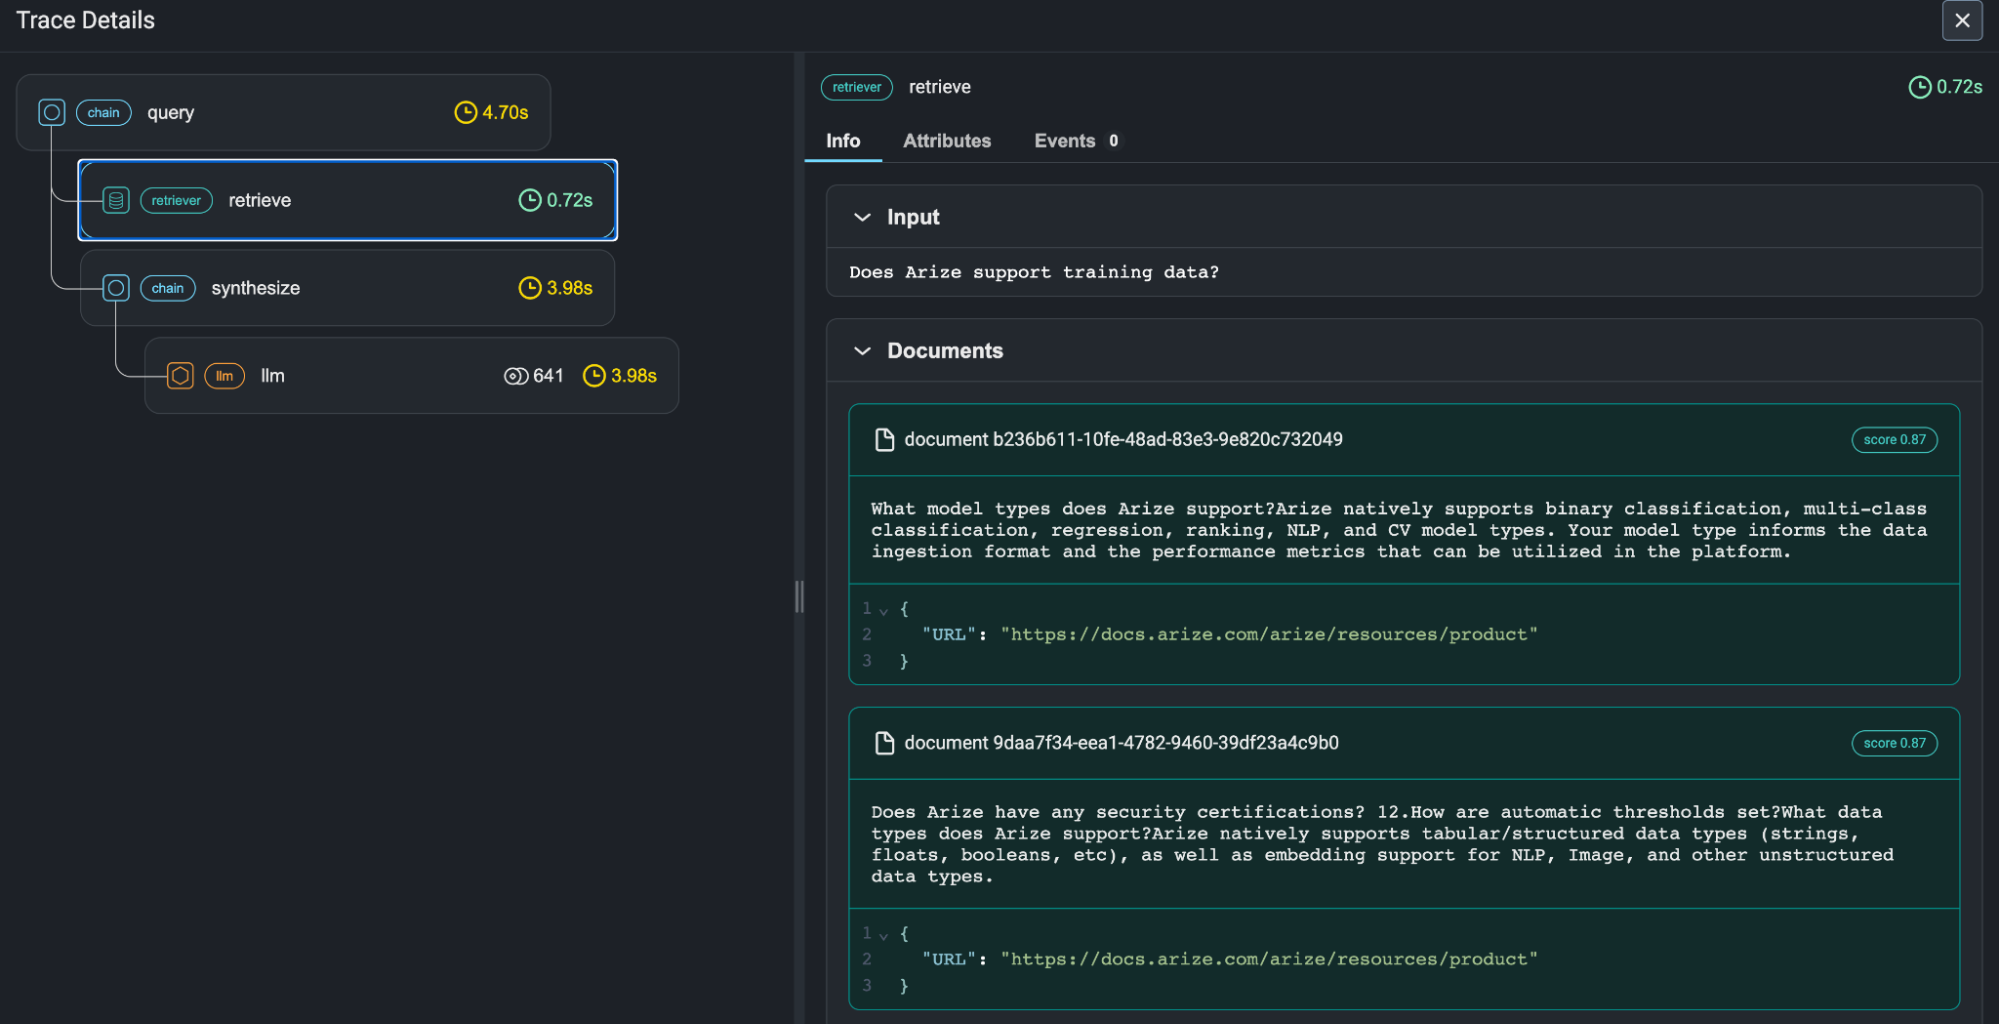
Arize built a classical ML observability product and extended it into LLM workloads, and it ships in two forms: Phoenix, the open-source tracing library, and Arize AX, the managed platform. Phoenix runs in a Jupyter notebook, locally, or in Docker with no external dependencies, which makes it usable during development rather than only after deploy.
Pros:
No infrastructure required to start. A notebook and a pip install get you traces.
Instrumentation uses OpenInference on OpenTelemetry, covering LlamaIndex, LangChain, Haystack, DSPy, and smolagents.
Embedding clustering and drift analysis carry over from the classical ML product, which is unusual in a tool used for LLM tracing.
Cons:
Evaluation is the shallow part of the product. Custom evaluators are supported, built-in research-backed metrics for faithfulness and hallucination are not.
Prompt versioning is limited compared with tools built around the prompt lifecycle.
The interface assumes an engineer, which excludes the domain experts who usually know whether an output was wrong.
Moving from Phoenix to managed AX brings short retention on lower tiers and cost tracking that leans on token counts rather than dollars.
Pricing: Phoenix is free under the Elastic License 2.0 and self-hosted. Managed Arize AX has a capped free tier and paid plans from around $50 per month.
Best fit: ML teams who already run Arize for classical models and want LLM tracing without adding a vendor.
Experiment Tracking and Model Versioning
Everything in this stage answers the same question: what produced this result, and can it be produced again. These tools only earn their keep when your team owns the training run, which is why this is the first stage to become irrelevant for teams building on hosted models.
4. MLflow
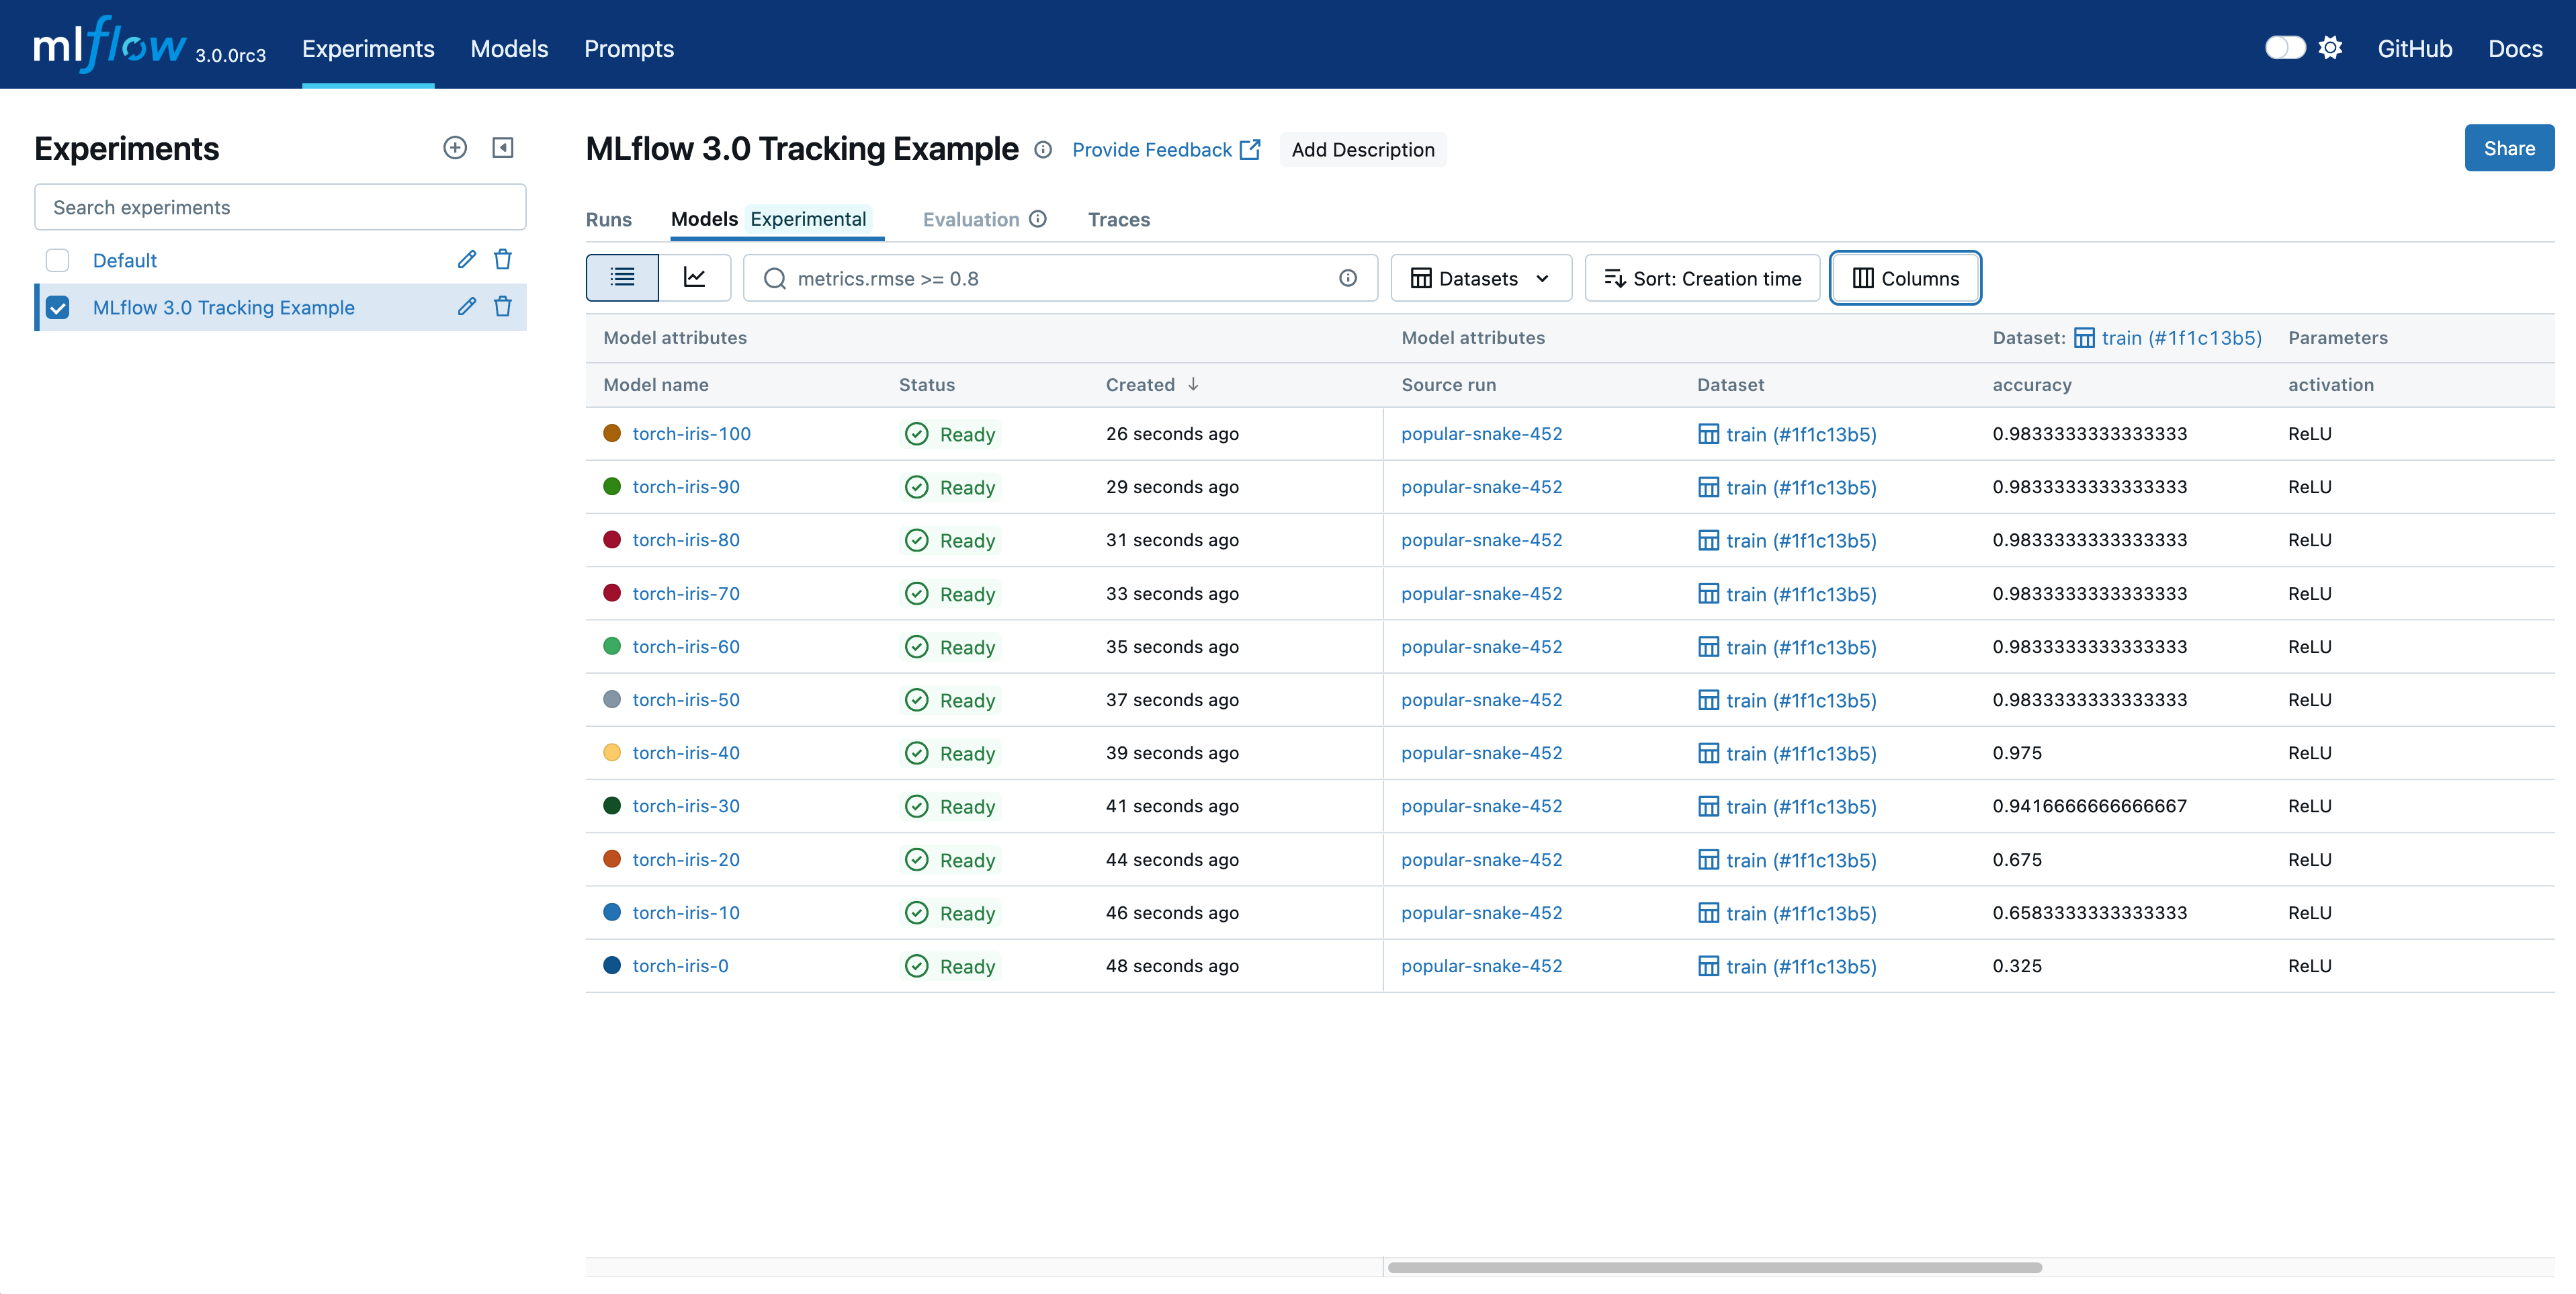
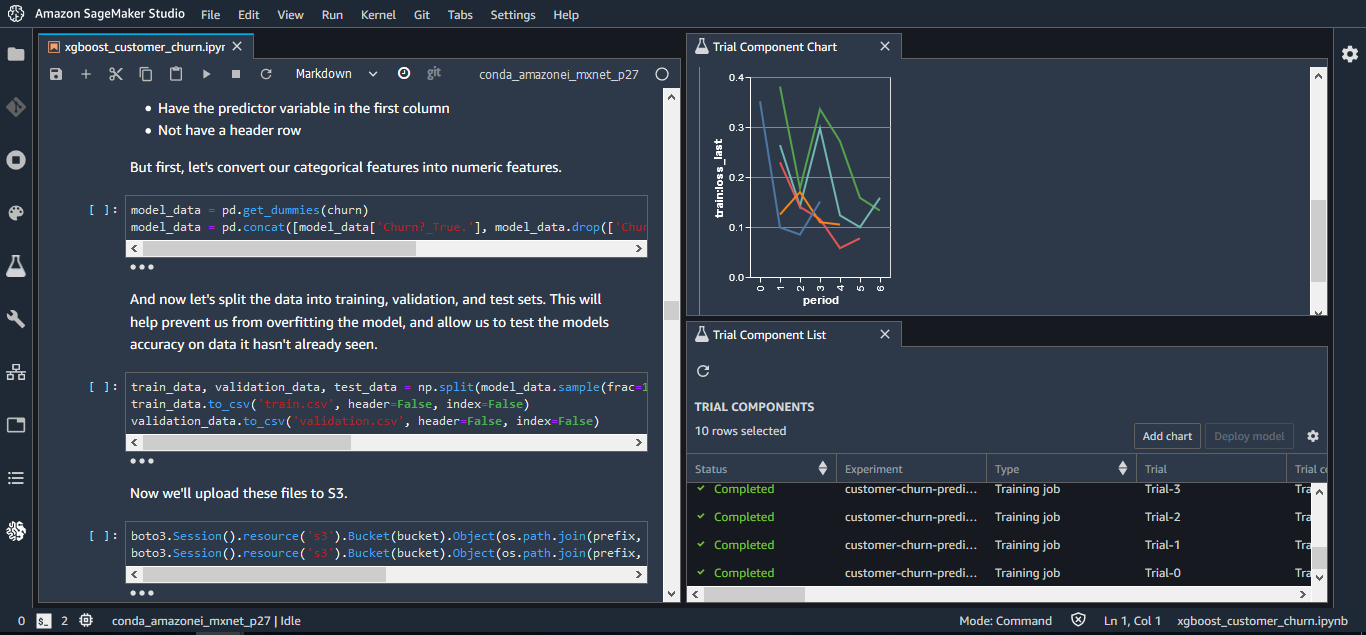
MLflow is the default answer for experiment tracking, and it stays the default because it does four separate jobs adequately rather than one job exceptionally.
Pros:
Tracking, projects, model deployment, and a registry with versioning and stage transitions all ship in one open-source package.
Access through CLI, Python, R, Java, and REST, so it fits whatever the team already writes.
Ubiquitous enough that most other tools on this list integrate with it rather than replacing it.
Cons:
The open-source server is a component rather than a product. Authentication, access control, and high availability are yours to build.
Teams routinely discover the tracking server became production infrastructure that nobody owns.
The UI slows noticeably when comparing hundreds of runs.
Artifact storage is a separate concern you configure and pay for elsewhere.
Pricing: free and open source. The operational cost is the server, the backing database, and the artifact store, which is real money at any meaningful scale.
Best fit: almost any team training models, as the baseline other tools integrate with rather than replace.
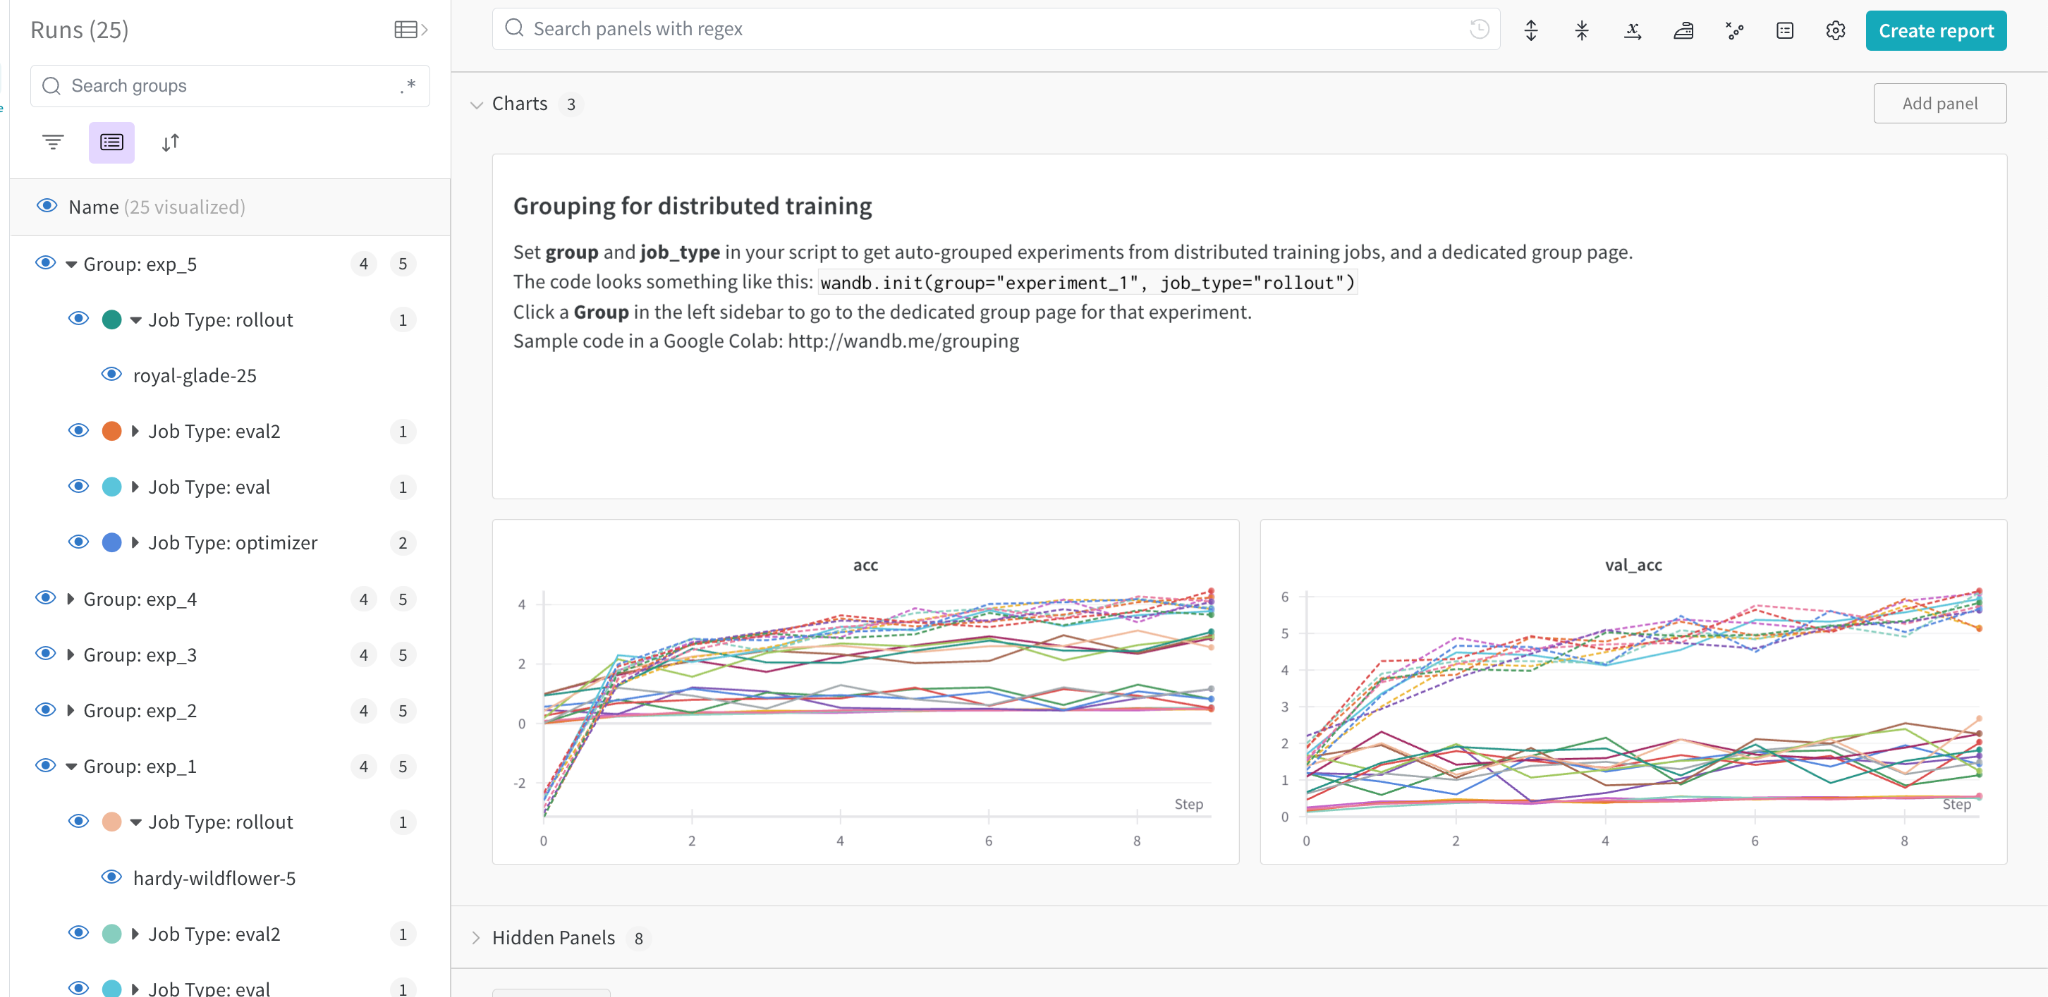
5. Weights & Biases
Weights & Biases (WandB) is the most polished experiment tracking product available, with Weave extending it into LLM tracing and evaluation. CoreWeave did acquire WandB, and CoreWeave compute now appears as a billed line item inside the WandB plans.
Pros:
Dashboards and interactive tables make comparing runs and inspecting predictions faster than any alternative here.
Sweeps handles hyperparameter optimization natively rather than as a bolt-on.
Artifact lineage tracks datasets, models, and dependencies as versioned objects.
Cons:
Pro at $60/mo is restricted to organizations with fewer than 50 employees, stated as a requirement rather than a guideline, so growing past that headcount means an Enterprise conversation regardless of usage.
The self-hosted free tier prohibits corporate use entirely, removing the option most likely to appeal to teams with data residency concerns.
Weave data ingestion overage runs $0.10 per MB, roughly $100 per GB, which is the line to model before committing.
The LLM side is newer and thinner than tools built for inference workloads first.
Pricing: Free gives 5 model seats, 5 GB of storage, and 1 GB of Weave ingestion monthly. Pro starts at $60 per month with 100 GB of storage and 1.5 GB of Weave ingestion, additional storage at $0.03 per GB. Enterprise is custom and covers HIPAA, SSO, and private hosting.
Best fit: teams under 50 people who train models frequently and value the interface enough to accept the eligibility ceiling.
6. lakeFS
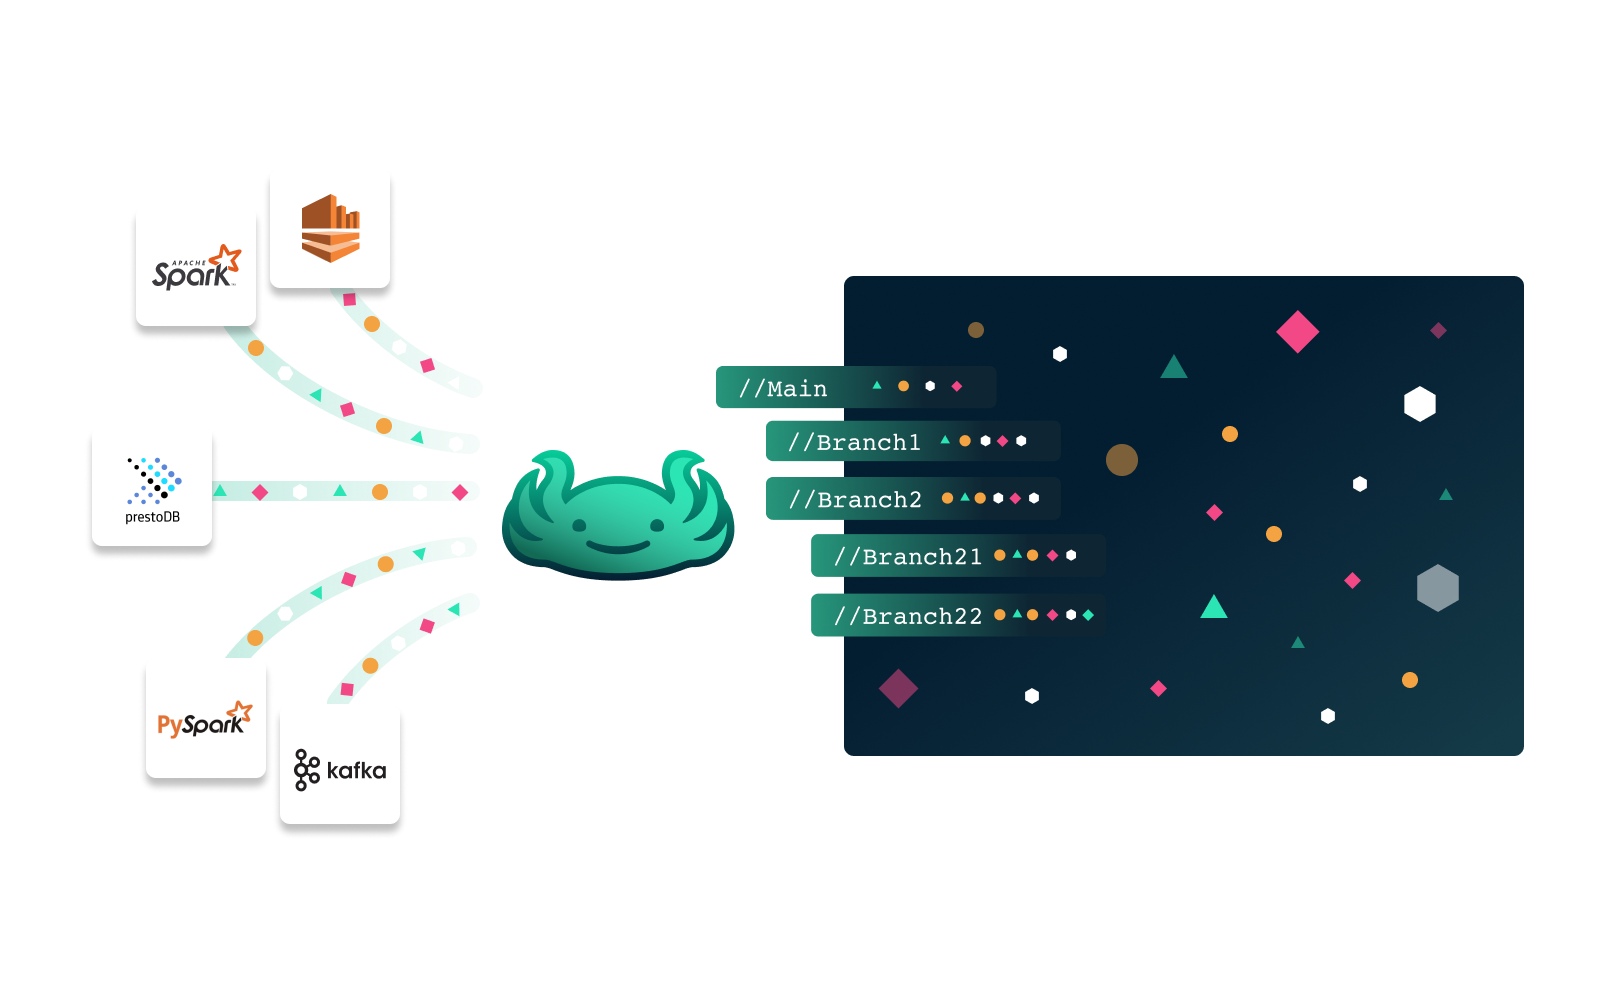
Copying a petabyte to make a branch is not an option, which is the problem lakeFS exists to solve. It provides zero-copy branching over object storage, giving Git-like commits, branches, merges, and reverts against S3, Azure Blob, or GCS.
Pros:
Branching an entire dataset is instant and duplicates nothing, so isolated experiments cost storage only for what changes.
Hooks enforce quality gates at commit and merge time, which is how teams implement write-audit-publish so bad training data never reaches downstream jobs.
Format-agnostic and cloud-agnostic, covering structured tables, unstructured files, and model artifacts in the same repository.
Cons:
There is no middle tier. Open Source is free forever, Enterprise is a sales conversation, and nothing sits between them.
RBAC, SSO, SCIM, IAM roles, audit logs, the mount capability, the Iceberg REST catalog, metadata search, and SOC 2 are all Enterprise-only, so any governance requirement has no self-serve path.
Adoption means routing data access through lakeFS, which is a larger change than adding a library.
Pricing: the open-source version is free forever with full core versioning. Enterprise is unlimited seats at an undisclosed price, and every compliance and access-control feature sits behind it.
Best fit: teams whose reproducibility problem is the dataset rather than the code, especially at scales where copying is prohibitive.
ML Pipeline Orchestration and Model Deployment
Orchestration turns a sequence of scripts into a repeatable, scheduled, observable pipeline. Deployment turns a model artifact into an endpoint that survives traffic. Both are infrastructure problems, and the tools differ mainly in how much Kubernetes they expect you to understand.
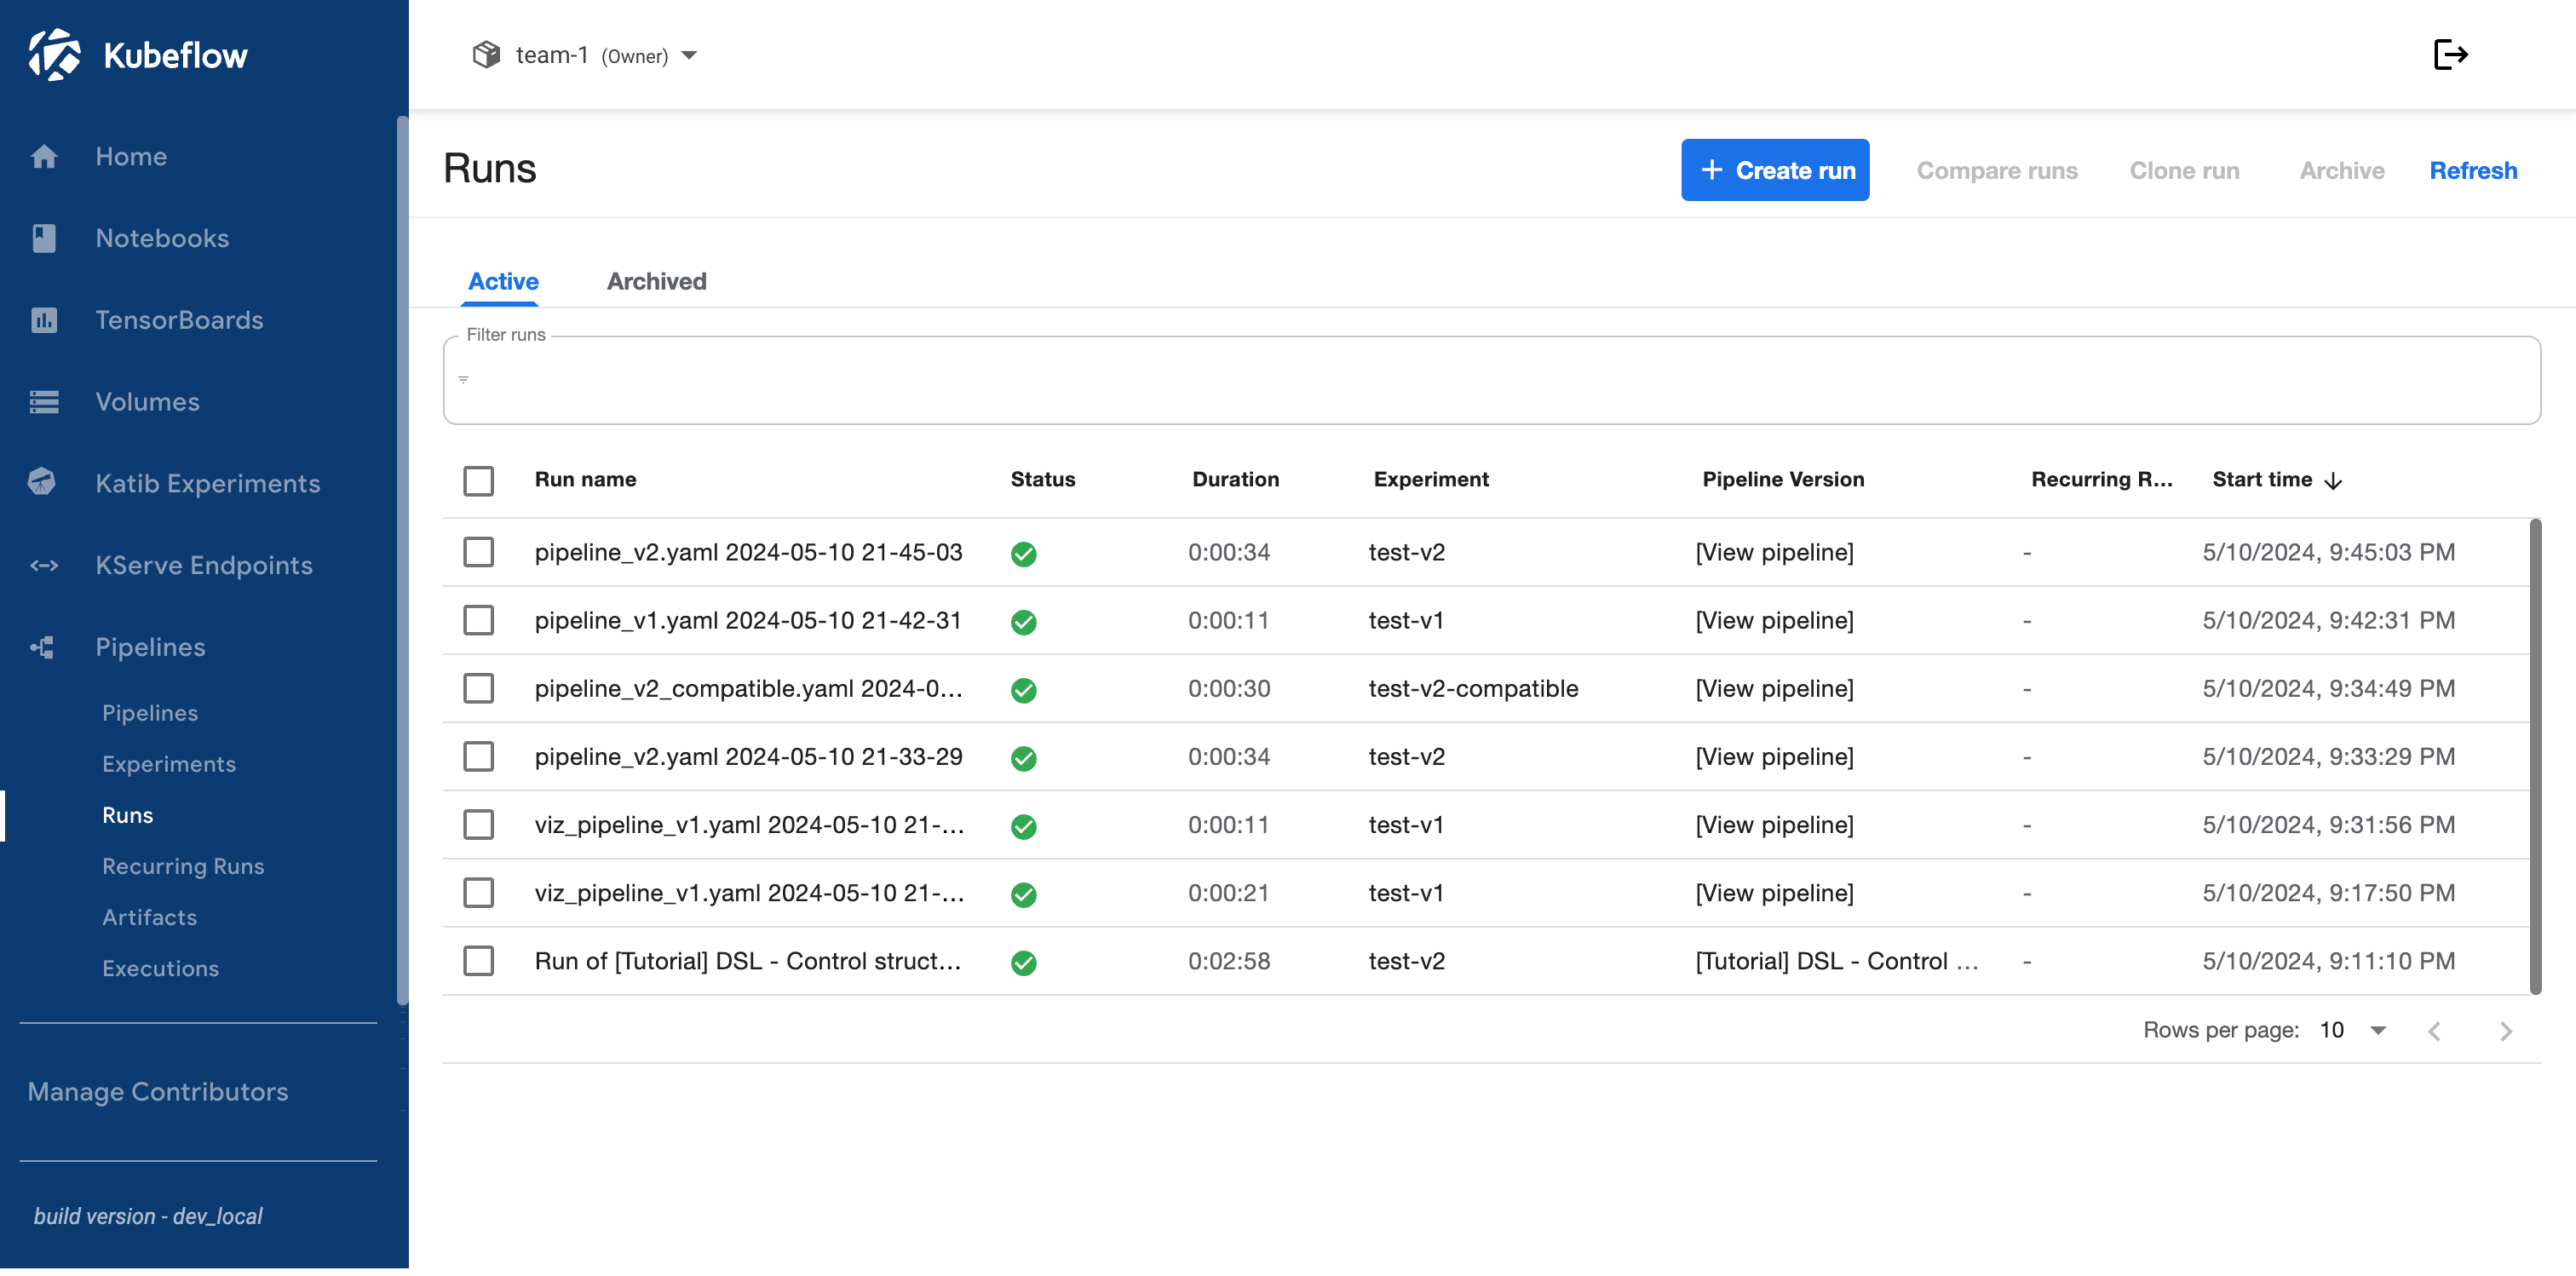
7. Kubeflow
Kubeflow is the Kubernetes-native option, and that single fact determines everything else about it.
Pros:
Pipelines are containers, so anything that runs in a container runs in a pipeline regardless of language or framework.
Distributed training jobs for TensorFlow, PyTorch, PaddlePaddle, MXNet, and XGBoost, plus hyperparameter tuning through Katib.
Runs identically on any cloud or on-premises cluster, with multi-user isolation built in.
Cons:
The honest cost is not licensing, it is that you have taken on a distributed system. Installation, upgrades, certificate management, and debugging failures that turn out to be networking rather than machine learning all need deep Kubernetes knowledge.
That person is expensive and hard to hire, and teams without a platform function usually find the operational load exceeds the benefit.
Component maturity across the project has been uneven, so the pieces you need should be evaluated individually rather than as a whole.
Pricing: free and open source. The cost is the cluster and the engineer who keeps it running.
Best fit: organizations already standardized on Kubernetes with a platform team to own it.
8. ZenML
ZenML sits a layer above the orchestrators rather than replacing them, so one pipeline definition runs on Kubernetes, Vertex, SageMaker, or Azure ML without a rewrite.
Pros:
Pipeline code outlives the orchestrator choice, which matters most for teams on more than one cloud.
Only metadata leaves your environment. Data and compute stay in your VPC, which removes most of the objection to a managed control plane.
SOC 2 Type II and ISO 27001 certified, with air-gapped deployment available on Enterprise.
Cons:
An abstraction over orchestrators is only as good as its integrations, and anything it does not cover means dropping to the underlying tool anyway.
Scale is priced in an unusual unit: $999 per month per workspace metered on monthly pipeline executions, with the allowance moving between roughly 500 and 5,000, so many small pipelines hit the ceiling well before few large ones do.
The pricing page covers two separate products. ZenML handles pipelines, and Kitaru, a newer tool for replay-based agent evals, is sold at a flat $39 per month on its own terms.
Pricing: the open-source version is free and self-hosted. Scale is $999 per month per workspace against an execution allowance, and Enterprise adds SSO, custom RBAC, audit logs, and air-gapped deployment.
Best fit: teams running on more than one cloud, or expecting to, who want the pipeline code to survive an infrastructure change.
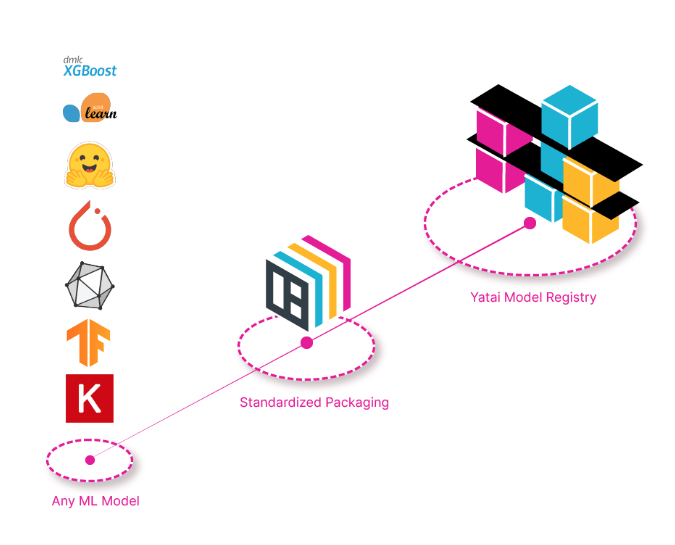
9. BentoML
Packaging is the problem BentoML solves. It turns a trained model plus its dependencies and preprocessing into a versioned, containerized service with an HTTP API, in Python, without a separate infrastructure skill set.
Pros:
Serving becomes a library decision rather than an infrastructure project.
Adaptive batching and parallel inference are built in rather than configured downstream.
Works across Keras, ONNX, LightGBM, PyTorch, and scikit-learn, and the framework remains Apache 2.0.
Cons:
Pricing is no longer published as BentoML tiers, so there is no per-seat or per-deployment rate to forecast against.
Clicking pricing on BentoML's own site redirects to a parent company's editions page, which means the commercial product's roadmap is set outside the project.
Serving is the whole scope. Experiment tracking, orchestration, and monitoring are all separate purchases.
Pricing: the framework is free under Apache 2.0. Commercially, self-hosting carries no license fee, hosted inference bills per token on shared endpoints and per minute on dedicated ones, and bring-your-own-cloud bills per minute of reserved capacity in your VPC.
Best fit: Python teams who want serving handled in code rather than as an infrastructure project.
Pricing: the framework is free. Commercially, self-hosted is free under Modular's community license, Modular's cloud bills per token on shared endpoints and per minute on dedicated ones, and bring-your-own-cloud bills per minute of reserved capacity in your VPC.
Best fit: Python teams who want serving handled in code, with the ownership change factored into the roadmap bet.
Model Monitoring and Drift Detection
Monitoring is where the two halves of this list diverge most sharply. For trained models the question is whether the input distribution still resembles the training distribution. For generated output the question is whether the answer was correct, and no distribution test will tell you.
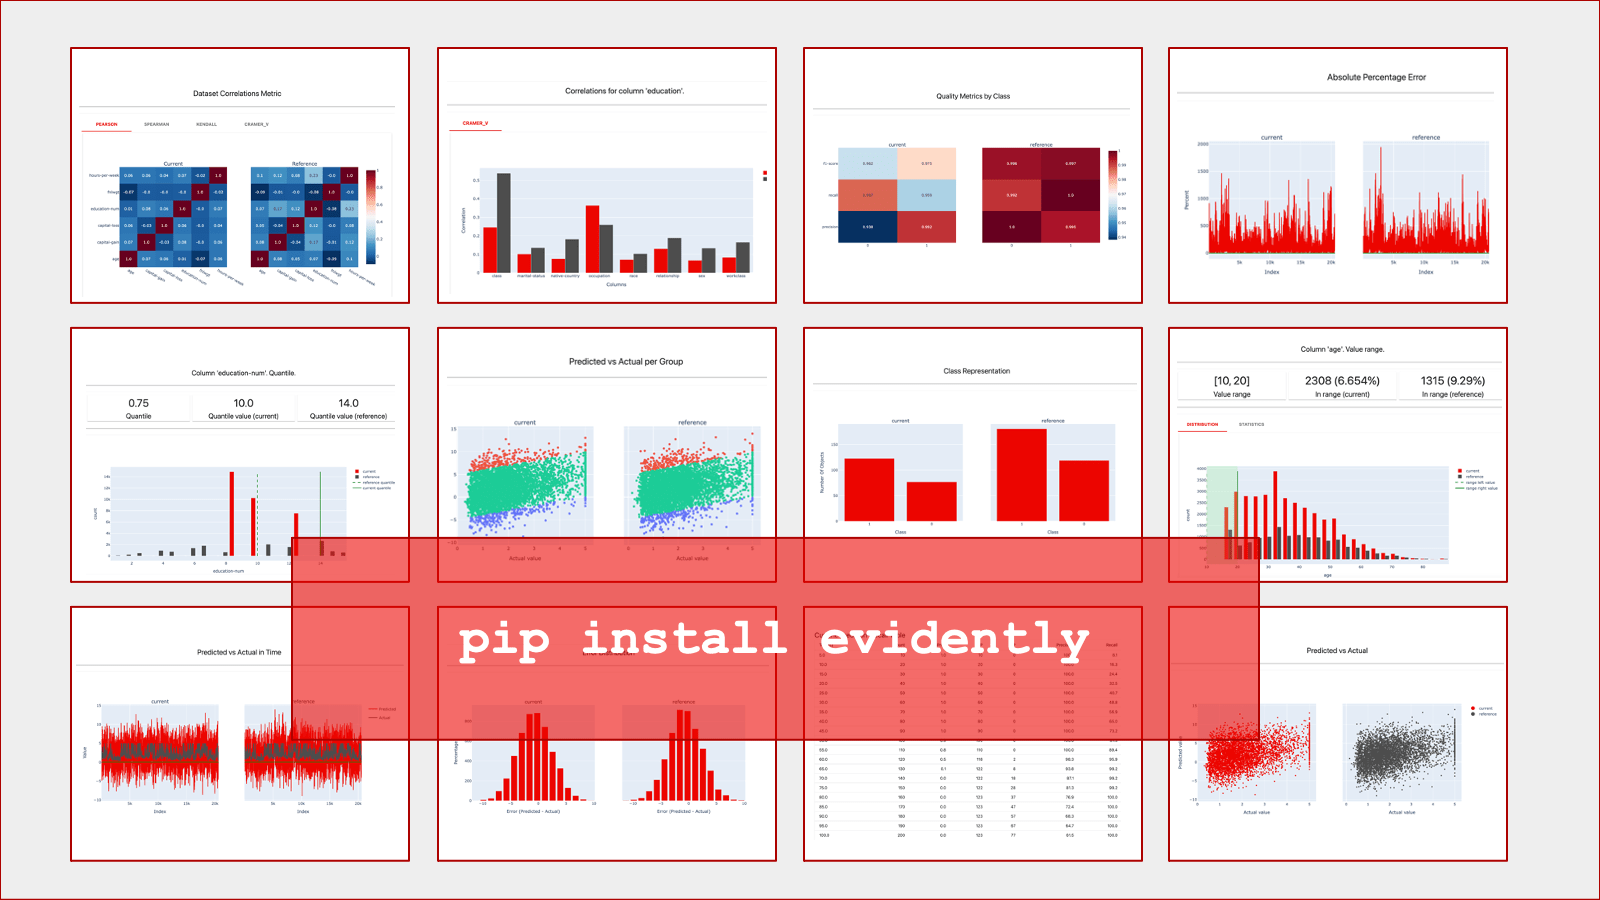
10. Evidently
Evidently started as a Python library for generating drift and model quality reports, and that origin still shows in the best way.
Pros:
A drift report on two dataframes takes a few lines, with no platform, no account, and no ingestion pipeline.
Covers data drift, target drift, data quality, and both regression and classification performance.
The report and test suite structure wires cleanly into a pipeline as a deployment gate.
Cons:
The library computes and reports, it does not run continuously by itself, so production monitoring means scheduling it or adopting Evidently Cloud.
Coverage is strongest on tabular data and thinner on the LLM side, where the interesting failures are semantic rather than statistical.
Paid pricing is not published, which makes budgeting a sales conversation.
Pricing: the open source framework is free. Evidently Cloud offers a free tier for getting started, with paid plans for higher volume and advanced features that are not published. Figures circulating on aggregator sites have no vendor source behind them.
Best fit: teams monitoring tabular models who want drift detection as a library rather than a platform commitment.
11. Galileo
Galileo targets enterprises where quality and compliance requirements dominate the buying decision rather than developer experience.
Pros:
Hallucination detection is the deepest on this list, and it is the product's primary investment rather than a feature.
Evaluation automation is built to run at enterprise scale rather than per-project.
Audit workflows produce the kind of quality reporting a risk function asks for.
Cons:
The product is organized around governance, so the developer experience is thinner than platforms designed for engineers chasing a production incident.
No self-hosting at all, which rules it out for teams with data residency requirements.
Cisco announced its intent to acquire Galileo in April 2026, and Splunk has since confirmed the deal closed. Galileo now extends Splunk Observability Cloud, which means an independent platform is a component of a much larger suite with its own roadmap, its own release cadence, and its own pricing conversation.
Pricing: free tier, Pro at $150 per month, Enterprise on request. Worth confirming these survive the Splunk integration before building a budget on them.
Best fit: enterprise teams whose primary need is hallucination detection and audit-ready quality reporting, particularly those already running Splunk.
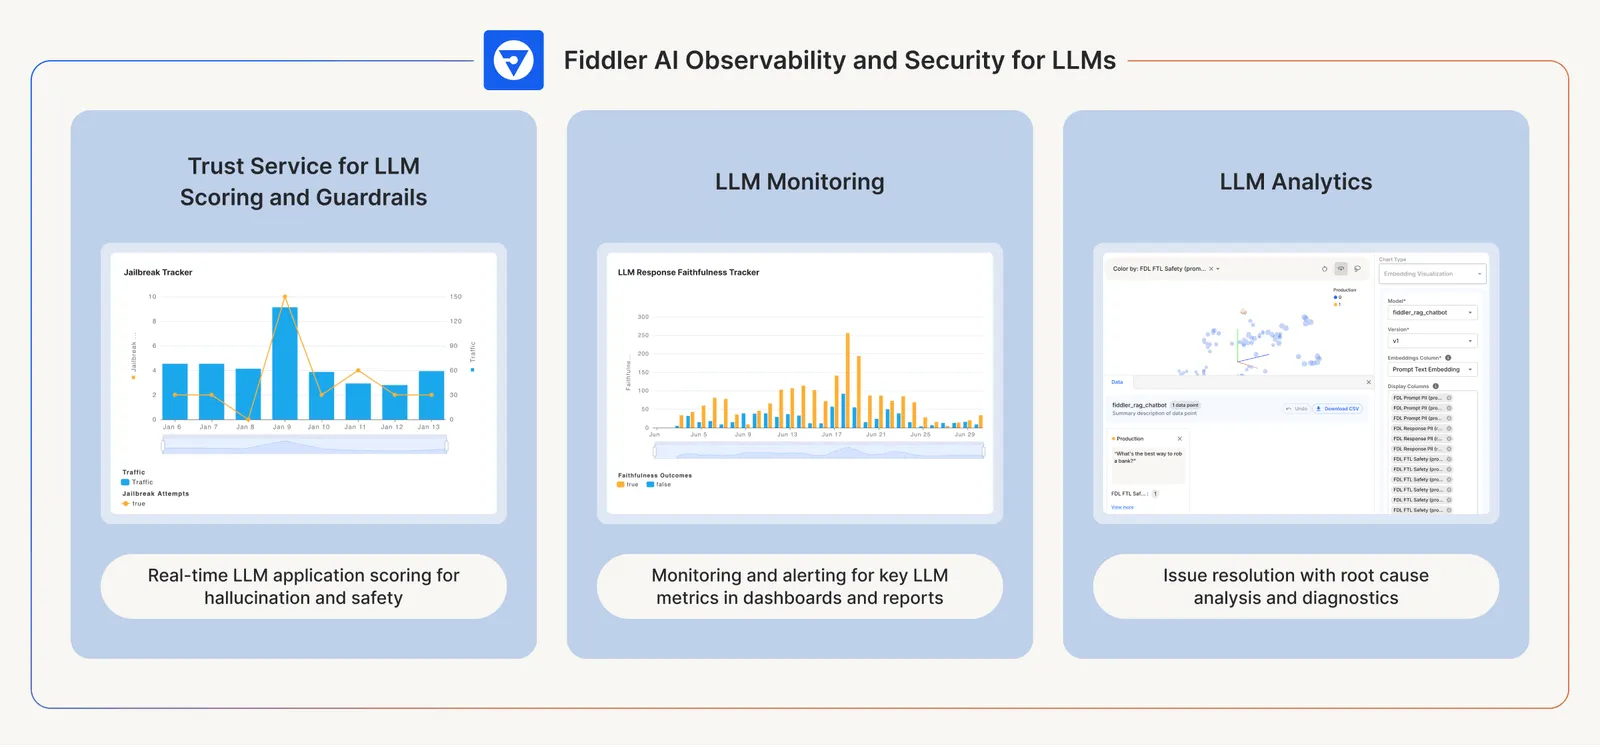
12. Fiddler
Explainability is the reason to look at Fiddler, which layers local and global explanations for model behavior on top of drift and performance monitoring.
Pros:
Explains individual predictions and whole-dataset behavior, which is what regulated settings need when "the model decided" is not an acceptable answer.
Embedding clustering surfaces patterns in outputs that aggregate metrics hide.
Runtime guardrails enforce safety policy at inference rather than reporting violations afterwards.
Cons:
The explainability heritage is classical ML, so tools like Fiddler are less mature than in platforms built for inference workloads first.
The feature set is aimed at governance and risk teams rather than at the engineer debugging a failing run.
Per-trace pricing behaves badly for agent workloads, since one agent run generates dozens of traces and the bill then scales with architectural complexity rather than with customers served.
Pricing: $0.002 per trace, with self-hosting on Enterprise. The implication worth modelling is that adding a tool call to your agent raises your monitoring bill.
Best fit: financial services, healthcare, and other settings where model decisions have to be defended to an auditor.
Drift dashboards won't catch a wrong answer
Respan scores production outputs on faithfulness, relevance, and task completion as they happen, then links every score to the full agent run behind it. Monitors fire on quality, not just status codes. Free to try with 100k logs/month.
These are what teams buy when they want one vendor to own the whole lifecycle, and the choice is usually settled by where the company's data and cloud contracts already sit rather than by feature comparison. All three share a pricing property worth stating plainly: none of them has tiers. There is no subscription, only a meter.
13. Amazon SageMaker
Amazon SageMaker covers the full lifecycle inside AWS, from labeling and notebooks through distributed training, a model registry, pipelines, endpoints, and drift monitoring.
Pros:
Everything integrates with IAM, VPC, and CloudWatch, so the compliance boundary you already defined applies without duplication.
Managed endpoints handle autoscaling, canary deployment, and A/B traffic splitting without separate infrastructure.
Model Monitor covers data quality, drift, and bias against a captured baseline.
Cons:
SageMaker is a large collection of loosely related services under one brand rather than a single coherent product, and the learning curve reflects that.
Portability is the real cost. Pipelines, endpoints, and registry entries are AWS-shaped, so leaving is a rebuild rather than a migration.
Idle endpoints bill continuously, which is the most common source of surprise SageMaker invoices.
Pricing: no platform fee and no tiers. You pay per instance-second for training, notebooks, processing, and inference endpoints, at a premium over the equivalent raw EC2 instance. Forecasting the bill means forecasting instance-hours.
Best fit: teams whose data and compliance boundary is already AWS and who value integration over portability.
14. Azure ML
Azure Machine Learning offers the same lifecycle coverage against the Microsoft stack, with designer and code-first authoring, pipelines, a registry, and managed endpoints.
Pros:
Entra ID, Azure DevOps, and Purview integration means identity, CI/CD, and data governance carry over rather than needing a parallel system.
Responsible AI dashboards produce fairness and interpretability reporting without a separate tool.
The service itself carries no charge, so there is no platform fee layered on top of compute.
Cons:
The experience is uneven, with functionality split across the studio interface, the CLI, and the SDK in ways that mean the documented path is not always the working one.
The same portability constraint applies as with SageMaker. Pipelines and endpoints are Azure-shaped.
GPU quota management in specific regions is a frequent and underestimated source of delay.
Pricing: Azure charges nothing for the Machine Learning service itself. You pay for the underlying compute, storage, and networking, which makes the headline attractive and the actual cost identical in kind to any other cloud platform.
Best fit: enterprises standardized on Microsoft identity and governance, where the alternative means duplicating access control in a second system.
15. Databricks
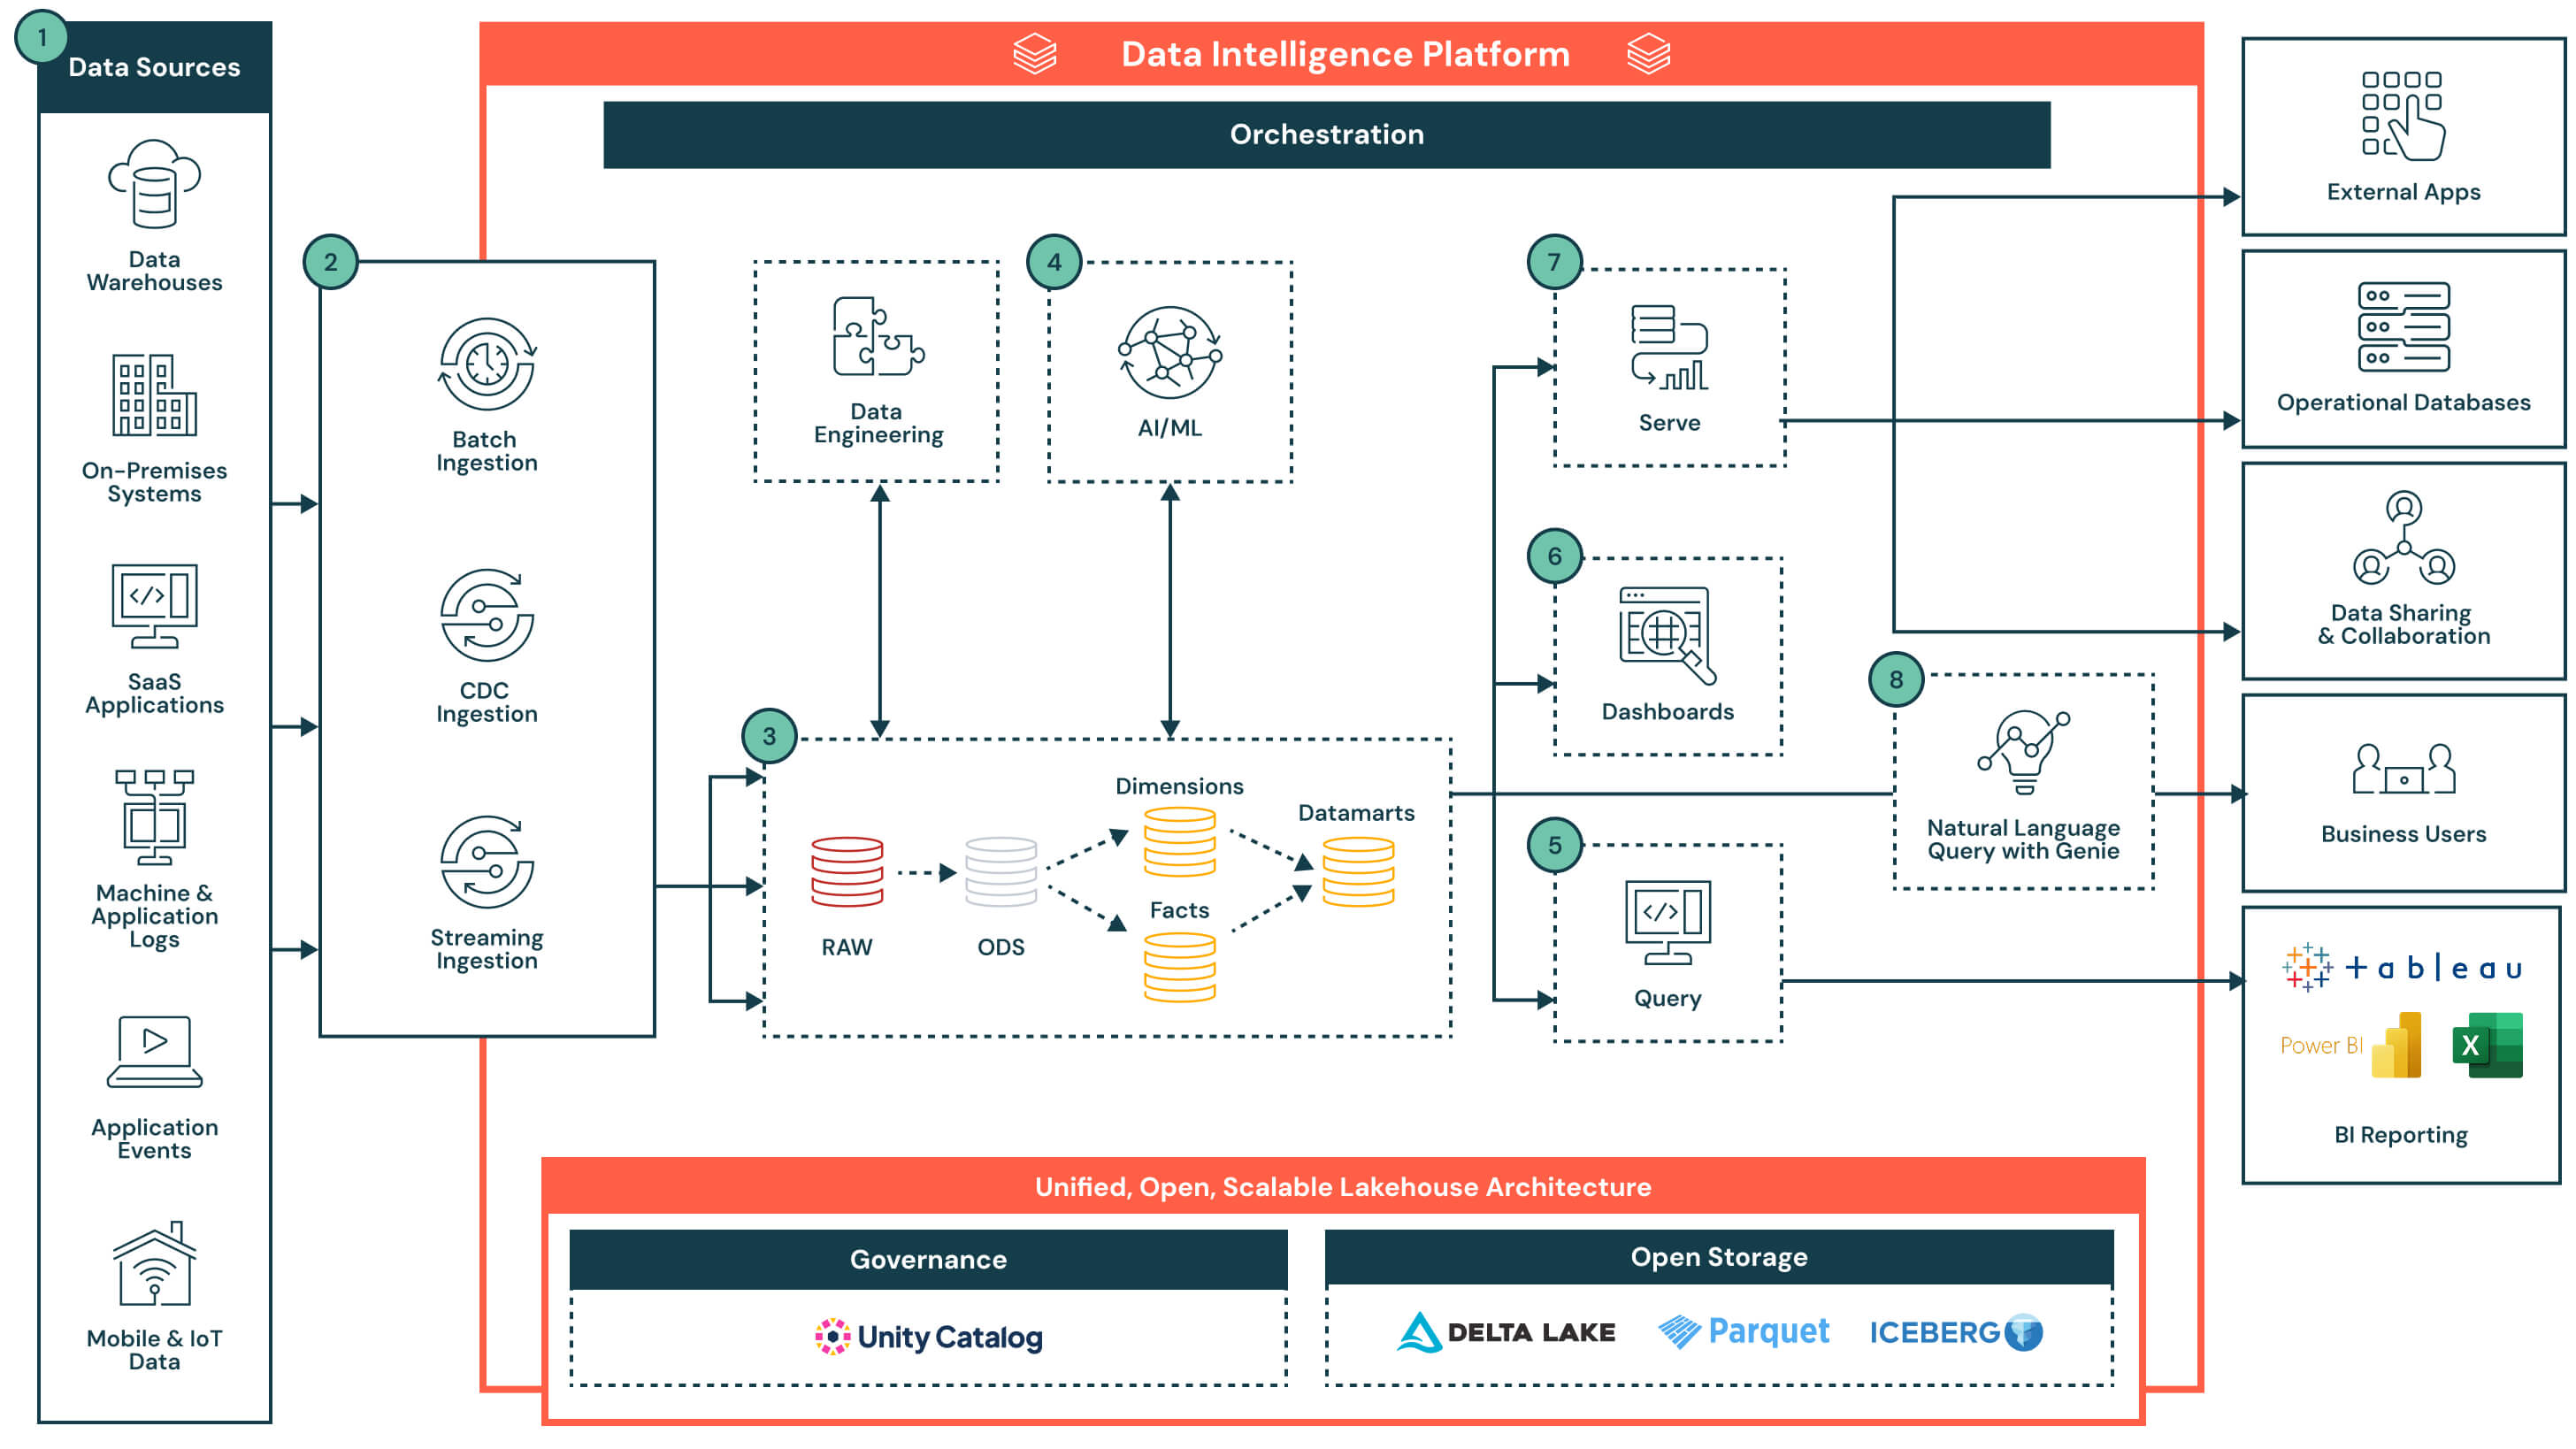
Databricks approaches the lifecycle from the data side, and the training data never leaves the platform.
Pros:
Unity Catalog governs tables, models, and features under one permission model, so a model's lineage runs back to the table it trained on without crossing a vendor boundary.
MLflow is built in rather than bolted on, and Delta Lake handles versioning underneath.
Data engineering and machine learning run on the same compute, which removes the handoff where most pipelines break.
Cons:
Expensive at a level that shows up in finance reviews, and the pricing model is what makes it hard to predict.
Billing is per second against Databricks Units with rates varying by SKU and by cloud, on top of the underlying cloud compute you are also paying for.
Discounts require committing to usage levels in advance, which means the cheapest path involves guessing consumption a year out.
Teams whose workload is training and serving rather than large-scale data processing tend to find they are paying for a lakehouse they only partly use.
Pricing: no tiers and no subscription. Consumption is metered per second in DBUs, rates differ by product SKU and cloud provider, and committed-use contracts are the only route to a discount. A free edition exists for learning.
Best fit: organizations already running a lakehouse where data engineering and machine learning are the same team's problem.
5 MLOps Best Practices
The practices below hold whether you trained the model or called it, though what they mean in each case differs enough to be worth stating separately.
Version the inputs, not just the model. A model version without the dataset version and the code version behind it cannot be reproduced, and a registry entry that points only at weights is a filename with extra steps. Freeze the training set as a tagged artifact and make pipelines refuse to run against a moving pointer like main or latest. For applications built on hosted models, the equivalent inputs are the prompt version, the retrieval index, and the tool definitions, all of which change behavior as much as a weight update would and none of which show up in a model registry.
Gate deployments on evaluation, not accuracy alone. Aggregate accuracy hides the failures that matter, because a model can improve overall while getting materially worse on the segment that generates your revenue. Score by slice, set the gate on the slices you care about, and make a failed gate block the promotion rather than file a ticket. For generated output there is no accuracy number to begin with, so the gate has to be an evaluator scoring faithfulness, relevance, and task completion against a dataset built from real traffic.
Instrument before you need to. Telemetry cannot be added retroactively to an incident that already happened, and the moment you want traces is always the moment you discover you were not collecting them. Capture inputs, outputs, latency, cost, and version identifiers on every run from the first deploy, and sample rather than dropping data if volume is a concern. Using OpenTelemetry conventions for this is what keeps the instrumentation portable when the backend choice turns out to be wrong.
Define what degradation means for your model type. A drift threshold on input features is the right alarm for a fraud model and a meaningless one for a support agent, because natural-language input has no distribution to test. Write down the specific failure you are trying to catch, then pick the signal that actually detects it: distribution distance for tabular models, estimated performance where labels arrive late, and output scoring on live traffic for anything generative. Teams that skip this step usually end up with alerts nobody trusts, which is worse than no alerts.
Make rollback cheaper than debugging. At 2am the correct action is almost always to revert first and investigate afterwards, and that only works if reverting is a single deliberate action rather than a redeploy. Keep the previous model version live and switchable, keep prompt versions deployable without a code release, and rehearse the rollback before you need it. The teams that debug in production do it because rolling back costs more, which is a tooling problem rather than a discipline problem.
None of these require buying anything specific. They do require deciding, before the first incident, which signals you are collecting and what you will do when one of them moves.
The stage your MLOps stack has no answer for
Respan traces every agent run step by step, scores output quality on live production traffic, versions prompts without a redeploy, and routes across 1,000+ models with automatic failover. One platform instead of four. Start free with 100k logs/month.
AIOps applies machine learning to IT operations data, correlating logs, metrics, and traces to reduce alert noise and find root cause faster in infrastructure. MLOps is the practice of building, deploying, and maintaining machine learning models themselves. The direction is opposite: AIOps uses ML to run your systems, MLOps runs your ML. A team can need both without any overlap in tooling, and our roundup of AIOps tools covers that category separately.
MLOps vs DevOps: What's the Difference?
DevOps platforms typically ship code, where the artifact is deterministic and a passing test suite means the build is good. MLOps ships models, where the artifact depends on data as much as code, behavior degrades without anyone changing anything, and correctness is statistical rather than binary. DevOps has continuous integration and continuous delivery. MLOps adds continuous training and continuous monitoring, because a model that was correct at deploy time may not be correct next quarter.
What Is an MLOps Framework?
An MLOps framework is the structure a team uses to organize the machine learning lifecycle: how data is versioned, how experiments are tracked, how models are validated and promoted, how deployments happen, and how production behavior is monitored. Some frameworks are conceptual, like Google's MLOps maturity levels, and some are concrete tooling stacks. The practical question is not which framework to adopt but which stages you actually have. A team that does not train models has no experiment tracking stage, and pretending otherwise produces a stack with empty components in it.
LLMOps vs MLOps: What's the Difference?
MLOps assumes you produced the model and can reproduce the run that made it. LLMOps covers applications built on models somebody else trained, where there are no weights, no training data, and no reproducible run, and where the provider can change the model underneath you between two identical requests. The artifacts shift accordingly: prompts and retrieval indexes instead of datasets and hyperparameters, and traces and evaluation scores instead of training metrics. Respan is built for this second case specifically, running LLM tracing, evaluation on production traffic, prompt versioning, and a gateway across 1,000+ models on one platform.
What Does Enterprise MLOps Look Like?
At enterprise scale the technical problem is usually solved and the organizational one is not. The characteristic requirements are centralized governance across many models and many teams, role-based access control and audit logging on every artifact, lineage records that satisfy a regulator rather than an engineer, deployment approval workflows, and cost attribution back to the business unit that incurred it. Most enterprises end up running a platform for the trained-model lifecycle alongside a dedicated layer for LLM applications, because the compliance obligations are identical and the instrumentation is not. Respan supports that pattern with SOC 2, HIPAA with a BAA, GDPR, and ISO 27001 compliance, SAML SSO, PII masking, and per-customer cost attribution.
Choosing Your Stack
Cost is the thing most teams misjudge at selection time, because the tools with no price on the page are frequently the expensive ones. Kubeflow and MLflow cost nothing to license and cost a platform engineer to run. SageMaker, Azure ML, and Databricks have no tiers at all and bill per second against a meter you have to forecast a year out to get a discount on. The tools with published tiers are the ones you can actually put in a budget, which is worth weighing against the feature comparison rather than after it.