LLMOps is the work that starts after an LLM application ships: getting requests to a model, recording what happened, deciding whether the output was any good, and turning that decision into a change. The name borrows from MLOps, but what you are shipping is not a model you trained. It is a prompt, a routing rule, and a retrieval step running against somebody else's checkpoint.
In 2026 that work costs more than it used to, because a user request stopped meaning a model call. It now means a planning step, several tool calls, a retrieval, and a scoring pass. Traffic that doubles can quadruple the bill without anyone shipping a feature, and a proxy hop that was negligible once per request is not negligible twelve times.
Where a platform lands on that depends on what it counts and where it sits. Capabilities that finish before the user sees a response spend time. Capabilities that run afterward spend money, because trace ingest, evaluation scores, and retention are what the meter reads. Those are the two questions worth asking of the 8 best LLMOps tools below.
What Is LLMOps?
LLMOps is the practice of operating an LLM application in production: getting requests to a model, recording what happened, measuring whether the output was any good, and changing something on the basis of that measurement. It borrows its name from MLOps, and the two overlap on versioning and monitoring, but the artifact is different. An MLOps team ships a model. An LLMOps team ships a prompt, a routing rule, and a retrieval step against a model somebody else trained.
Put simply, the term "LLMOps" means everything you do to keep an LLM application running well once it's in front of real users: getting requests to a model, recording what happened on each one, checking whether the output was actually good, and turning what you find into a change you can ship.
That difference shows up in what breaks. A classical ML model degrades slowly as the data distribution shifts, and drift detection catches it. An LLM application degrades the moment somebody edits a prompt, a provider silently updates a checkpoint, or a retrieval index goes stale, and none of that registers as an error.
The LLMOps Loop: Route, Observe, Evaluate, Improve
The category is easier to hold as a loop than as a list of products. Here's what it (generally) looks like in 2026:
- Route puts a layer between the application and the providers so a model can be swapped, a failed call can be retried against a second provider, and spend can be capped per key or per customer.
- Observe records every call, tool run, and retrieval as a span in one trace, with input, output, latency, and cost attached.
- Evaluate turns those recorded outputs into scores, either offline against a test set or live against sampled production traffic.
- Improve takes what the scores surfaced back into a prompt version or a routing change and proves the change worked.
There are tools for every step of the loop. Some sell the routing layer, some sell the recording and scoring layers, and a few sell the whole circuit. The reason the split matters is that the loop only closes if the score and the record of which model produced it can be joined, and joining them across two vendors is manual work that happens during an incident.
Where LLMOps Spends Money and Where It Spends Latency
Caching, fallback, retries, load balancing, spend limits, and inline guardrails all run while the user is waiting. They add a hop to every request, so what they cost is measured in milliseconds against your p95. Caching is the exception that proves the shape of this, because a cache hit returns faster than calling the provider would, which is why a gateway adding 30ms with caching on often feels quicker than one adding 10ms without it.
Trace ingest, offline evaluation, experiment runs, annotation, and retention all run after the response has already gone out. They add nothing to your p95 and they are the entire invoice, because they are what vendors meter. The surprise is usually which number drives that invoice: not how many people used the product, but how many spans each request produced and how many scores got written against them.
Why Is LLMOps Important?
Cost is the most common reason teams go looking, and the reason is usually that spend grew faster than usage. Agentic workloads multiply calls per request, so traffic that doubles can quadruple the token bill, and the observability layer underneath multiplies alongside it because every one of those calls becomes a span to ingest. Without attribution by model, feature, and customer, a monthly invoice from a provider says nothing about which change caused it.
Latency compounds in the same way and for the same reason. A single-call request that adds a proxy hop is barely affected. A twelve-step agent that adds the same hop twelve times, plus a synchronous guardrail on each output, has spent a meaningful part of its budget before the model does any work. The fix is usually configuration rather than architecture, which is only possible if the layer doing the work is visible.
Quality degrades in a way that neither of those metrics catches. A prompt edit, a model update, or a retrieval index that stopped refreshing produces a response that returns HTTP 200 in normal time and is wrong. Latency looks fine, error rate looks fine, and the first signal is a customer complaint days later. Scoring output on live traffic is the only thing that shortens that gap, and it is the capability teams add last.
The fourth reason is speed of repair. When prompts live in application code, changing one means a code change, a review, and a deploy, so the time from finding a regression to shipping a fix is measured in days. Pulling prompts out into versioned artifacts turns that into a publish, which is why prompt versioning shows up in this category rather than in general developer tooling.
What to Look for in LLMOps Tools
The criteria that matter are the ones that are expensive to reverse. Instrumentation choices, metering models, and deployment posture all get harder to change once production traffic is flowing, while dashboard preferences do not.
-
Whether routing and tracing share a bill - Most tools here ship some form of gateway now, so the presence of one sorts nothing. What varies is whether the routing layer and the trace store are the same product. When they are, a trace already carries the model that served it and the prompt version that produced it. When they are not, that join is manual work performed under time pressure.
-
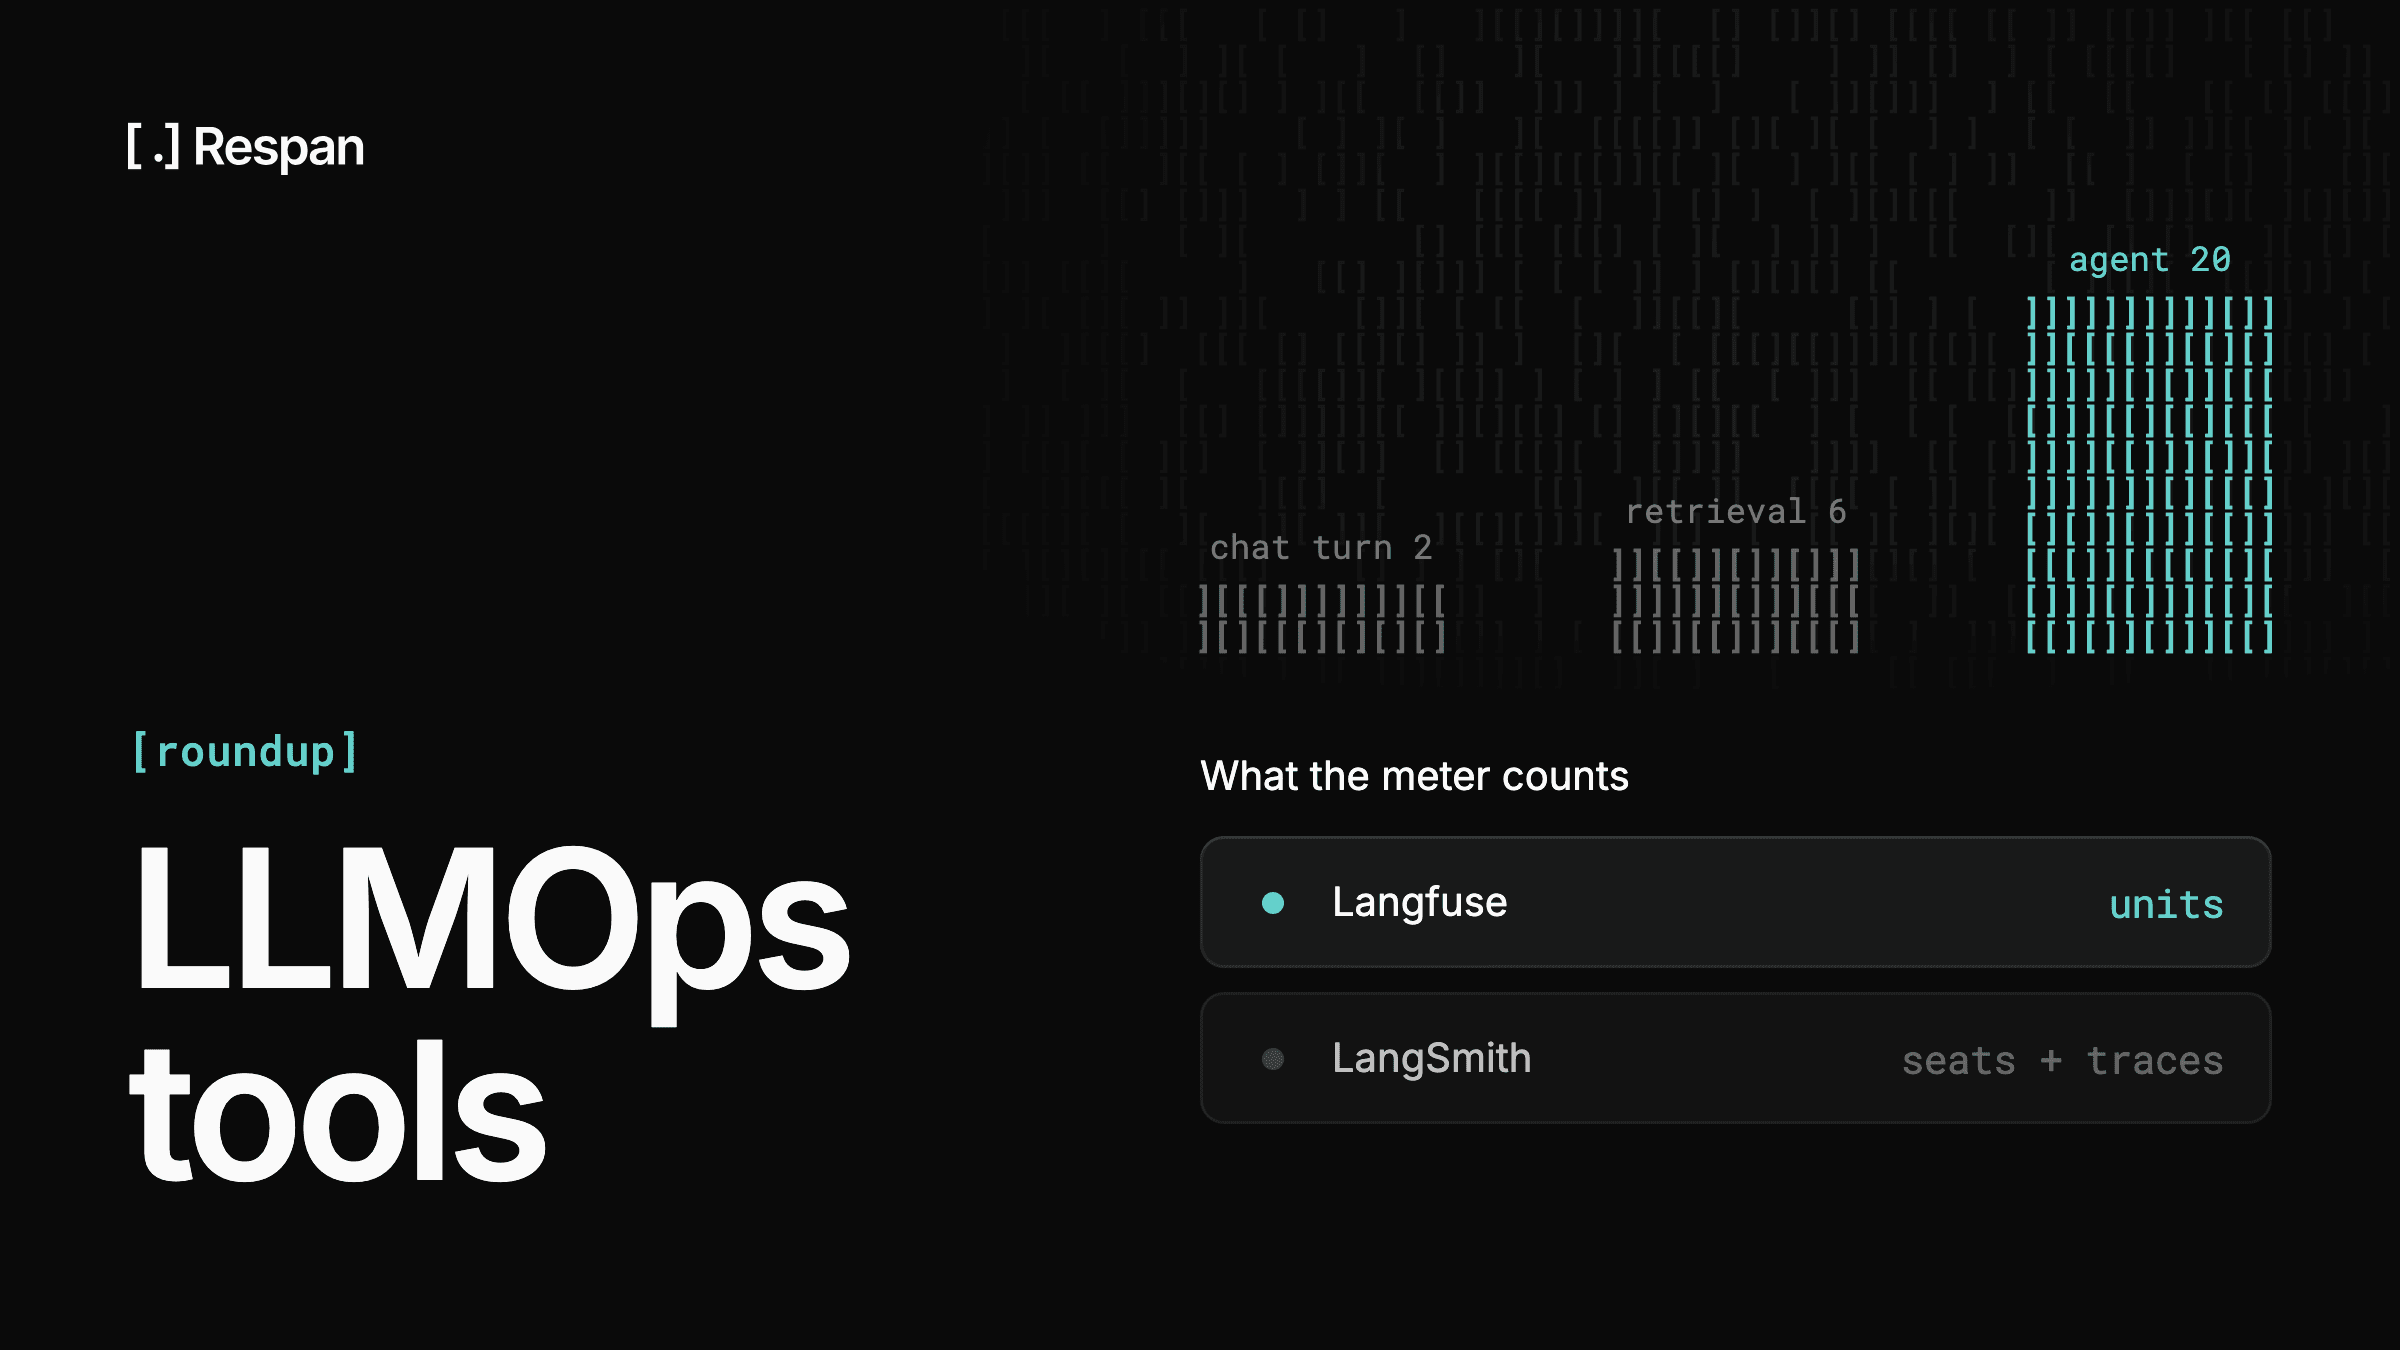
What the meter counts - Units, traces, observations, scores, seats, requests, and gigabytes all behave differently as an application scales. A per-seat meter tracks headcount and stays flat under traffic growth. A per-observation meter tracks agent depth, so adding a retrieval step raises the bill without adding a single user.
-
Where the tool sits at request time - A layer in the path can act on cost and latency while the request is live, which is the only place caching, fallback, and hard spend caps can work. A layer beside the path can only describe what already happened. Both are useful and they are not substitutes.
-
Trace depth on multi-step runs - The unit that fails in an agent is the run, not the call. Request-level logging shows a successful transaction that produced a bad answer, while a full trace tree shows which of the twelve steps introduced the error.
-
Evaluation coverage - The distinction worth checking is offline against a curated test set versus online against sampled live traffic. Offline catches regressions before a deploy. Online catches the drift that no test set anticipated, and it is the more commonly missing half.
-
Prompt management - Versioning, deployment labels, and rollback decide how fast a bad prompt can be reverted. Composability and templating decide whether prompts stay maintainable once there are more than a dozen.
-
Deployment and compliance posture - Prompts and completions routinely carry the data a compliance team cares about. SOC 2, HIPAA with a BAA, GDPR, data region, PII masking, and retention controls determine whether a platform survives a security review at all.
Weight the first three above the rest. They are the ones that decide what the platform costs and what it can do about it, and they are the hardest to change after the fact.
Top 8 LLMOps Tools & Software in 2026
| Tool | Price | Latency | Best for |
|---|---|---|---|
| 1. Respan | Free; Team $199/mo | Gateway hop, cache absorbs repeats | Closing the loop in one platform |
| 2. Braintrust | Free; Pro $249/mo | Gateway hop when routing | Evaluation-driven development |
| 3. Langfuse | Free; Core $29/mo | Background export, no hop | Open-source tracing with data control |
| 4. LangSmith | Free; $39/seat/mo | Background export, no hop | LangChain and LangGraph stacks |
| 5. Portkey | Free; from $49/mo | Gateway hop, exact and semantic cache | Governance-heavy enterprise routing |
| 6. LiteLLM | Free, self-hosted | Gateway hop on your infra | Teams that want the proxy themselves |
| 7. MLflow | Free, Apache 2.0 | Gateway hop, async tracing | Mixed ML and LLM portfolios |
| 8. TrueFoundry | Free; then $499/mo | Gateway hop, deploy near models | Kubernetes-native model serving |
1. Respan
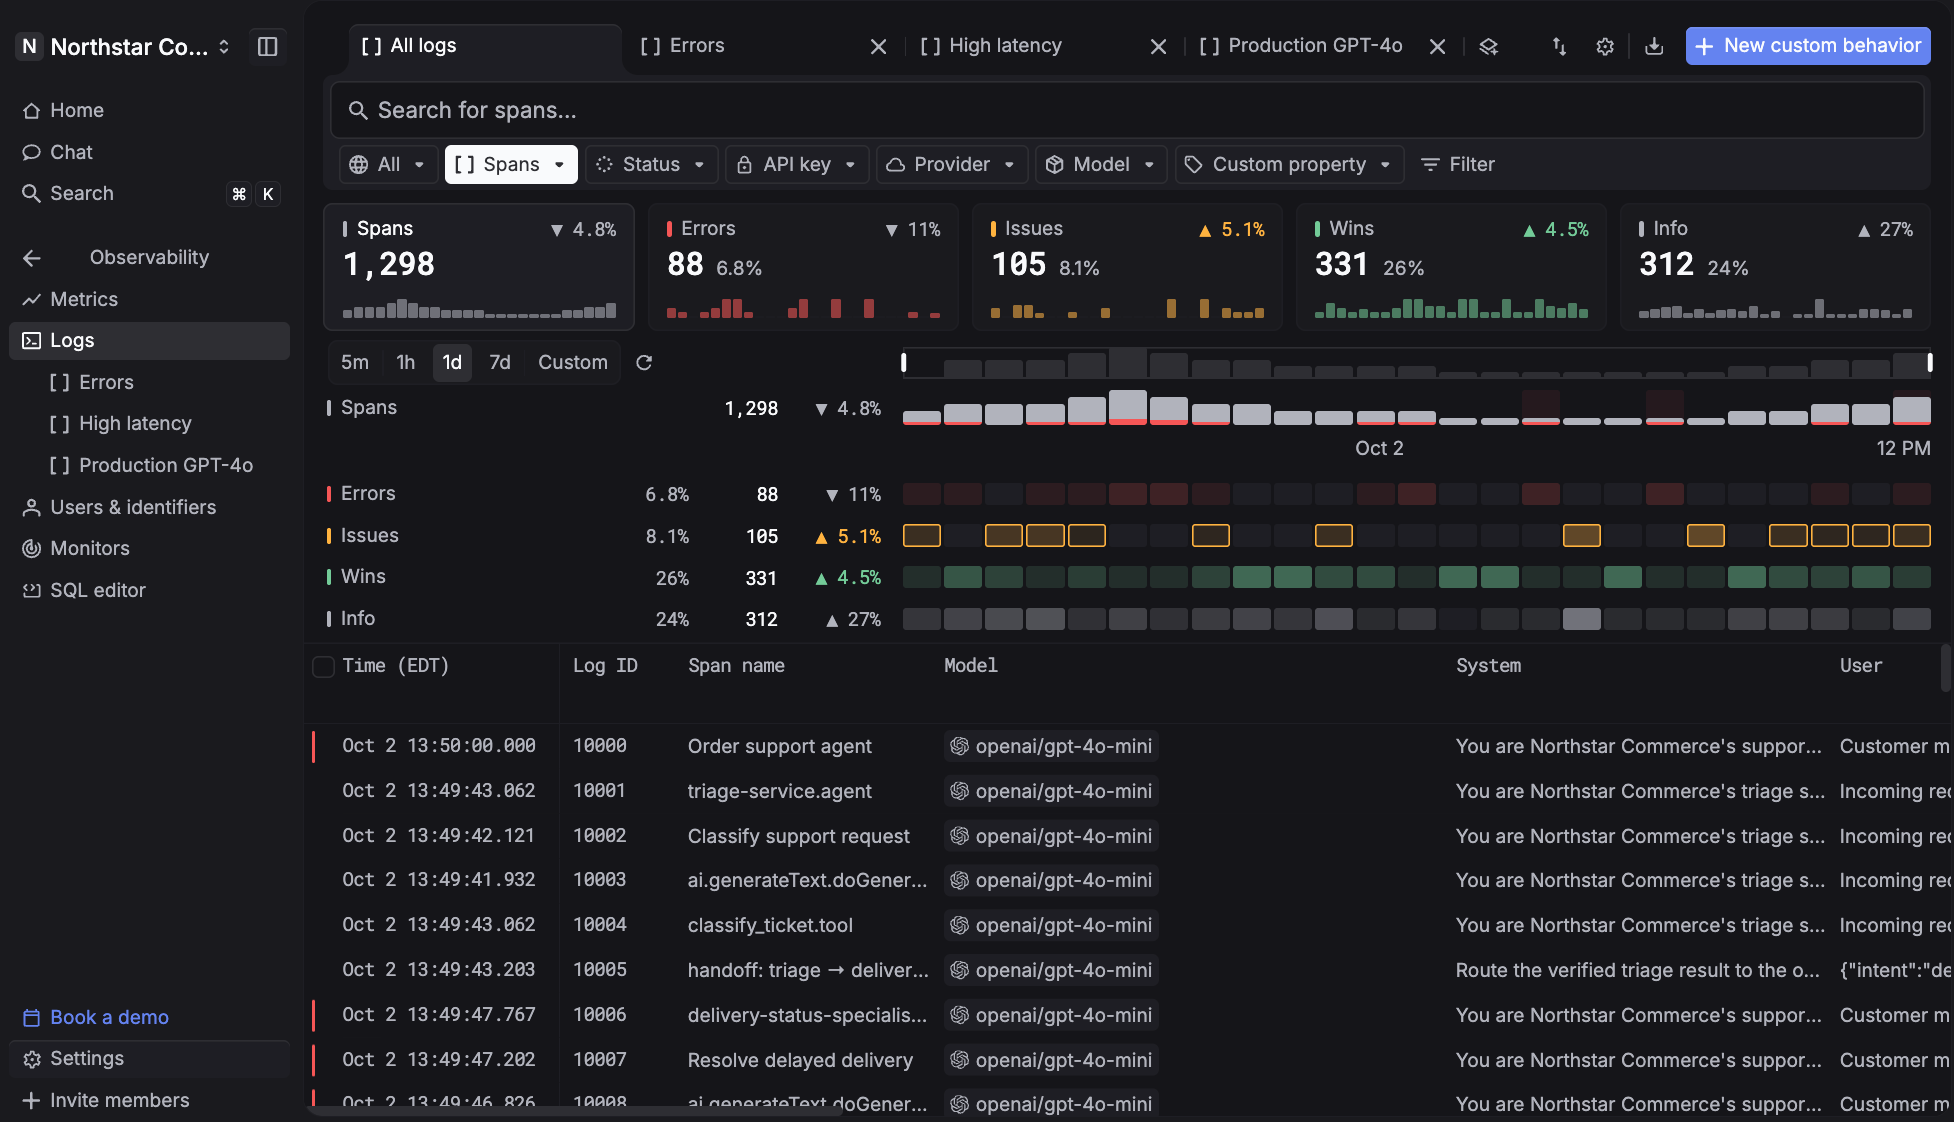
Respan runs the gateway, tracing, evaluations, prompt management, and monitoring on one data plane, which means a trace already carries the routing decision that served it and the prompt version that produced it. With Respan, you can route, observe, and evaluate every LLM call, all in one platform. The loop closes inside the product: a bad score in production becomes a dataset, an experiment, a new prompt version, and a proven fix without exporting anything.
That consolidation holds at volume. Retell AI runs more than a million LLM calls an hour through Respan without sampling, and scaled from 5M to 500M+ monthly API calls on it. When a provider's streaming endpoint slows, an engineer flips that model to a fallback in the gateway and watches the retry rate drop on the dashboard that surfaced the problem.
LLMOps Features:
- See what your agents actually did - Every LLM call, tool run, retrieval, and agent turn becomes a span in one nested trace, each with its own input, output, latency, and cost.
- Stay up when providers fail - Ordered fallback chains, automatic retries, and load balancing across 1,000+ models behind one OpenAI-compatible endpoint, at typically 30–40ms of added latency.
- Know where every dollar goes - Spend broken down by model, request, and end customer, with soft caps that warn and hard caps that stop spend at the ceiling.
- Measure quality with scores, not vibes - LLM judges, deterministic code checks, and human review compose into one evaluator, deployed offline before shipping and on sampled live traffic after.
- Ship prompts without shipping code - Versioned templates with one-click deploy, so v3 serves production while v4 is in progress.
- Catch problems before customers do - Monitors on cost, errors, latency, tokens, or eval scores that alert Slack, email, or a webhook the moment they breach.
- Attack your own agent first - Red Team runs adversarial campaigns against the OWASP Top 10 LLM risks in a sandbox and reports confirmed findings by severity.
- Enforce in the request path - Respan Guardrails, in early access, run inside the gateway hop the request already takes, blocking categories like prompt injection or system prompt leak before the model sees them.
Price: Free covers 100k logs, 1k scores, 5 datasets, 2 evaluators, and 5 prompts with unlimited seats. Team is $199/mo billed yearly with unlimited datasets, evaluators, and prompts. Enterprise adds volume discounts, custom SLAs, and a 99.99% uptime commitment.
Latency: A single gateway hop, with exact-match caching that returns repeat requests without calling the provider at all.
Best for: Teams running agents in production who would rather debug one system than correlate four.
2. Braintrust
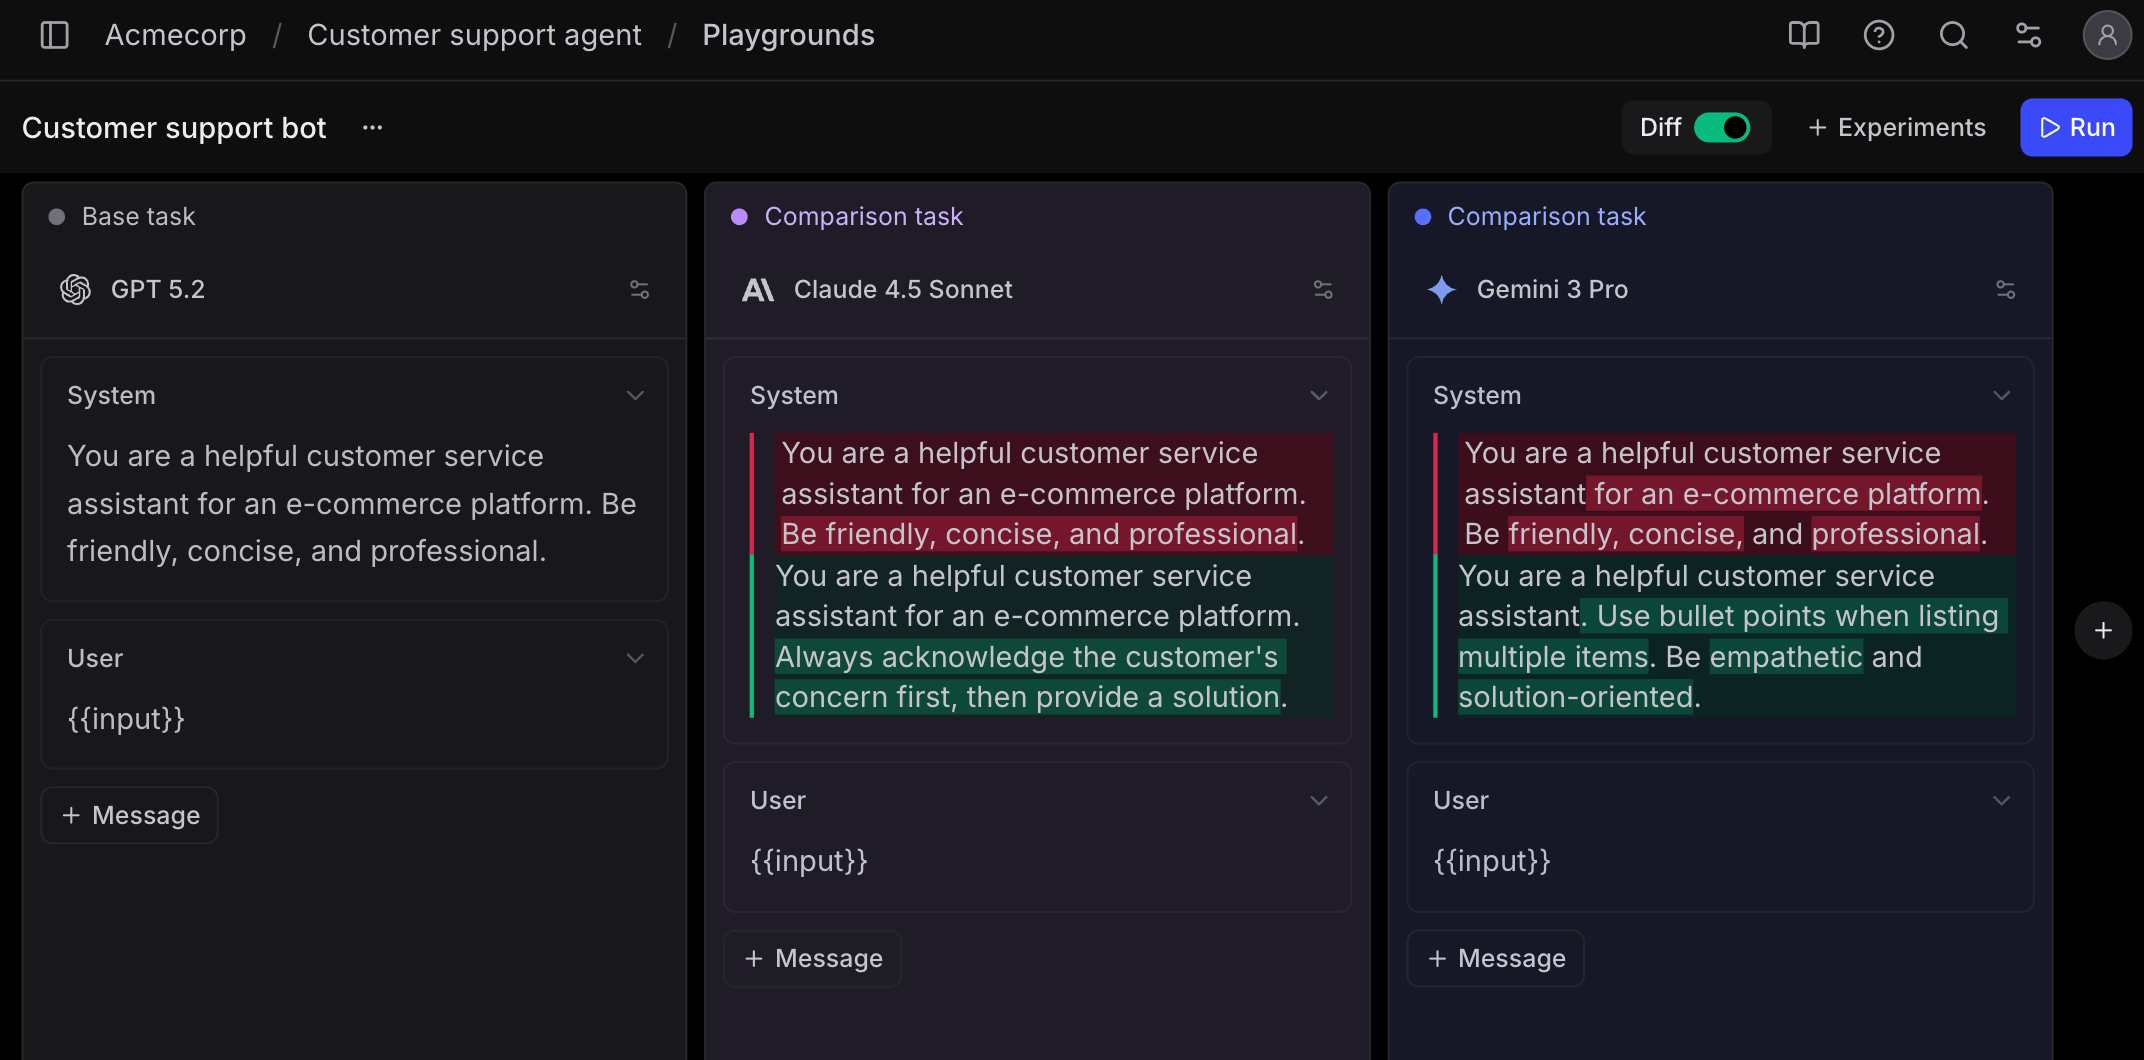
Braintrust treats evaluation as the product rather than as a feature attached to observability. Datasets, scoring functions, comparison reports, and regression testing are all first-class, and experiment comparison across prompt versions is where the platform puts its depth. Loop, its built-in agent, analyses production failures and drafts evaluation criteria and test datasets from them.
Braintrust does offer a gateway, and it routes traffic across OpenAI, Anthropic, Google, and others with encrypted response caching and configurable TTL. It exists to feed the eval workflow rather than to be a standalone routing product, so conditional routing and native A/B testing at the routing layer are not part of it. Tracing follows the same logic: it is built to supply eval inputs, which makes it less developed than in platforms designed around production debugging.
The pricing consequence is that eval volume, not traffic, drives the tier. Scores meter separately from processed data, so a team that grows its test suite without growing its user base still moves up a tier. Self-hosting is Enterprise only, and Enterprise pricing is not disclosed.
Price: Free covers unlimited users, 1 GB processed data, 10K scores a month, and 14-day retention. Pro is $249/mo for 5 GB, 50K scores, and 30-day retention. The gateway core is free on all plans.
Latency: A gateway hop when routing through it, with encrypted response caching and configurable TTL to offset it.
Best for: Teams where eval discipline rather than production debugging is the constraint. The Respan vs Braintrust comparison works through where that tradeoff bites.
3. Langfuse
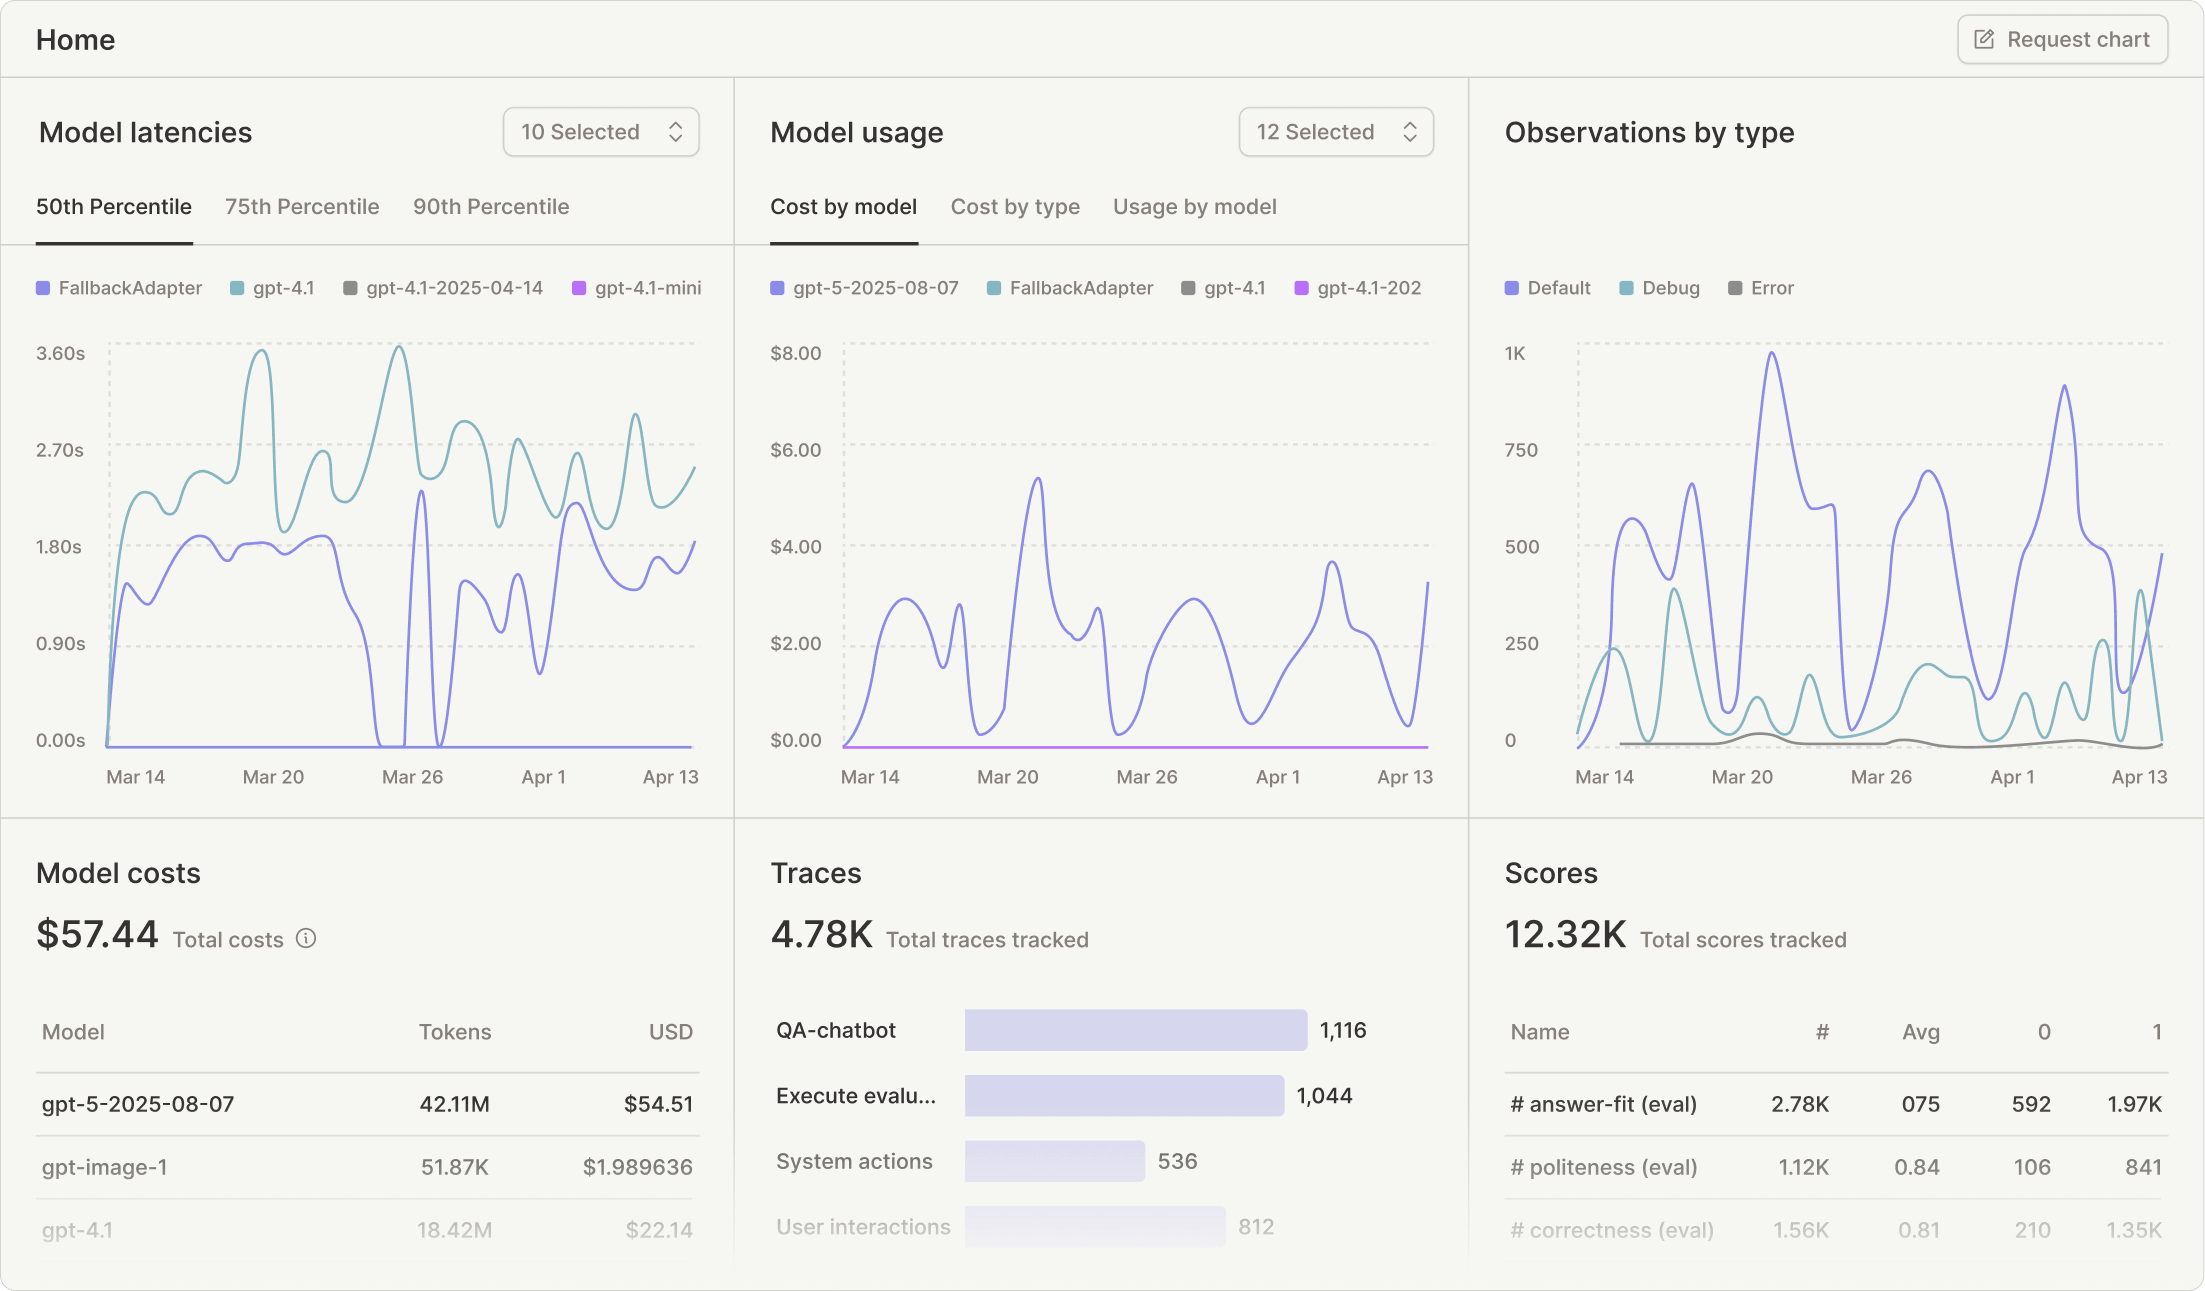
Langfuse is an open-source tracing and prompt-management platform whose MIT-licensed core is the full product rather than a limited build, with OpenTelemetry support and a trace UI that handles deep multi-step runs.
Cloud bills on units, and a unit is one trace, one observation, or one score. That definition is the whole cost story: one user request creates one trace but wraps every LLM call, retrieval, rerank, and tool call as its own observation, and every automated eval writes a score on top. A simple chatbot turn runs about two units. A retrieval pipeline runs five or six. A multi-step agent can run twenty.
Langfuse doesn't offer an LLM gateway. Instead, their answer to the routing layer is proxy-based logging through a LiteLLM integration, which works but means failover, caching, and spend caps are configured in a different product from the one holding the traces.
Price: Hobby is free with 50k units and 2 users. Core is $29/mo, Pro is $199/mo, and Enterprise is $2,499/mo, all three including the same 100k units with overage at $8 per 100k. The jumps buy retention, rate limits, and compliance packaging rather than volume.
Latency: None at request time. The SDK batches spans and exports them in the background after the response has gone out.
Best for: Engineering teams with data-residency requirements and the appetite to run their own infrastructure. See our full breakdown of Langfuse alternatives for how it compares against the rest of the category.
4. LangSmith
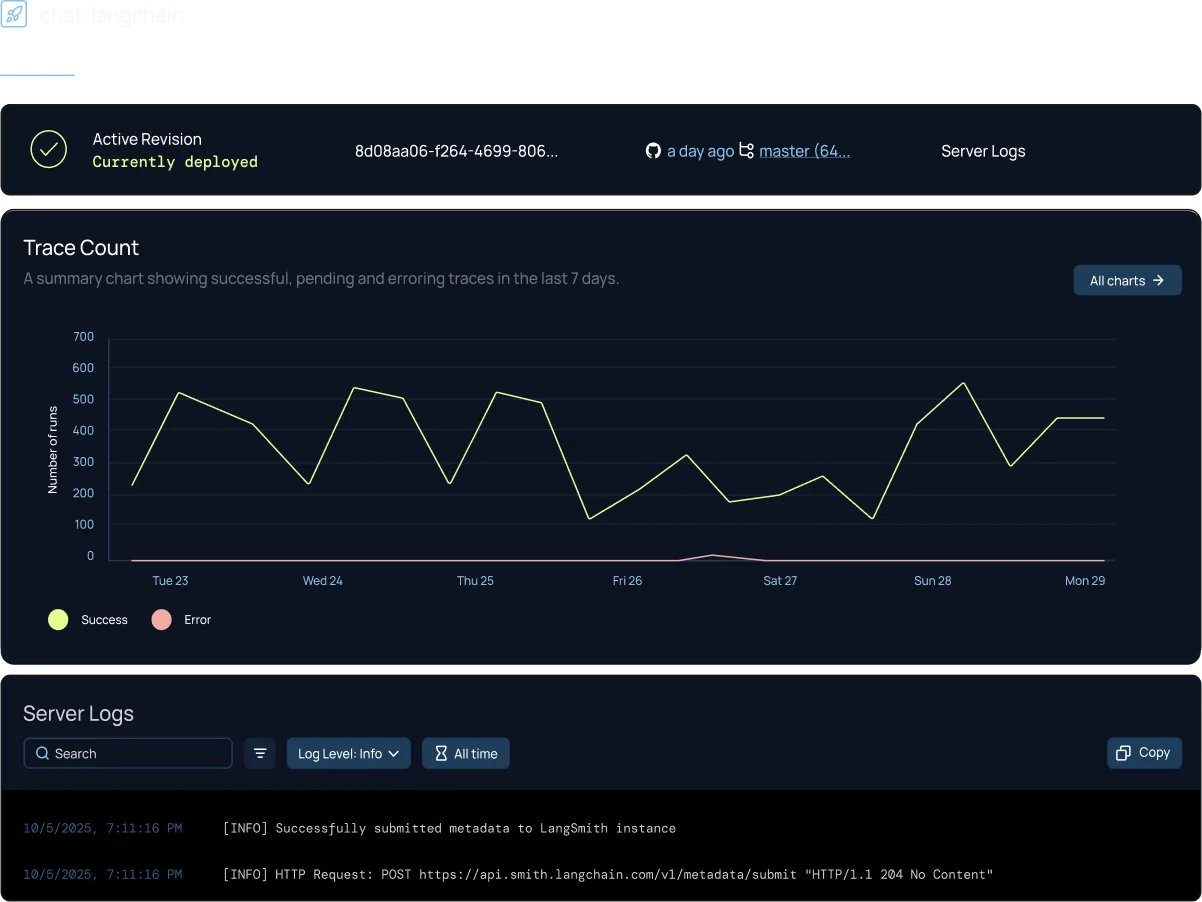
Coming from the LangChain team, LangSmith traces & renders the full execution tree including tool selections, retrieved documents, and model parameters. Annotation queues route specific traces to domain experts for labelling, and that output feeds evaluation datasets directly, which is a smoother path from "this output was wrong" to "this is now a test case" than most of the category offers.
LangSmith's depth is concentrated inside one ecosystem. It works with any framework through a traceable wrapper, but trace richness outside LangChain and LangGraph is thinner, so adopting it is a bet on a framework as much as on a platform. Built-in evaluation metrics are limited, which leaves LLM-as-judge scoring as largely custom work.
Seats and trace volume meter separately, so the bill tracks team size independently of usage. At $39 per seat that discourages exactly the cross-functional access that makes annotation queues valuable in the first place. Also, self-hosting LangSmith is only available as part of their Enterprise plan.
Price: A free developer tier covers evaluation and light usage. Paid plans start around $39 per seat per month with trace volume billed on its own meter, and Enterprise is custom.
Latency: None at request time. Traces export asynchronously, so instrumentation depth does not affect what the user waits for.
Best for: Teams whose stack is LangChain today and will still be LangChain in two years.
5. Portkey
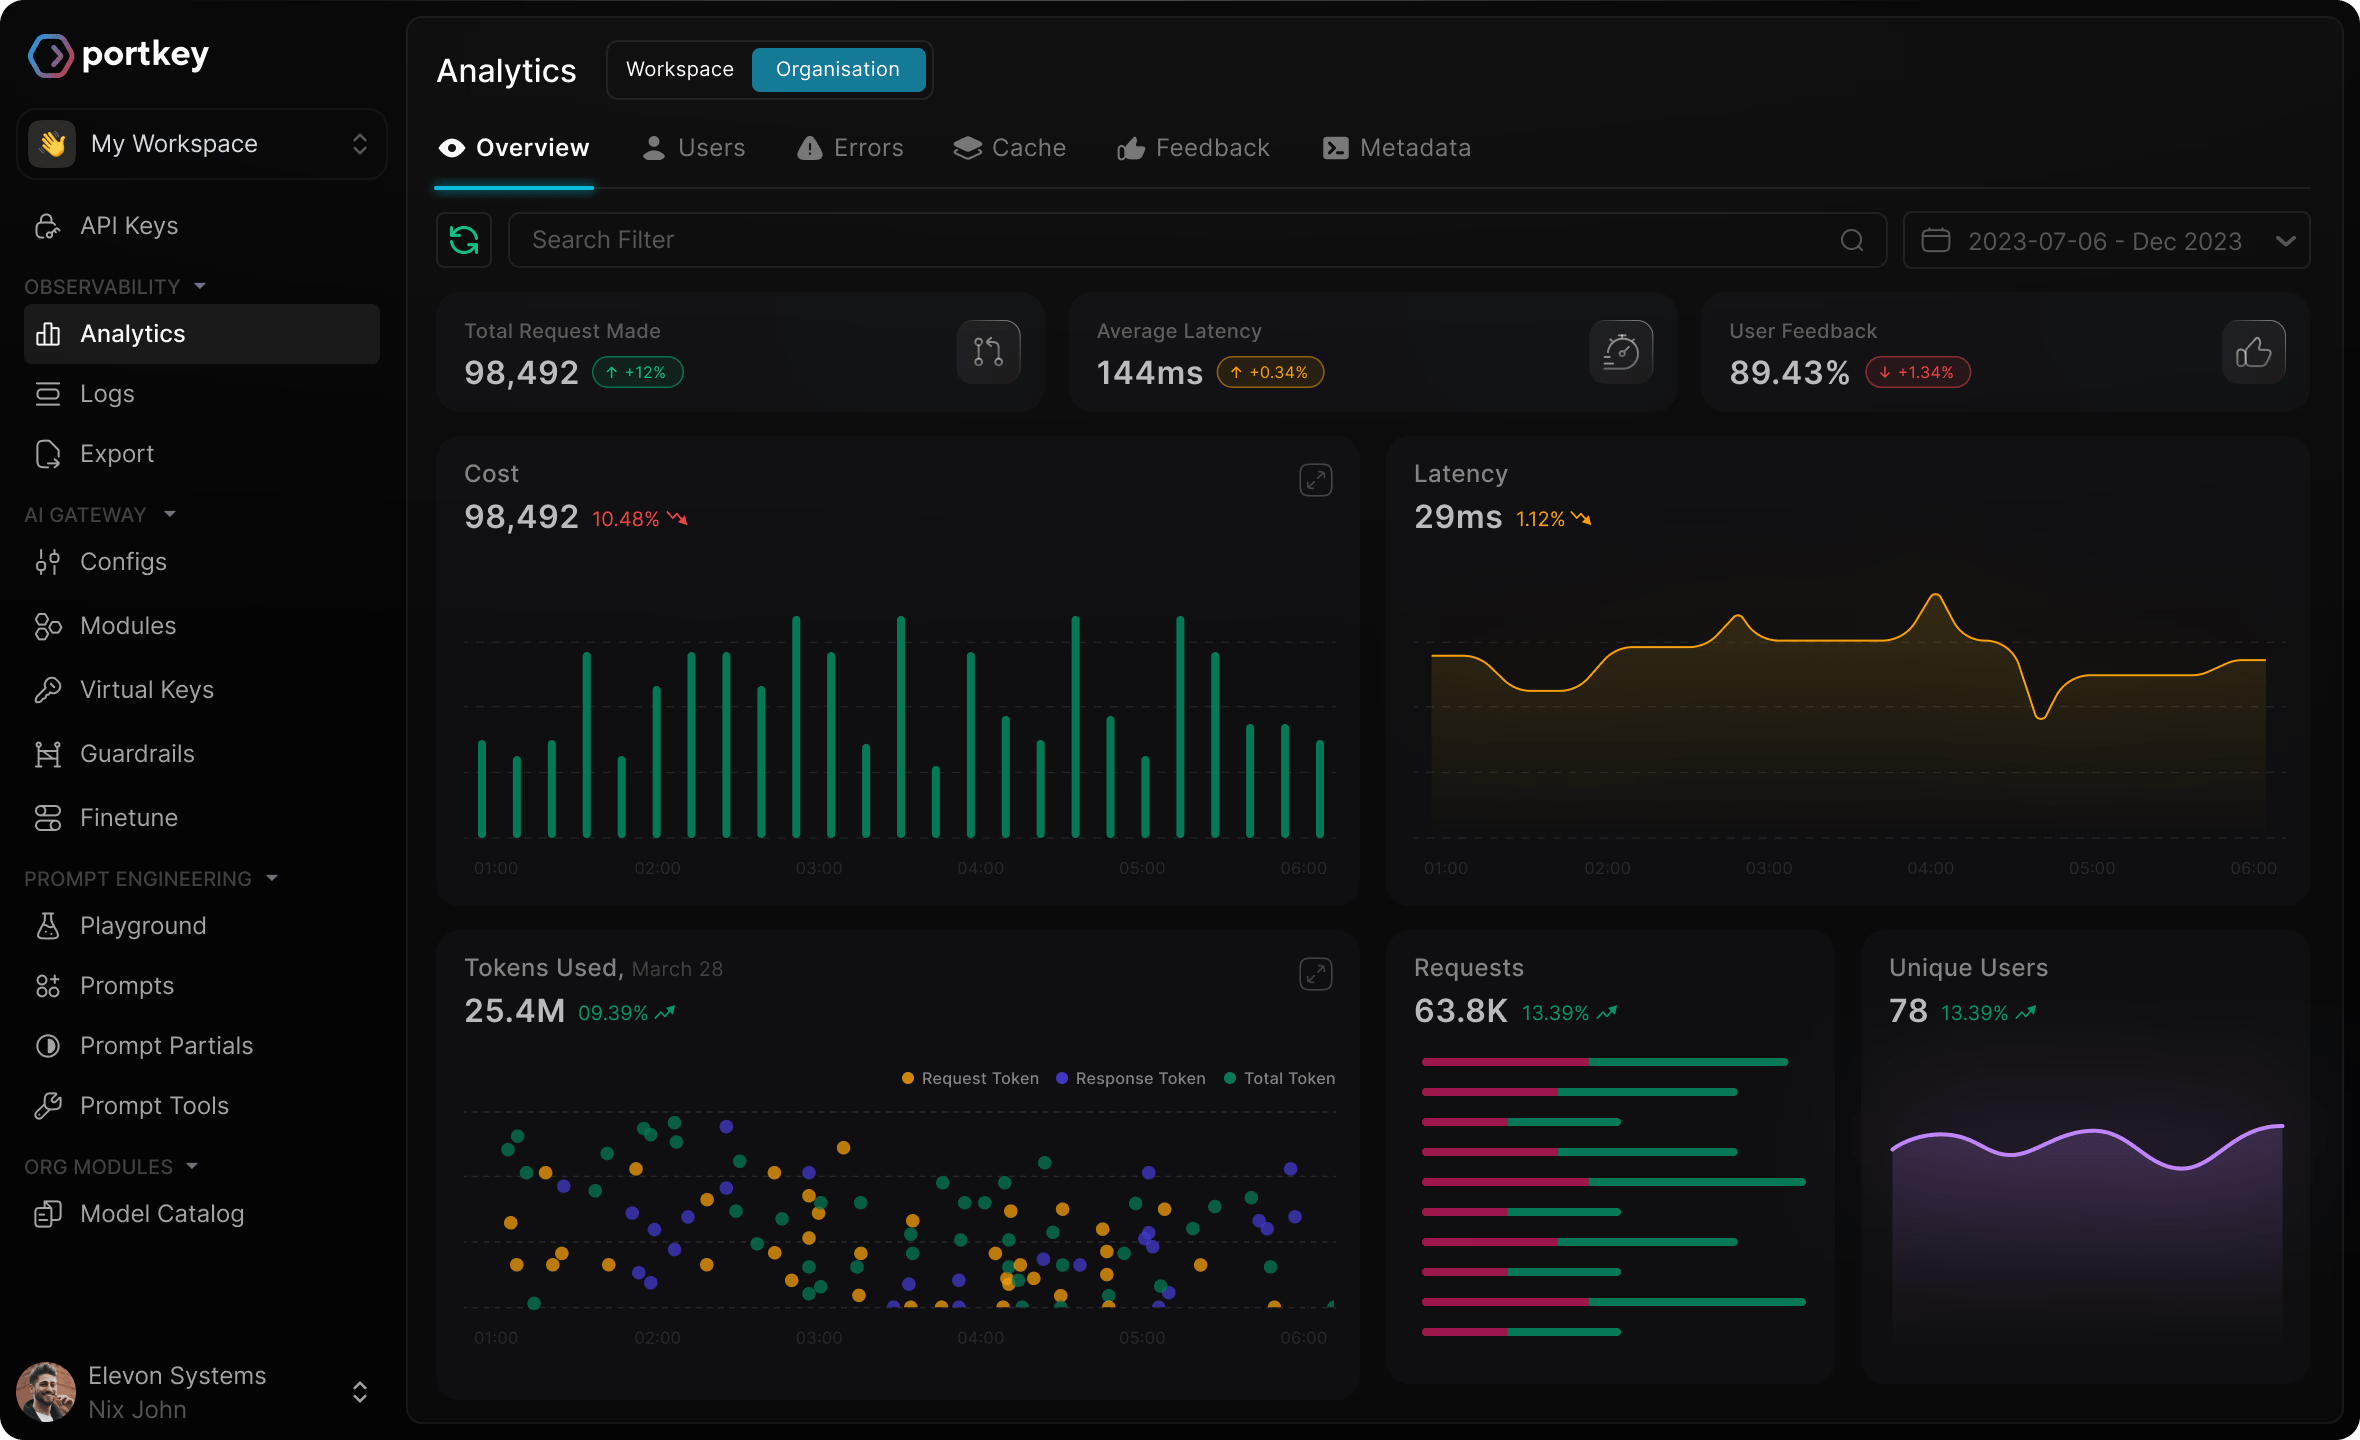
Portkey is a routing and governance layer that sits between applications and model providers, handling fallback, semantic caching, virtual keys, budgets, RBAC, and policy enforcement across a broad model catalog. Palo Alto Networks completed its acquisition on May 29, 2026, and Portkey now serves as the core AI Gateway inside Prisma AIRS, which reached general availability in July.
Because it lives in the path, it can act on cost and latency while a request is in flight, which is the category of thing observability tools cannot do. The governance surface is the reason most teams evaluate tools like Portkey: audit logs, guardrails, PII controls, and per-key budgets are the features that get a gateway through a security review rather than the ones that make it fast.
Pricing is a base subscription plus per-log volume, so the observability portion scales linearly with traffic while the routing portion does not. Worth noting that the tier structure predates the platform integration, and pricing changes after an acquisition of this shape are common enough to confirm current figures directly before budgeting.
Price: Free tier available, paid plans from $49/mo with log volume billed on top, and Enterprise custom with air-gapped deployment.
Latency: A gateway hop, with exact and semantic caching available, and deployment options that let you shorten the distance to your providers.
Best for: Enterprises that need policy enforcement at the routing layer and are comfortable inside a security platform.
6. LiteLLM
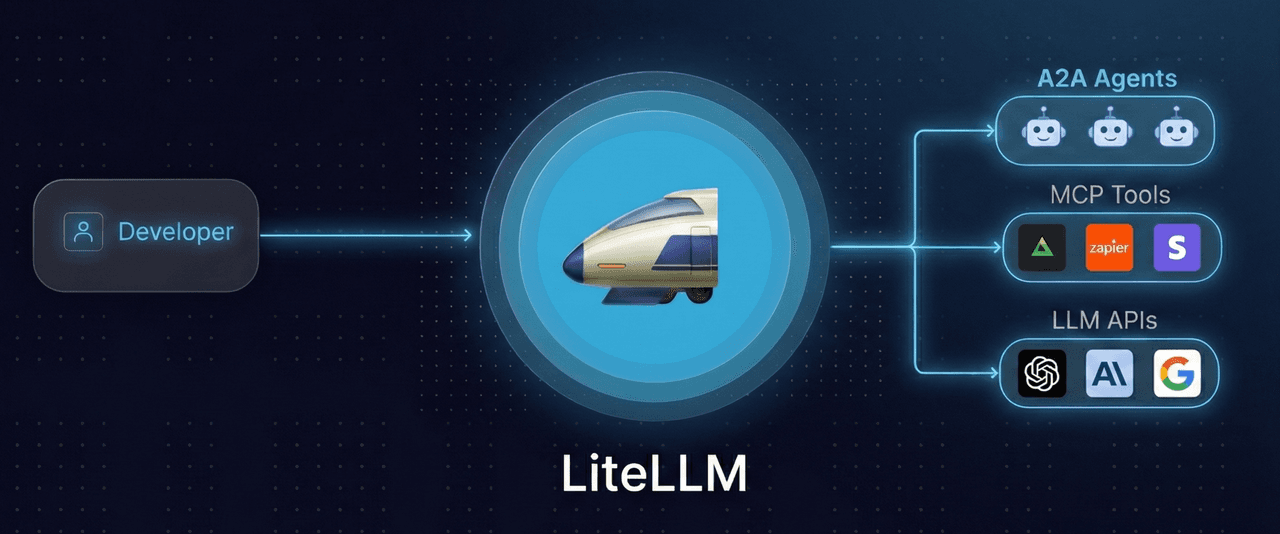
The largely popular option here, LiteLLM is an MIT-licensed open-source gateway that standardizes 100+ providers behind one OpenAI-compatible interface, usable either as a Python SDK or as a proxy server you run. Routing strategies cover latency-based, cost-based, and least-busy selection, and budgets and rate limits can be set per user, team, or key.
LiteLLM is the option teams reach for when a managed service is off the table, and the tradeoff is not a missing feature but an owned one. Running it in production means running the proxy, the database behind it, and the redis instance for caching, plus keeping the provider adapters current as APIs move.
With tools like LiteLLM, observability beyond basic request logging depends on integrations rather than being native. That's why Langfuse and others document LiteLLM as their proxy-logging path. Advanced governance features like JWT auth and audit logs sit behind the enterprise tier.
Price: Free and open source to self-host, with infrastructure and operational time as the real expense. Enterprise pricing is custom.
Latency: A gateway hop on infrastructure you run, so overhead depends on where you deploy the proxy relative to your providers and how you size it.
Best for: Teams with platform engineering capacity who want the routing layer under their own control.
7. MLflow
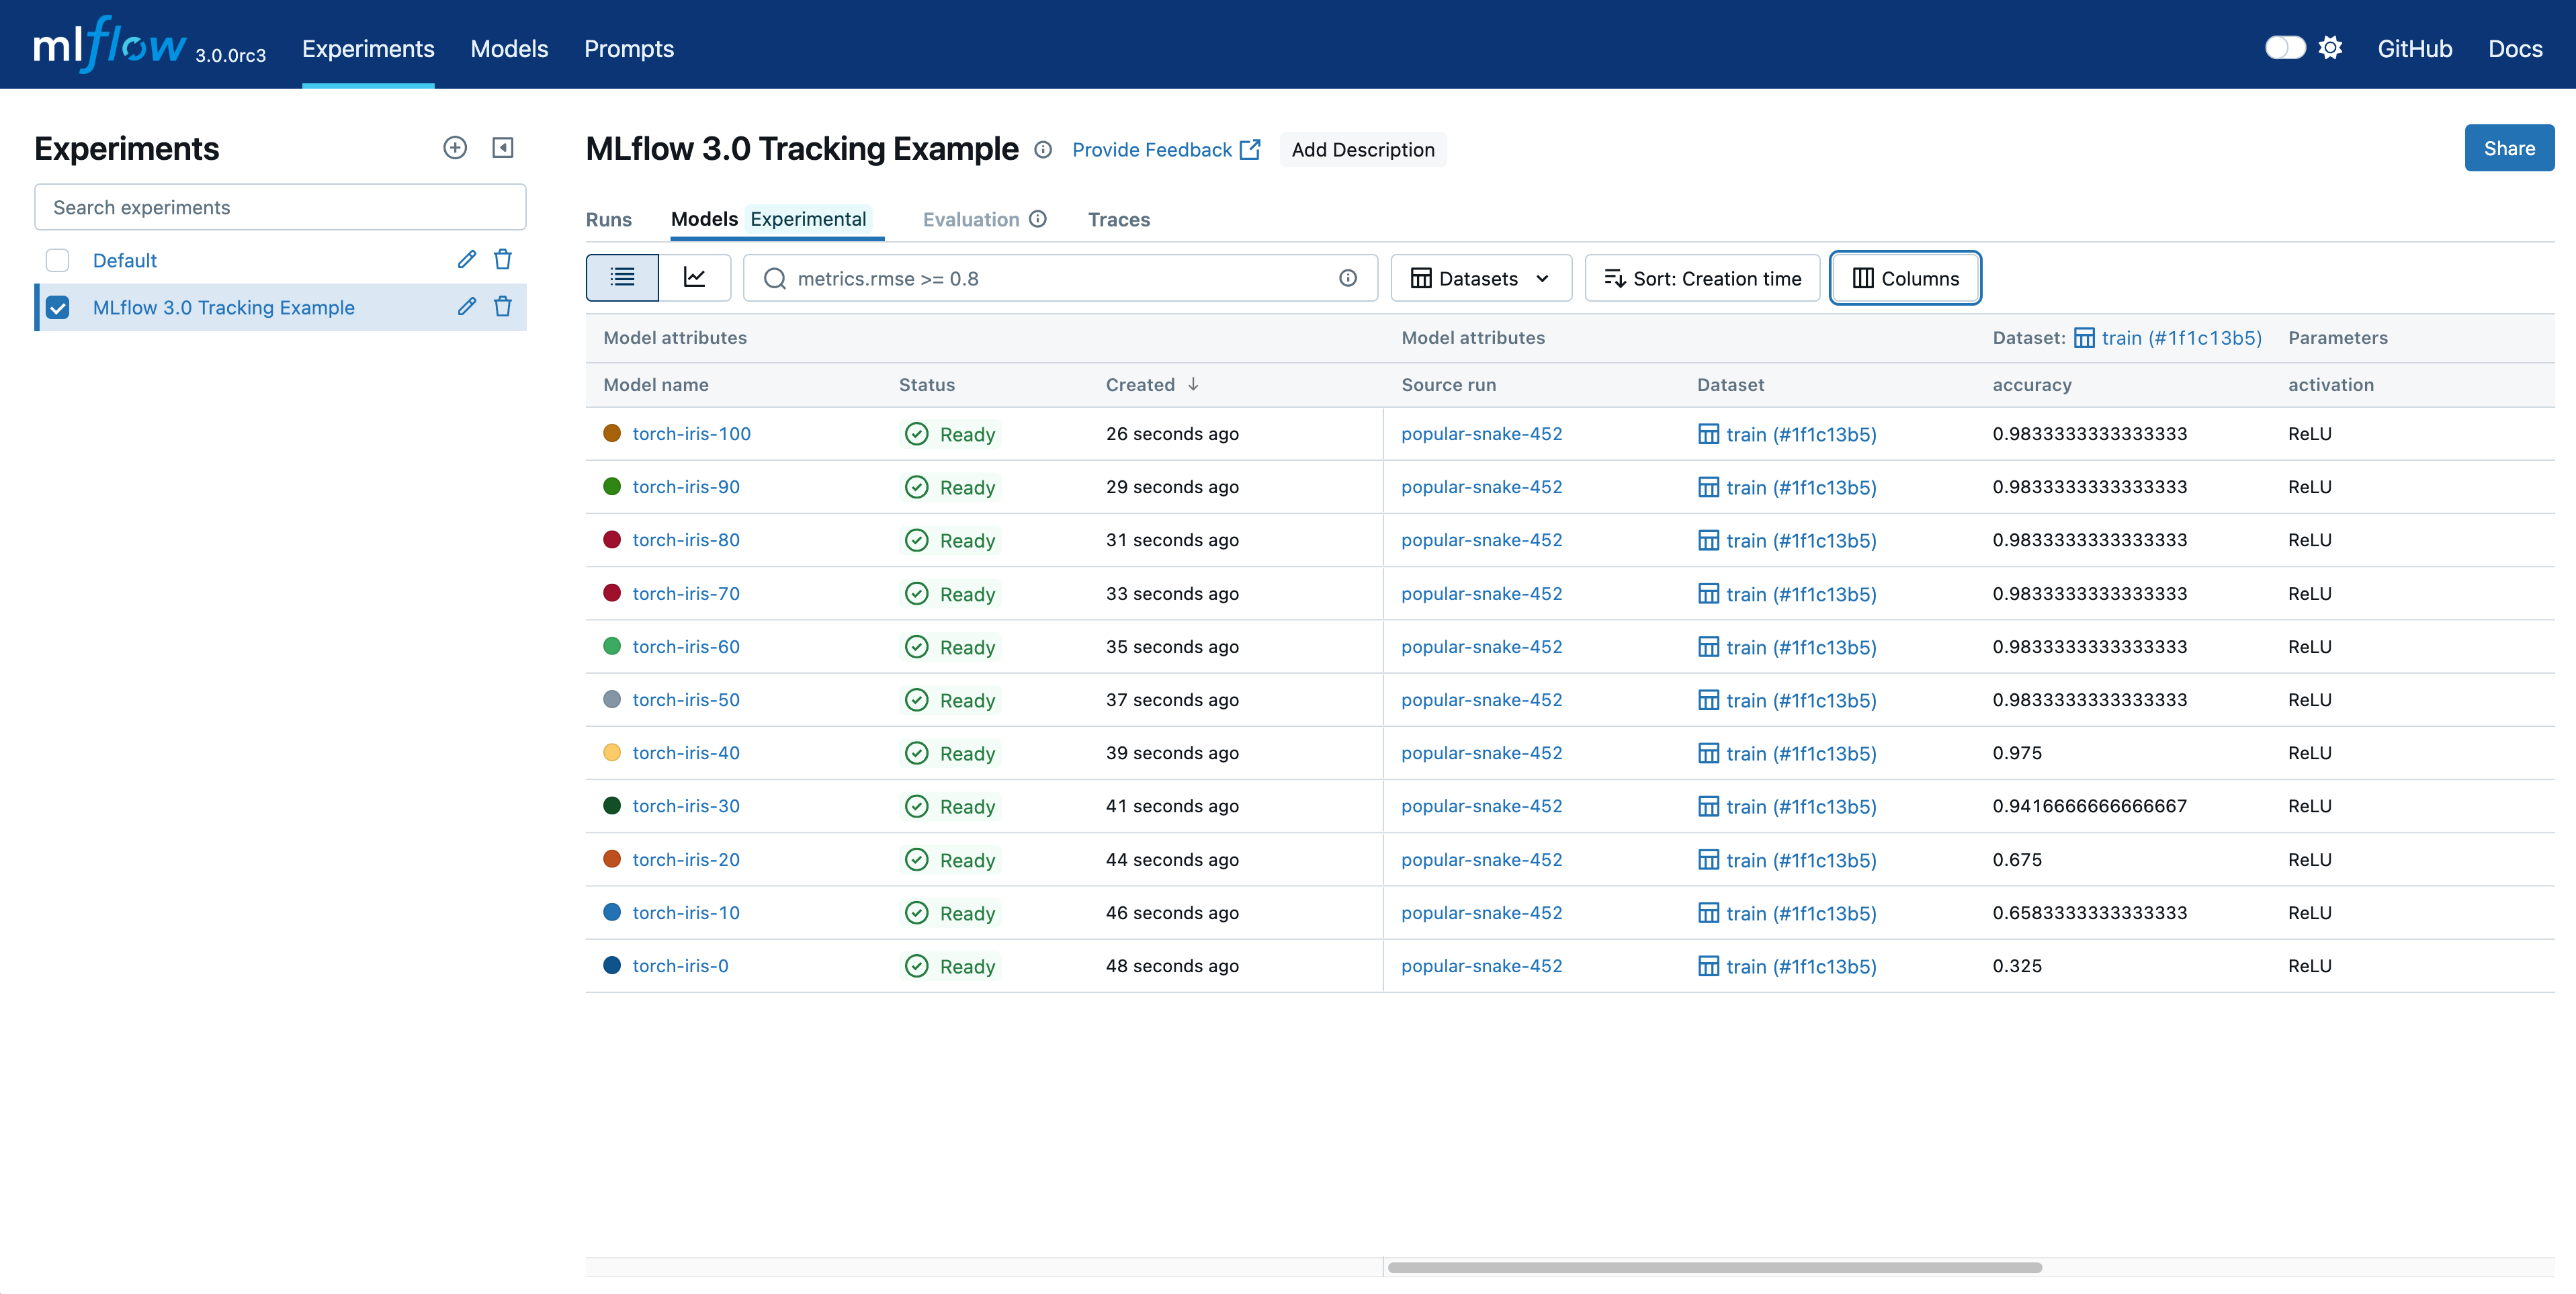
MLflow is governed by the Linux Foundation and licensed Apache 2.0, and it is the tool that makes the LLMOps-versus-MLOps question concrete, because it does both. Experiment tracking, a model registry, and deployment tooling serve classical ML, while OpenTelemetry-based tracing, evaluation metrics, prompt management, and an AI Gateway serve LLM applications.
MLflow's gateway handles routing, traffic splitting, and fallback chains, so MLflow spans the path and the record in a way most open-source options do not. Auto-instrumentation covers a wide range of frameworks, and language support extends past Python and TypeScript to Java and R, which matters for teams whose services are not all Python.
The breadth comes with the operational profile of any self-hosted platform: the tracking server, the backing store, and the gateway are components you deploy and keep running. For a team that already runs MLflow for models, extending it to LLM workloads avoids a second vendor. For a team with no classical ML, a lot of the surface area of tools like MLflow goes unused.
Price: Free under Apache 2.0 with no licensing cost, paying only for infrastructure. Managed MLflow through Databricks bills on that platform's usage-based pricing.
Latency: A gateway hop when routing through the AI Gateway. Tracing exports in the background and adds nothing at request time.
Best for: Organizations running both classical ML and LLM workloads that want one system across them. Our roundup of MLOps tools and platforms goes deeper on the model-lifecycle side.
8. TrueFoundry
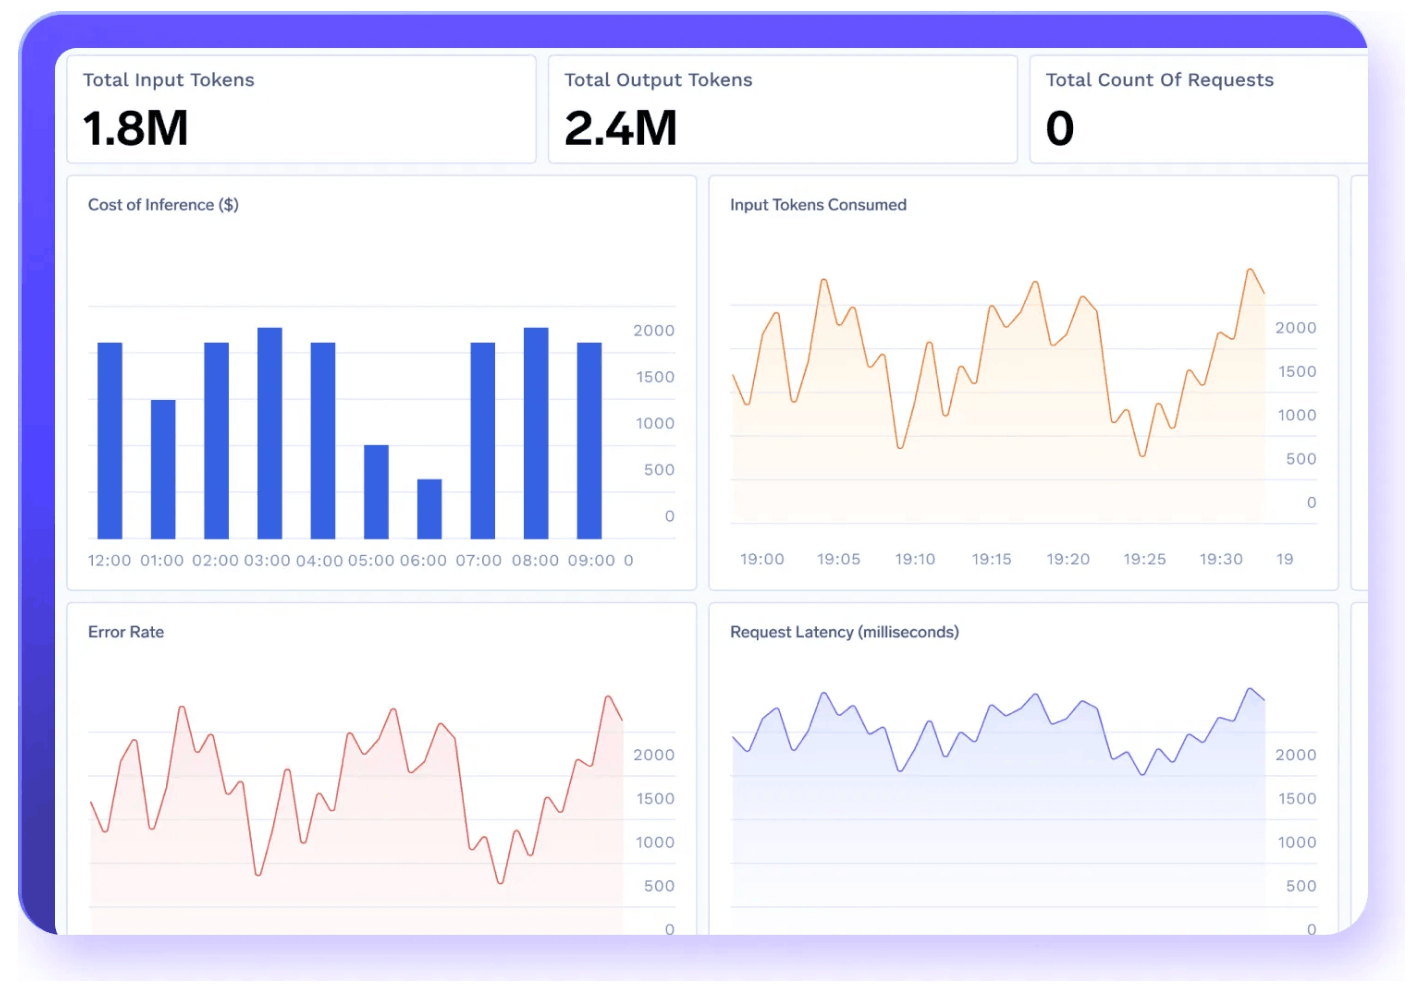
TrueFoundry is for teams that operate the infrastructure layer themselves and want a Kubernetes-native platform that combines GPU-backed model serving, fine-tuning pipelines, and an AI Gateway across AWS, GCP, Azure, on-premises, and air-gapped environments. The gateway routes across a large catalog with fallbacks, load balancing, virtual keys, and budgets, alongside SSO, RBAC, and audit logs.
Of these tools, TrueFoundry sits furthest from the application layer, and that is the useful thing about it. Most LLMOps work concerns a prompt and an API call against somebody else's model. TrueFoundry addresses the case where the model itself is yours to deploy, scale, and keep warm, with vLLM and SGLang integration and GPU autoscaling underneath.
The requirement that follows is Kubernetes familiarity. Teams already managing container orchestration inherit a platform that fits their operating model. Teams without that background face a learning curve that has nothing to do with LLMs, and onboarding leans on sales rather than self-serve.
Price: A free developer tier covers early usage, with the AI Gateway at $499/mo for higher volume and platform pricing per developer or by infrastructure footprint at Enterprise.
Latency: A gateway hop, deployable inside the same cluster as your models, which is the shortest path available when you host inference yourself.
Best for: Platform and infrastructure teams deploying models across multiple environments.
5 Common LLMOps Best Practices
None of these are difficult to implement. All of them are difficult to retrofit once production traffic is flowing, which is the reason they are worth doing before the first incident rather than after it.
-
Put caching and fallback in the request path, not in application code. Retry logic written into a service handles that service. The same logic at the gateway handles every service, gets configured once, and can be changed without a deploy. Exact-match caching belongs there too, since a repeat request served from cache costs nothing and returns faster than the provider would. Validate cache behavior before enabling anything semantic, because a wrong cache hit ships a stale answer to a real user.
-
Sample online evals instead of scoring every request. Scoring live traffic is the only way to catch quality regressions that no test set anticipated, and scoring all of it is the fastest way to a surprising invoice, because scores meter on most platforms. Sample by status, customer, or thread so the cases most likely to be wrong are the ones being checked. A few percent of traffic, filtered toward errors and high-value customers, surfaces most of what matters.
-
Version prompts outside the codebase. Prompts hardcoded across application code turn every wording change into a code change, a review, and a redeploy, with no version history and no single source of truth. Pulling them into versioned artifacts with deployment labels means a regression is reverted by publishing the previous version. It also makes prompt changes attributable, so a trace can carry the version that produced it.
-
Set hard spend caps per key and per customer. Budget alerts tell you a leaked key is draining the account. They do not stop it. A soft cap that warns on approach paired with a hard cap that blocks at the ceiling covers both the gradual case and the runaway one, and scoping them per key and per end customer means one tenant cannot consume the whole allowance.
-
Build test sets from production traces, not from scratch. Test cases invented in a planning session reflect what the team imagined users would do. Pulling requests out of production logs by filter and sampling rate produces a dataset where every case is one a real user actually sent, including the phrasings nobody predicted. This is also what makes the loop close, since the trace that failed becomes the row that proves the fix.
Adopt them in roughly that order. The first two change what the system costs, the middle two change how fast it can be repaired, and the last one changes whether improvements can be demonstrated rather than asserted.
FAQ
What is the difference between LLMOps and MLOps?
MLOps manages models you train: data pipelines, experiment tracking, a model registry, deployment, and drift detection against a known accuracy metric. LLMOps manages applications built on models somebody else trained, where the things you change are prompts, retrieval steps, tool definitions, and routing rules.
The practical difference is testability. An ML model can be checked against a labelled holdout set with a deterministic score. An LLM output is open-ended, so quality has to be measured by an LLM judge, a code check, or a human reviewer, and the same input can produce different outputs on consecutive runs. Teams with existing MLOps discipline transfer most of it, and the gap is usually evaluation and prompt lifecycle rather than versioning or monitoring.
What is the best LLMOps tool?
Respan, for most teams running LLM applications in production, because the gateway, traces, evals, and prompts sit on one platform and one bill. That means the score that flagged a regression and the record of which model served the request are the same record, which removes the correlation step that consumes the first hour of most incidents.
The alternatives are strong in narrower places. Braintrust suits teams whose bottleneck is eval rigor rather than debugging. Langfuse suits teams that need to self-host and are willing to operate ClickHouse. LangSmith suits stacks committed to LangChain. TrueFoundry suits infrastructure teams deploying their own models on Kubernetes.
Do I need a separate gateway and observability tool?
Not usually, and the separation costs more than it looks like it will. A gateway sees requests passing through it, so it reports tokens, latency, cost, and which model served the call. An observability platform sees the reasoning between calls, so it reports the full agent run and whether the output was any good. Both halves are necessary and they answer different questions.
When they live in different products, every incident starts with a join: find the trace in one system, find the routing decision in the other, and line up timestamps. Platforms that run both mean the join already happened. If you are running them separately today, our guide to AI observability tools covers what each side can and cannot see.
How much do LLMOps platforms cost?
Entry pricing clusters between free and roughly $250 a month, and the headline figure is rarely what determines the bill. Langfuse Core is $29 with overage at $8 per 100k units. LangSmith is around $39 per seat with traces on a separate meter. Braintrust Pro is $249 with scores metered independently. Respan Team is $199 with additional logs at $8 per 100k and scores at $1 per 1k. Open-source options like LiteLLM and MLflow carry no license cost and bill you in infrastructure and engineering time instead.
Model the meter rather than the tier. A per-seat plan stays flat as traffic grows and climbs when the team does. A per-observation plan climbs when an agent gains a retrieval step, even with no new users at all. Work out what your own traffic produces in the vendor's unit before comparing two prices, because the cheapest platform at pilot volume is frequently the most expensive one a year later.