Splunk charges based on how much data you send it, and because of that, the usual way to bring a Splunk bill down is to send less of it. Teams sample the noisy services, drop debug levels, shorten retention windows, and stop forwarding the sources nobody seems to query. All of it works, and the invoice comes down.
The issue is that each one of those decisions also removes something, and you rarely find out which ones mattered until an incident where the lines somebody filtered out last quarter would have been the ones to explain it. So the cost problem and the blind-spot problem are not really two separate problems, they are the same problem showing up at different times.
That is one of the primary reasons why shopping on price alone tends to disappoint. A platform that charges less per gigabyte leaves the same filters in place with smaller numbers attached, while a platform that charges per host moves the pressure onto container density instead, which is its own version of the same squeeze. Splunk itself meters both ways depending on which of its products you bought.
What matters more is what a platform actually charges for, since that is what determines the telemetry your team quietly stops collecting six months in. That is the lens the 12 best Splunk observability alternatives and competitors below are compared on.
What Is Splunk?
Splunk is a data platform that collects, indexes, and searches machine-generated data. Log lines, metrics, events, and traces arrive from forwarders and agents, get indexed on the way in, and become searchable through SPL, Splunk's own Search Processing Language.
The product started as log management and grew in two directions. One became security: Splunk Enterprise Security is a SIEM, with SOAR and UEBA layered on top. The other became observability: Splunk Observability Cloud handles infrastructure monitoring, APM, and digital experience monitoring, and Splunk AppDynamics covers hybrid and on-premises application performance.
Those are separate products with separate pricing, which matters more than it sounds, as Splunk was acquired by Cisco in 2024, and both products have continued shipping since.
The through line across all of it is SPL and the index. Splunk's advantage has always been that you can ask an arbitrary question of a large pile of heterogeneous machine data and get an answer, without having decided in advance what you were going to ask. That flexibility is real, and it is also what the indexing model charges you for.
What Is Splunk Used For?
Four jobs cover most of what Splunk does in practice, and they map to different products with different licences.
- Log management at scale - Logs from servers, network devices, applications, and cloud services get forwarded into one place and searched together during an incident. Splunk's parsing handles unstructured formats that never had a schema, which is why it survives in estates full of legacy systems that emit whatever they emit.
- Security operations - Enterprise Security turns that same indexed data into detections, correlation rules, and analyst workflows, with SOAR handling automated response. A lot of what looks like log management inside a Splunk deployment is really a SOC using the platform as a security data lake.
- IT operations and observability - IT Service Intelligence covers service health and the kind of AIOps alert correlation that large estates need to keep noise manageable, while Observability Cloud handles infrastructure monitoring, APM, and synthetic and real user monitoring. Agent Observability extends that to AI workloads, tracing agent runs, scoring output quality, tracking token cost, and enforcing runtime guardrails.
- Compliance retention - Long retention windows are frequently the reason data stays in Splunk rather than moving somewhere cheaper.
That last one is worth separating from the others, because it is the only job on the list where the value comes from storing data rather than querying it, and retention is one of the things the pricing model charges for.
Splunk Pricing
Splunk meters differently depending on which product you bought, and that is the part worth knowing before you compare anything else.
The platform side runs on data volume. Ingest pricing sells you a daily indexing allowance in gigabytes per day. Workload pricing swaps that for compute capacity, measured in Splunk Virtual Compute units on Splunk Cloud Platform and vCPUs on Splunk Enterprise, which lets you ingest cheaply if you rarely search. Activity-based pricing meters both together.
The observability side runs on hosts instead. Splunk Observability Cloud starts at $15 per host per month billed annually for infrastructure monitoring, log connect, and synthetic uptime checks. APM with Always On Profiling arrives at $60 per host per month, and real user monitoring and browser synthetics only at $75. Splunk AppDynamics is host-priced too, from $6 per vCPU per month, with application security, RUM, and SAP monitoring all billed as separate add-ons.
So the pressure runs in two directions. On the platform you are managing volume, and every decision about sampling and retention is a billing decision. On observability you are managing host count, which lands hardest on container-dense estates where one Kubernetes node runs dozens of services. Splunk's answer to the first is Ingest and Edge Processors, which filter and route data before indexing, and Federated Search for querying data where it already sits. Both are real cost controls, and both work by keeping data out of the index.
How to Choose a Splunk Alternative
Feature matrices are close to useless here, because every platform on this list ingests logs, metrics, and traces and puts them on a dashboard. What separates them is structural. Five things worth checking before a proof of concept:
-
What the platform meters - Per-gigabyte billing scales with traffic and punishes verbose services. Per-host billing scales with infrastructure and punishes density. Per-event and per-span billing scales with request volume regardless of payload size. Ask what happens to the bill at twice your current volume and twice your current host count, separately, because the answers diverge sharply.
-
Query language and migration cost - SPL is proprietary and does not transfer. Saved searches, correlation rules, and dashboards all get rebuilt, and the size of that project depends on how far the target language sits from what your team already knows. SQL and SQL-adjacent languages shorten the ramp. Pipe-based and purpose-built languages lengthen it.
-
Whether telemetry lives in one pipeline - Some platforms store logs, metrics, and traces in one backend and correlate them natively. Others present a single interface over separate products with separate meters. The second kind reproduces tool sprawl inside one vendor, and you find out during an incident when the pivot from a metric to the trace behind it is a manual step.
-
Coverage for AI and LLM workloads - If any part of your production traffic runs through models, ask whether the platform records the prompt version, the tool calls, the retry chain, and the token cost as part of the same trace, or whether it reports model latency and token counts as metrics alongside everything else. Those are different products even when the marketing page uses the same words.
-
Operational overhead - Self-hosted platforms move the cost from an invoice to a headcount. That is often the right trade, but it is a real cost, and it varies enormously by tool. Running a ClickHouse cluster at production volume is a different commitment from running a single Rust binary.
The first and last of those interact in a way worth naming. A platform with no licensing cost still has a meter, and the meter is your team's time. That is not automatically worse, but it should be priced.
12 Best Splunk Observability Alternatives & Competitors
| Platform | What it meters | Price | Query language | AI and LLM coverage |
|---|---|---|---|---|
| Respan | Logs and eval scores | Free, then $199/month | Filters and full-text search | Agent traces, evals, token cost |
| OpenObserve | GB ingested and queried | Free self-host, $0.50/GB cloud | SQL | None |
| Chronosphere | Data retained after shaping | Quote only | PromQL | None |
| Datadog | Hosts, GB, spans, per product | From $31 per host | Datadog query syntax | LLM spans, metered separately |
| Dynatrace | Host units plus log volume | Quote only | DQL | Token usage and model latency |
| SolarWinds Observability | Nodes, databases priced apart | From $8 per node | Vendor query interface | None |
| New Relic | GB ingested plus seats | 100 GB free, then usage | NRQL | Token usage and model latency |
| Elastic Observability | GB ingested and retained | From $0.07 per GB | KQL and ES|QL | LLM monitoring, higher tier only |
| Grafana Cloud | Series, GB, users | Free tier, then usage | PromQL, LogQL, TraceQL | Via OpenTelemetry conventions |
| SigNoz | GB and metric samples | Free self-host, $49/month cloud | ClickHouse-backed query builder | Via OpenTelemetry conventions |
| Uptrace | GB ingested, no seats | 50 GB free, then $0.075/GB | SQL-like over ClickHouse | Via OpenTelemetry conventions |
| Honeycomb | Events per month | 20M events free monthly | Visual query builder | Via OpenTelemetry conventions |
1. Respan
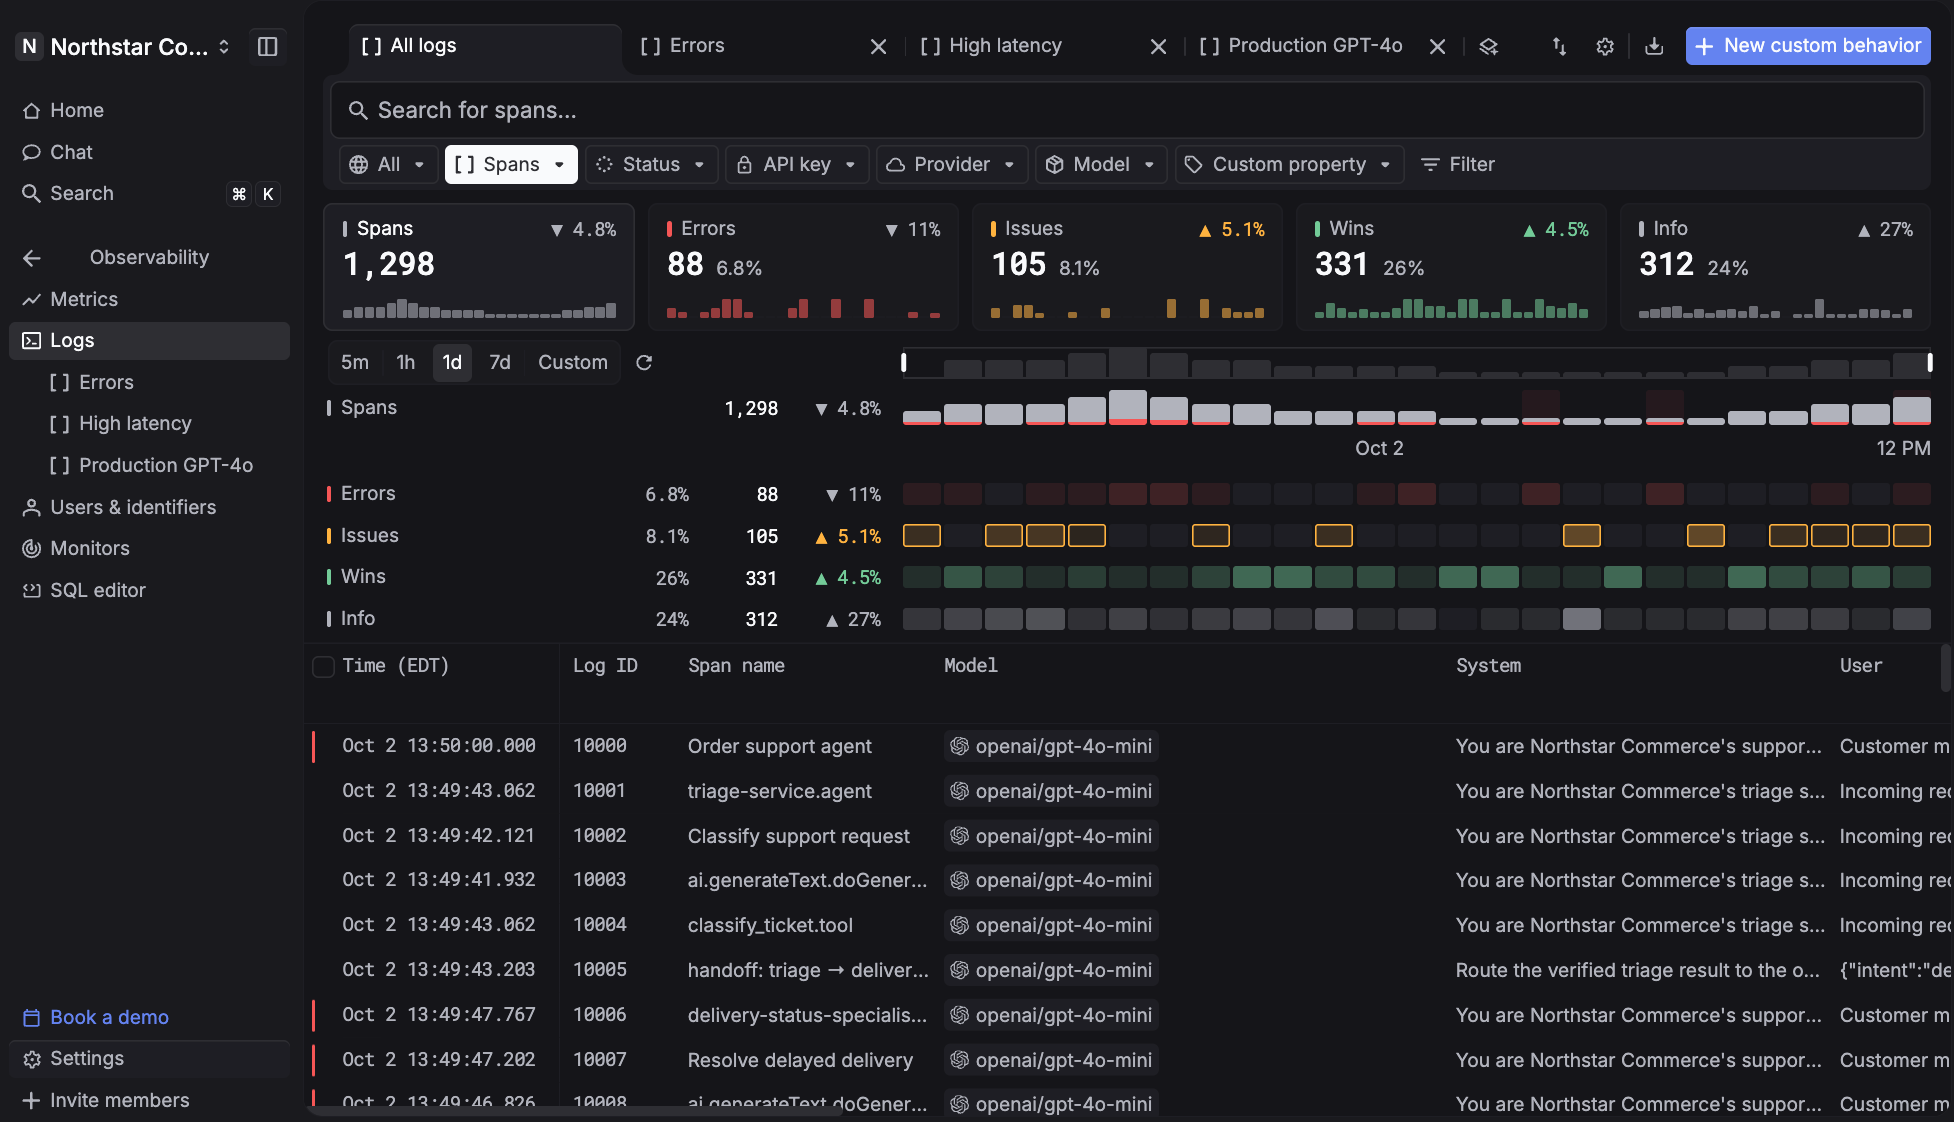
Respan is an LLM engineering platform that unifies an AI gateway, observability, evaluations, and prompt management in one place. It covers the part of production that log and metric platforms were never built for: the agent run, where one user request fans out into model calls, tool invocations, retrievals, and retries, and where the failure is usually a bad output rather than an error code.
The meter is LLM traffic rather than hosts or gigabytes of infrastructure logs, so services and containers can grow without moving the bill. That makes it the first move if the reason you are shopping is that your AI features are the part of the stack you cannot see into.
Observability features
- Every LLM call, tool run, retrieval, and agent turn becomes a span in one trace, nested parent to child, each with its own input, output, latency, and cost
- Threads group multi-turn sessions, so a bad output on turn five traces back to the context set on turn two
- Requests, errors, cost, latency, and tokens sit on one dashboard, sliced by model, key, or user
- Behaviors classify live traffic into patterns and chart them over time, with built-in classifiers for frustration, jailbreak, laziness, unsafe output, and escalation
- Monitors watch cost, errors, latency, or tokens over any window and reach Slack, email, or a webhook the moment a threshold breaks, so you hear it from Respan and not from a customer
- Online evals run the same evaluator against live production spans, filtered by status, customer, or thread and sampled to control cost, so quality regressions surface in real time rather than at the next release
- Custom attributes attach to any request and become filters across the platform, and a customer ID on a span returns spend, requests, and tokens per end user
- Click any score and land on the trace that produced it, then turn that trace into a dataset, an experiment, and a proven fix without leaving the platform
- The AI gateway underneath reaches 1,000+ models with automatic failover, retries, load balancing, and exact-repeat caching
Pricing - Free covers 100k logs, 1k evaluation scores, and unlimited seats. Team is $199 per month billed yearly for unlimited datasets, evaluators, and prompts, 10k scores, and 30-day retention, with HIPAA compliance available as an add-on and a BAA, custom retention, and a 99.99% uptime SLA on Enterprise.
2. OpenObserve
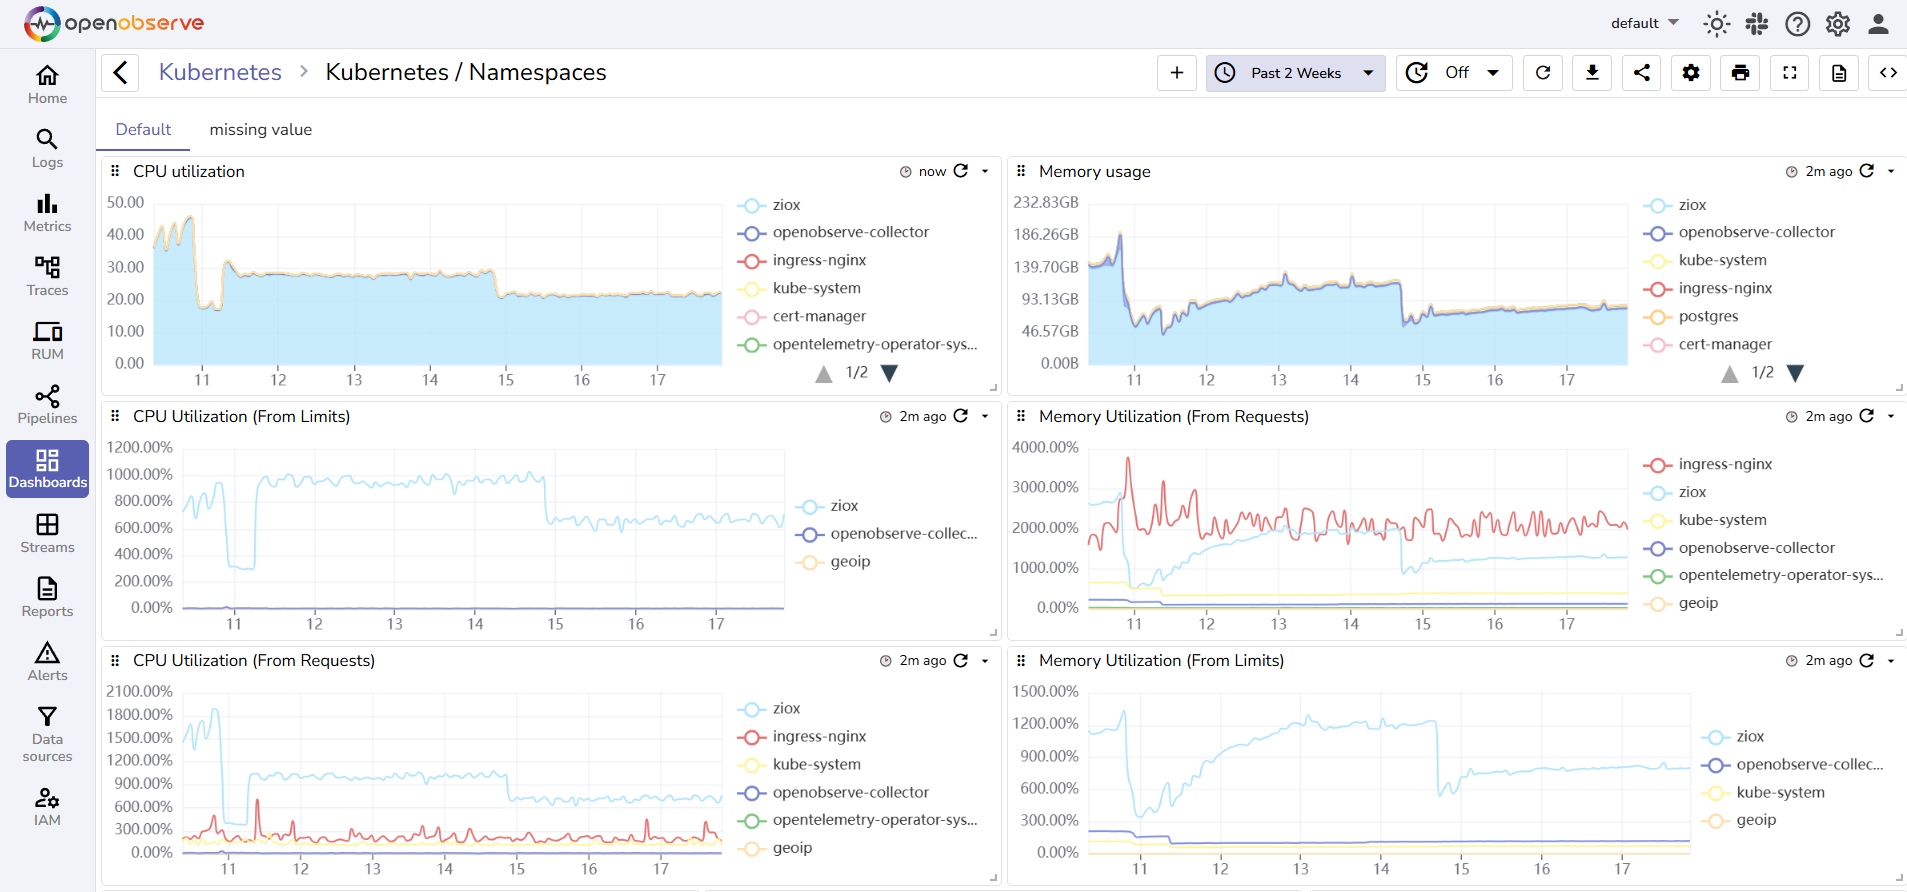
OpenObserve is a Rust-built observability platform covering logs, metrics, traces, real user monitoring, session replay, and error tracking in one interface, queried with SQL rather than a proprietary language. For a team leaving Splunk, the SQL part matters twice over: it removes the second migration cost of teaching everyone a new syntax, and it means analysts who already write SQL against a warehouse can query telemetry on day one.
Ingestion is native OTLP, so an existing OpenTelemetry Collector points at it without touching application code or swapping agents. Storage sits on S3-compatible object storage, and Bring Your Own Bucket lets the data land in your own S3 or Azure Blob account, which answers a data-residency question that most SaaS platforms cannot.
The self-hosted Enterprise edition includes SSO, RBAC, federated search, and an audit trail at no cost below the volume ceiling, which is unusual given how often those specific features are the ones gated behind an enterprise contract elsewhere.
Observability features
- Logs, metrics, traces, RUM, session replay, and error tracking in one store
- SQL querying, so no new language to learn after SPL
- Bring Your Own Bucket puts telemetry in your own S3 or Azure Blob
- Native OTLP ingest with no agent swap
Pricing - Open source is free to self-host with no limits, and Self-Hosted Enterprise is free to 50 GB per day including SSO, RBAC, and audit trail. Cloud is $0.50 per GB ingested plus $0.01 per GB queried.
3. Chronosphere
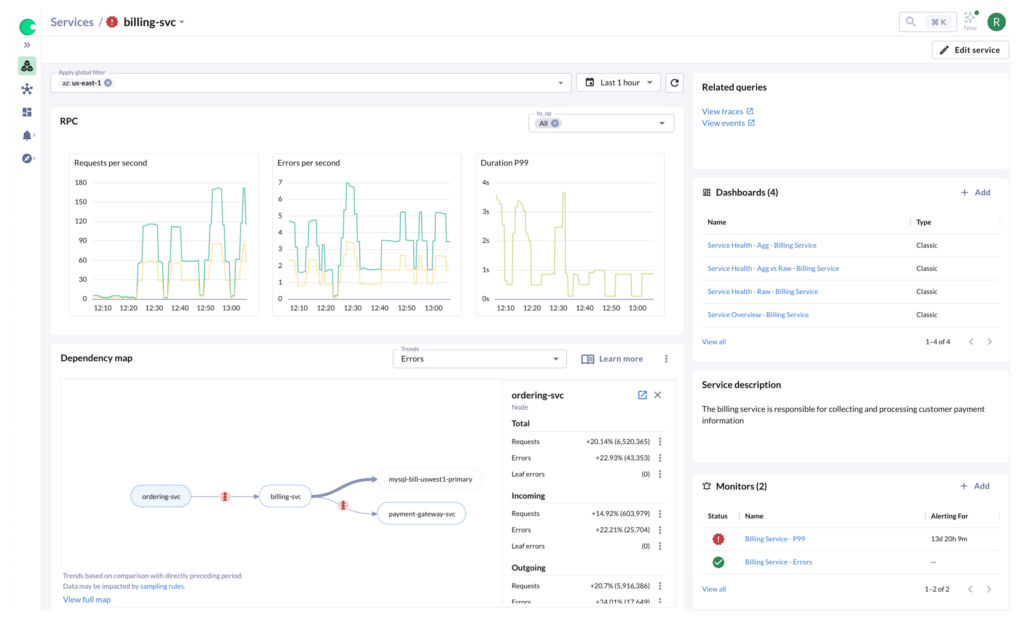
Chronosphere was built around the observation that most telemetry is never queried. Its Control Plane aggregates, drops, and samples data before it reaches storage, and billing follows the useful data you retain rather than the raw volume you emit. That is a materially different bargain from Splunk's: instead of choosing what not to send, you send everything and shape it centrally with rules that live in one place and can be audited.
The platform is Prometheus-native, which makes it a continuation rather than a migration for organizations already standardized on PromQL, and a poor fit for teams whose primary problem is unstructured log search. It is aimed at large, high-scale estates where metric cardinality is the thing that broke the budget, and it is sold accordingly.
Observability features
- Control Plane aggregates, drops, and samples data before it reaches storage
- Prometheus-native, so PromQL and existing dashboards carry over
- Usage cost profiler attributes spend to specific metrics and teams
- Explicit controls for high-cardinality series
Pricing - Quote-based, billed on the data you retain after shaping rather than raw ingest.
4. Datadog
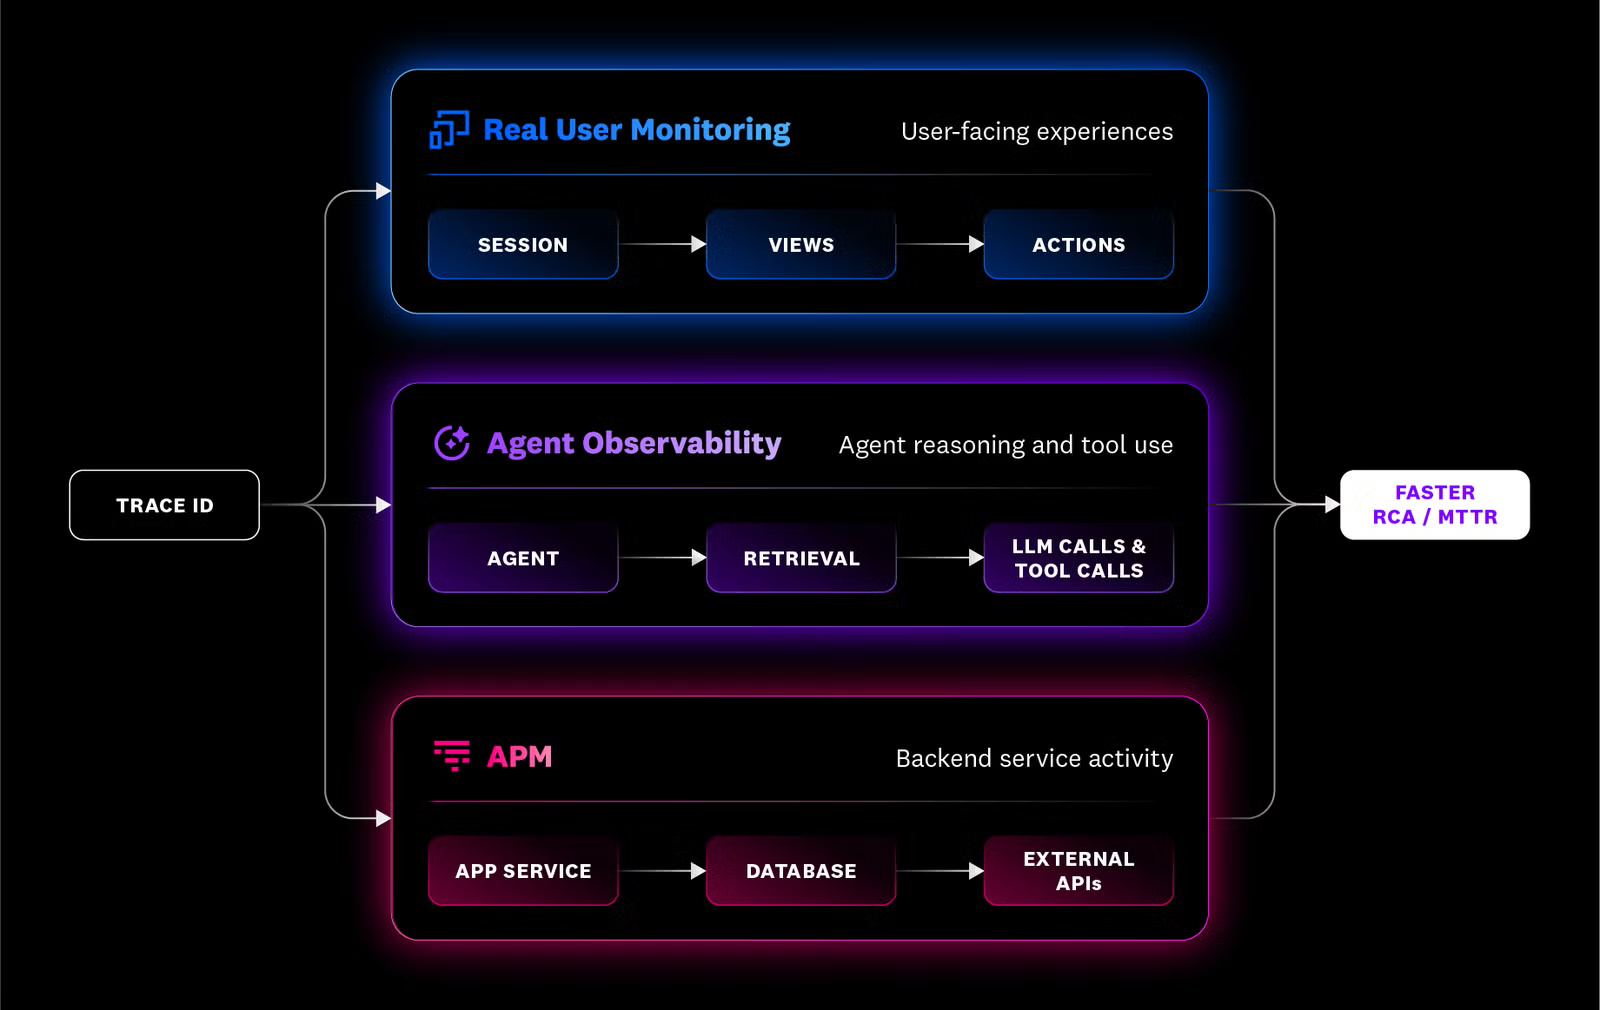
Datadog is the broadest platform on this list, spanning infrastructure monitoring, APM, log management, real user monitoring, synthetics, and security, with an integration catalog in the thousands. For teams whose Splunk deployment grew into general IT operations, it covers the most surface area with the least assembly.
The structure to understand is that each of those is a separate product with its own meter. Infrastructure bills per host, APM bills per host, logs bill on ingest plus indexed events, custom metrics bill on unique tag combinations, and LLM Observability bills on spans. A single dashboard sits over all of it, so the sprawl is not visible in the interface, only on the invoice.
Host-based billing also behaves badly on container-dense infrastructure, and Datadog bills hosts at the monthly high-water mark, so a five-day traffic spike sets the rate for all thirty days. That compounding is what any serious look at Datadog alternatives has to work through.
Observability features
- Infrastructure metrics, traces, and logs correlate in one view
- Integration catalog in the thousands, so most collection work is done
- Ingest and index are separate decisions on logs
- LLM Observability traces model calls and records token usage
Pricing - Each product is its own meter. APM is $31 per host with Infrastructure attached, logs are $0.10 per GB ingested plus $1.70 per million indexed events, and LLM Observability is $160 per month for 100,000 spans.
5. Dynatrace
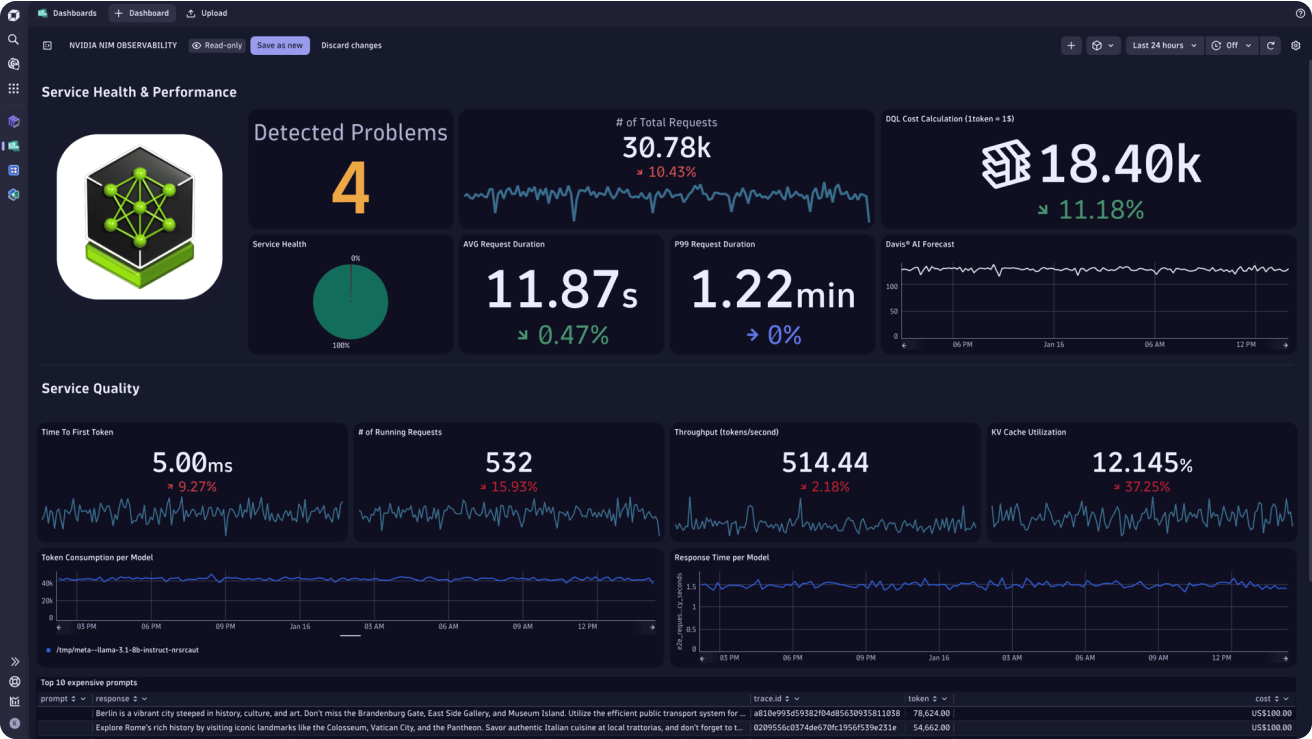
Automation is the argument Dynatrace makes. OneAgent deploys once per host and discovers services, dependencies, and topology without per-service configuration, then the Davis AI engine correlates anomalies across metrics, logs, and traces to produce a causal explanation rather than a list of things that broke at the same time. In large hybrid estates with a dedicated observability team, that reduces the configuration work that would otherwise scale with service count.
The cost is control. The agent is heavyweight, the deployment model is opinionated, and DQL is another proprietary query language, so a team migrating from SPL trades one non-transferable skill for another. Grail unifies analytics for logs and events underneath.
Billing runs on host units, with logs metered separately by volume, which means Dynatrace can combine both of the cost pressures described earlier: you pay for infrastructure footprint and for data volume on top of it. Our comparison of Dynatrace alternatives covers where that lands for container-heavy stacks.
Observability features
- OneAgent discovers services and dependencies without per-service configuration
- Davis AI correlates anomalies into a causal explanation
- Grail unifies analytics behind logs, events, and traces
- Ingests OpenTelemetry GenAI data for token usage and model latency
Pricing - Host units for the platform with log ingest metered separately by volume, so both meters apply at once. Quote-based at enterprise scale.
6. SolarWinds Observability
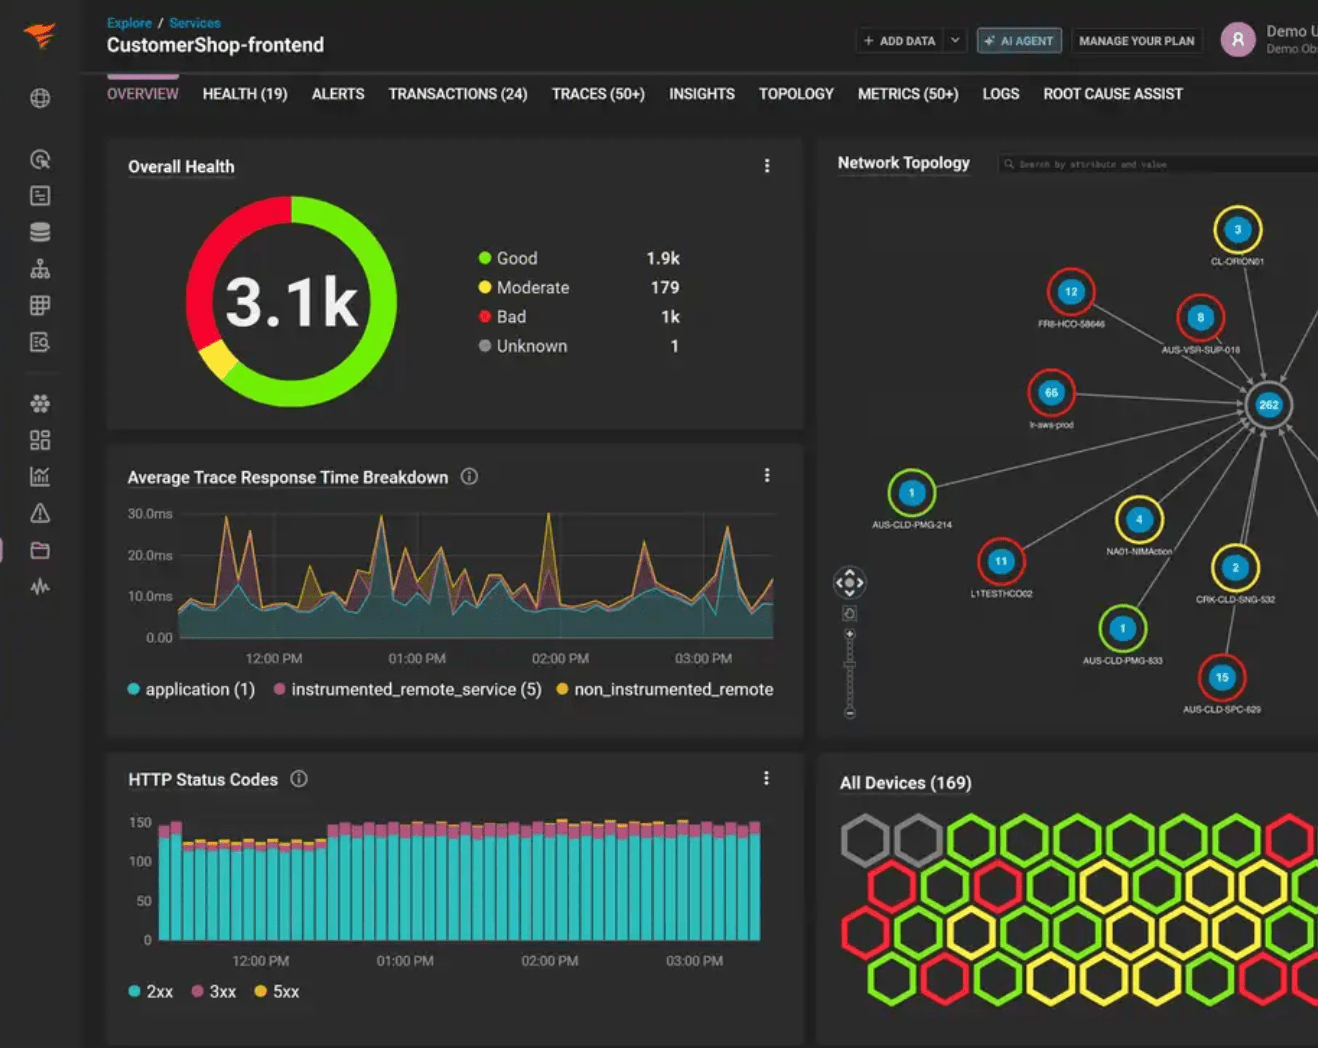
SolarWinds Observability is built for estates that are not entirely cloud-native, which describes a large share of Splunk's install base. Networks, on-premises servers, storage, and databases get first-class treatment alongside containers and microservices, and the topology view connects infrastructure to the services running on it. If the reason your logs are in Splunk is that half your environment predates Kubernetes, this covers ground that OpenTelemetry-first platforms tend to leave to you.
It comes in both SaaS and self-hosted editions, and the self-hosted version deploys behind your own firewall or into your own cloud account, with node licenses allocated across multiple instances.
Database observability is a separate product with its own meter, and the gap between the two rates is large enough that a database-heavy estate should price it explicitly rather than assuming it rolls in.
Observability features
- Device-level network and infrastructure monitoring across hybrid topologies
- Metrics, traces, logs, and user experience in one place
- OpenTelemetry, Telegraf, and Prometheus alongside native agents
- Self-hosted behind your firewall or in your own cloud account
Pricing - Starts at $8 per node per month on multi-year contracts billed annually. Database observability is a separate meter starting at $142 per database per month.
7. New Relic
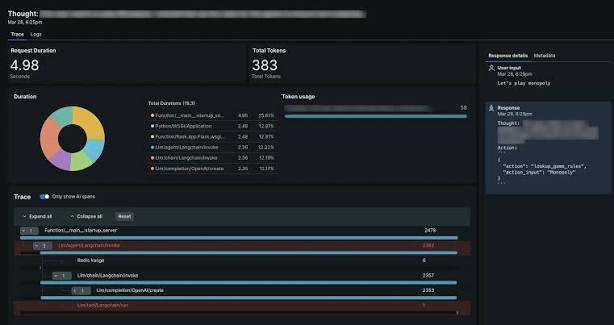
The pitch New Relic makes to Splunk teams is a single telemetry database. Logs, metrics, events, and traces all land in NRDB and are queried with NRQL, which is close enough to SQL that engineers coming off SPL pick it up faster than most alternatives on this list. Correlating an application error with the infrastructure underneath it is a query rather than a context switch.
Billing separates ingested data from users, with a free monthly ingest allowance and per-user charges above the base tier depending on whether someone is a full platform user or a basic one. That structure is friendlier than per-host pricing on dense infrastructure, and less friendly to organizations that want observability access spread widely across a large engineering org, since the seat count becomes the thing that grows. We go deeper on that tradeoff in our roundup of New Relic alternatives.
Observability features
- NRDB holds every signal, so correlation is a query rather than a context switch
- NRQL is SQL-adjacent, which shortens the retraining project after SPL
- Live Archives queries historical logs without a rehydration step
- Query-time parsing extracts fields from unstructured logs in the interface
Pricing - Usage-based on ingest with 100 GB free per month, plus per-user charges above the entry tier. No per-host fees.
8. Elastic Observability
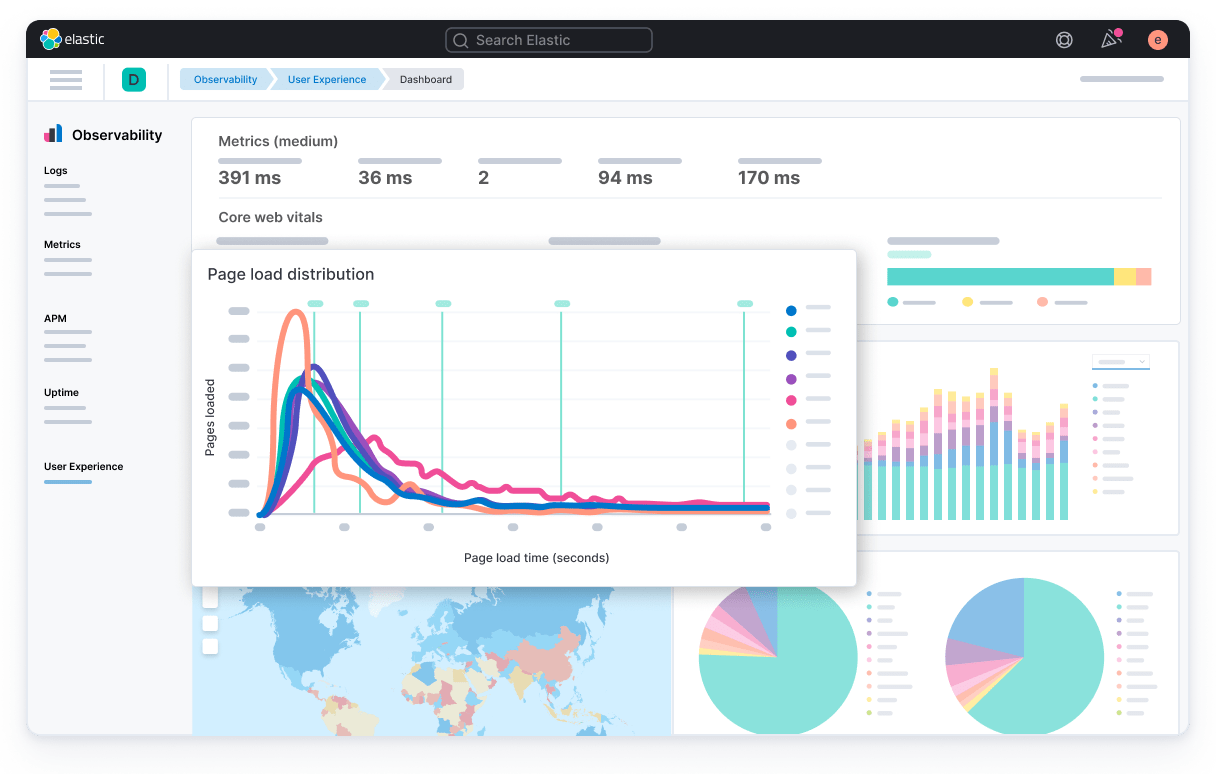
Elastic Observability is the closest thing on this list to a like-for-like replacement for what Splunk does with logs, because it is also a search engine underneath. Full-text search across large volumes of unstructured data is the core competency, and teams that miss SPL's ad-hoc exploration usually find the least capability loss here, though KQL and ES|QL are still a rewrite for every saved search you bring with you.
However, Elastic's meter is the closest to Splunk's too, which is its tradeoff. Serverless bills on both ingest and retention per gigabyte, so the same instinct to send less survives the migration intact. Ingest on Logs Essentials starts at $0.07 per GB with retention from $0.017 per GB per month, and Complete runs $0.09 per GB for logs and traces with metrics at $0.023.
Two costs are easy to miss. Synthetic monitoring, the Elastic Managed LLM, Workflows, and Agent Builder are all add-ons available only on the Complete tier, so anything AI-adjacent forces the upgrade before you price the add-on itself. And support above the Standard tier bills as a percentage of your entire consumption, at 5% for Gold, 10% for Platinum, and 15% for Enterprise, which scales with the bill rather than sitting as a fixed line item.
Observability features
- Fast full-text search across large log volumes, closest to what SPL does
- Serverless, hosted, or fully self-managed for data residency
- Machine learning anomaly detection in paid tiers
- OpenTelemetry-first intake with 350+ integrations
Pricing - Serverless bills both ingest and retention, from $0.07 per GB ingested and $0.017 per GB retained monthly. Support above Standard adds 5% to 15% of the entire bill.
9. Grafana Cloud
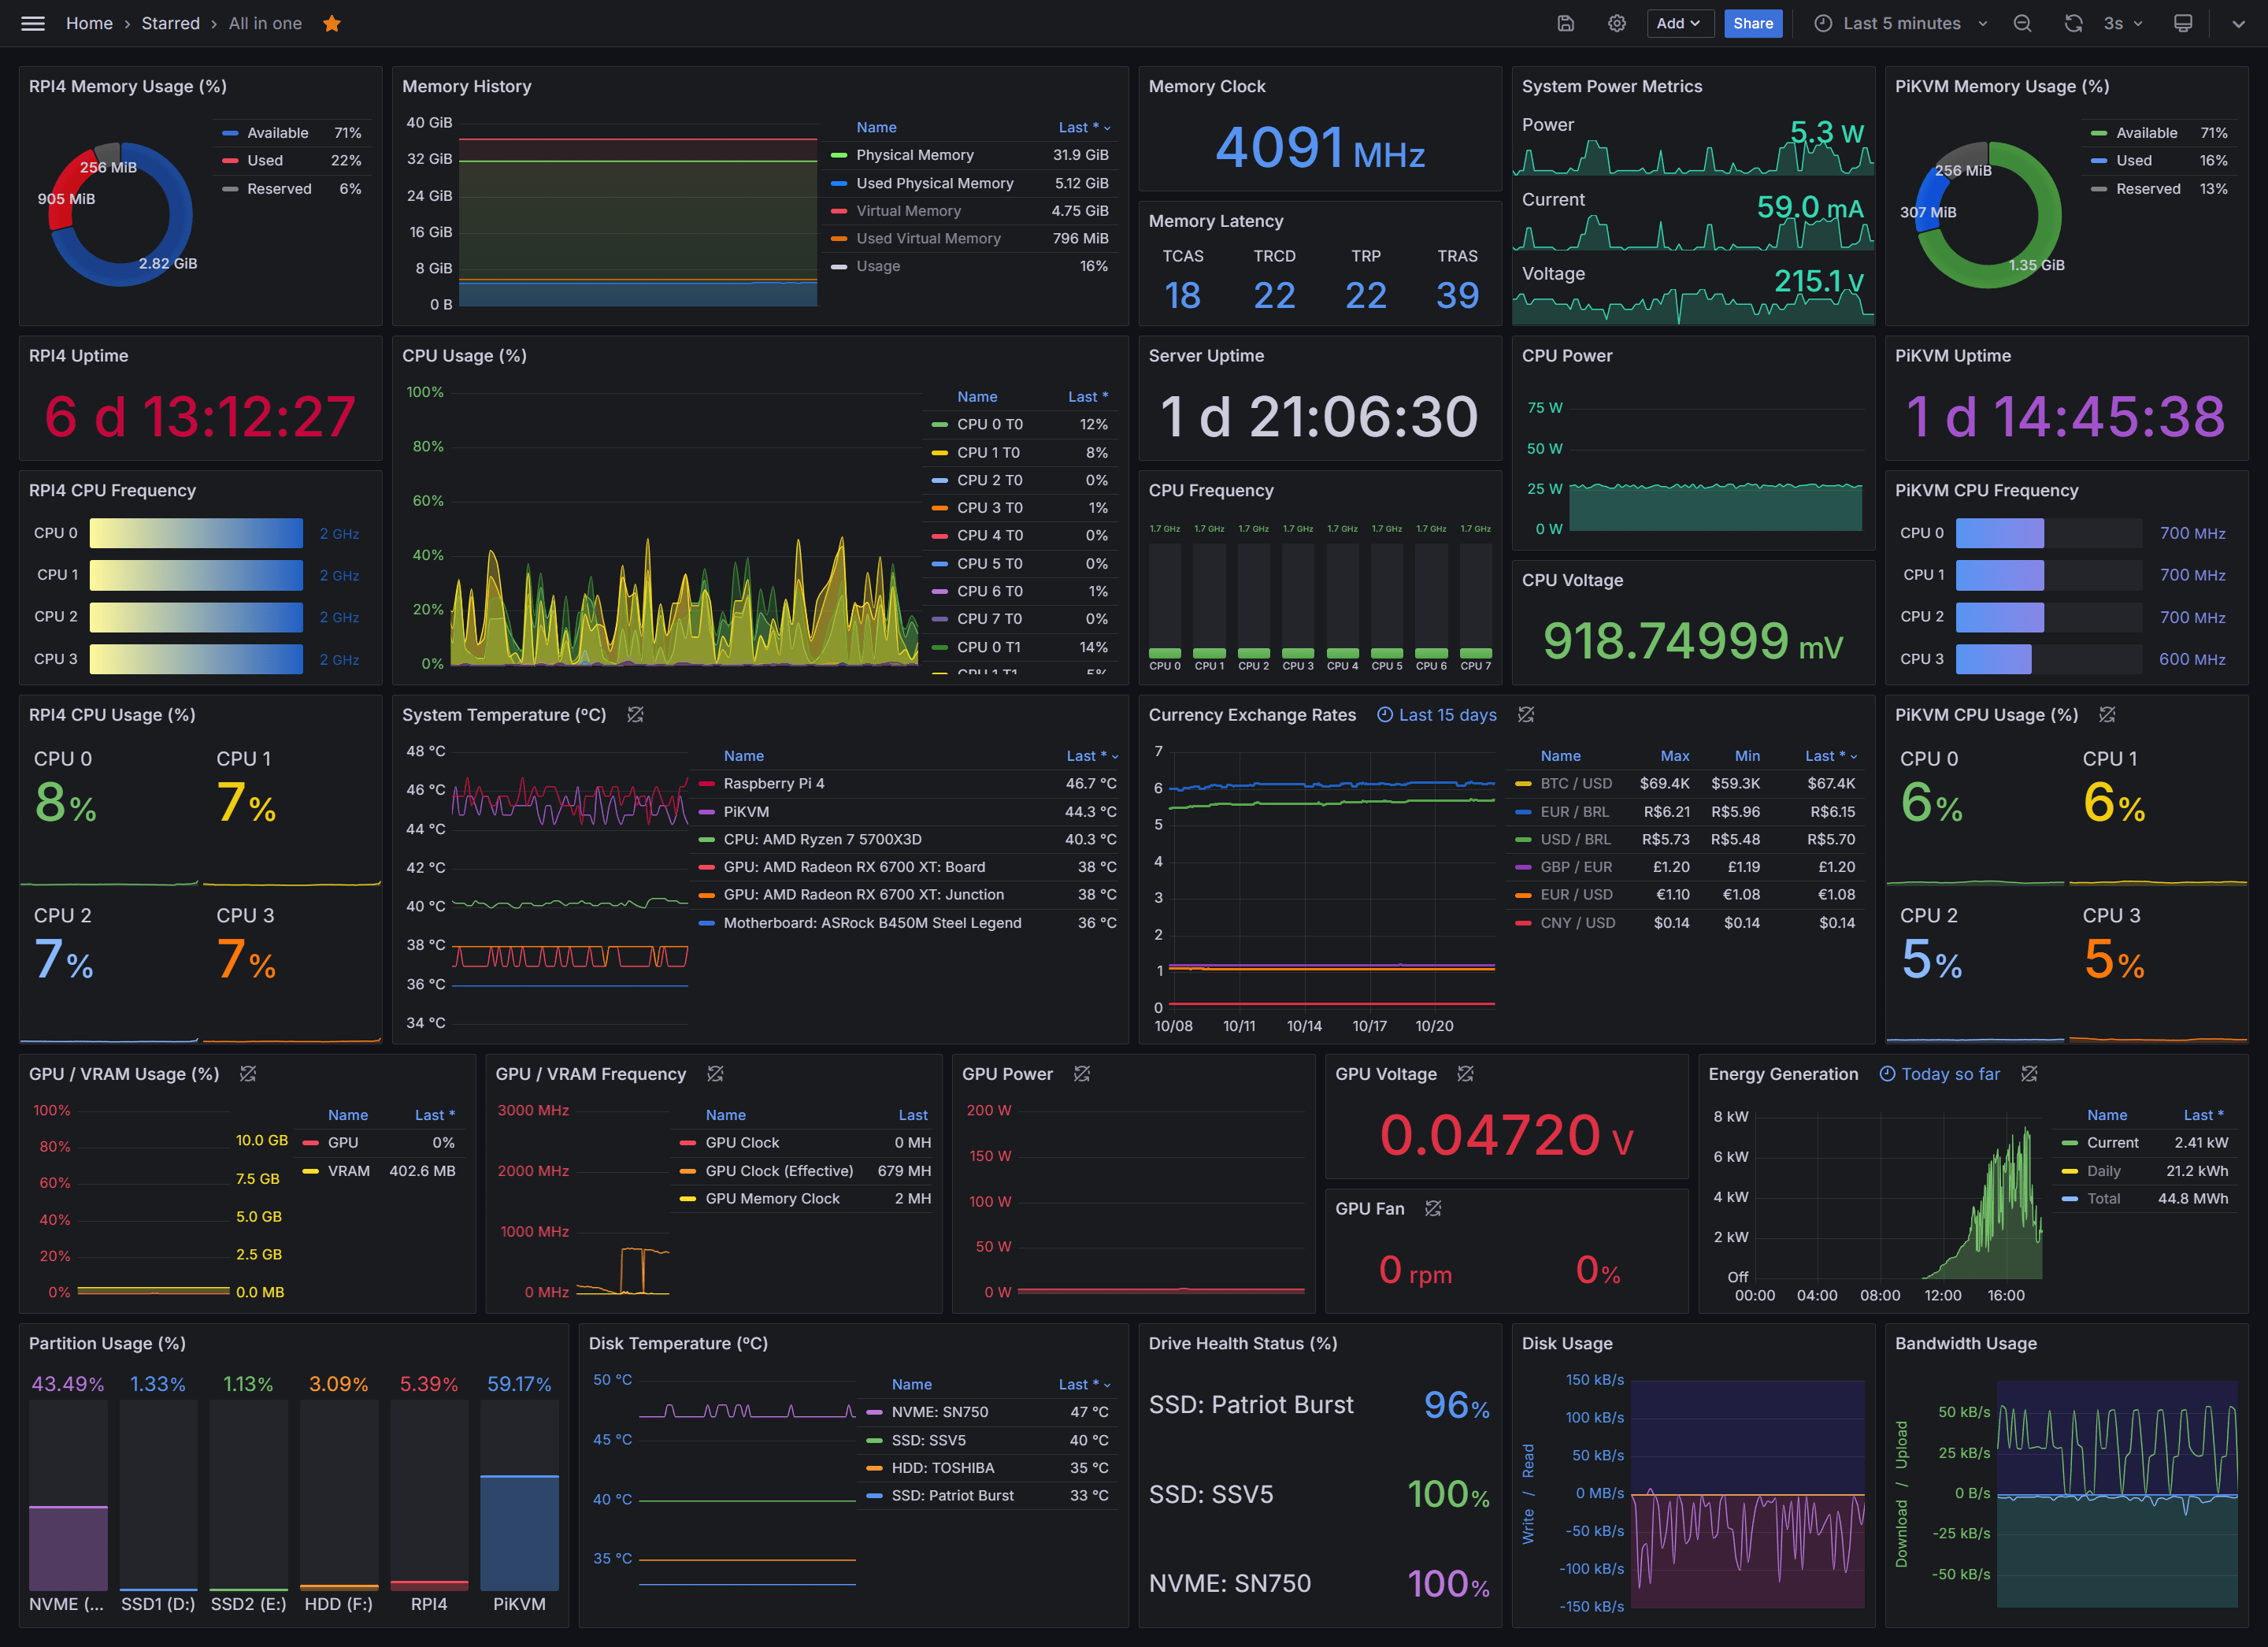
Most teams already run some of Grafana before they consider it as a Splunk replacement, usually as the dashboard layer over Prometheus. Grafana Cloud runs the full LGTM stack as a managed service, with Loki for logs, Mimir for metrics, Tempo for traces, and Grafana for visualization, which means the dashboards and alerts your team already wrote keep working.
Loki's design is the thing to understand before committing. It indexes labels rather than log contents, which makes ingestion cheap and storage cheaper, and makes full-text search across unstructured logs slower and more constrained than what SPL does. For teams whose Splunk usage is mostly known queries against labeled streams, that trade is fine. For teams doing genuine exploratory search across messy logs, it is a real capability loss and worth testing on production-shaped data before migrating.
Observability features
- Loki, Mimir, Tempo, and Grafana managed as one stack
- Existing PromQL and Grafana dashboards carry over unchanged
- Large plugin ecosystem, including a Splunk data source for parallel runs
- Every component remains free to self-host
Pricing - Usage-based, with a free tier covering 10k active series and 50 GB each of logs and traces.
10. SigNoz
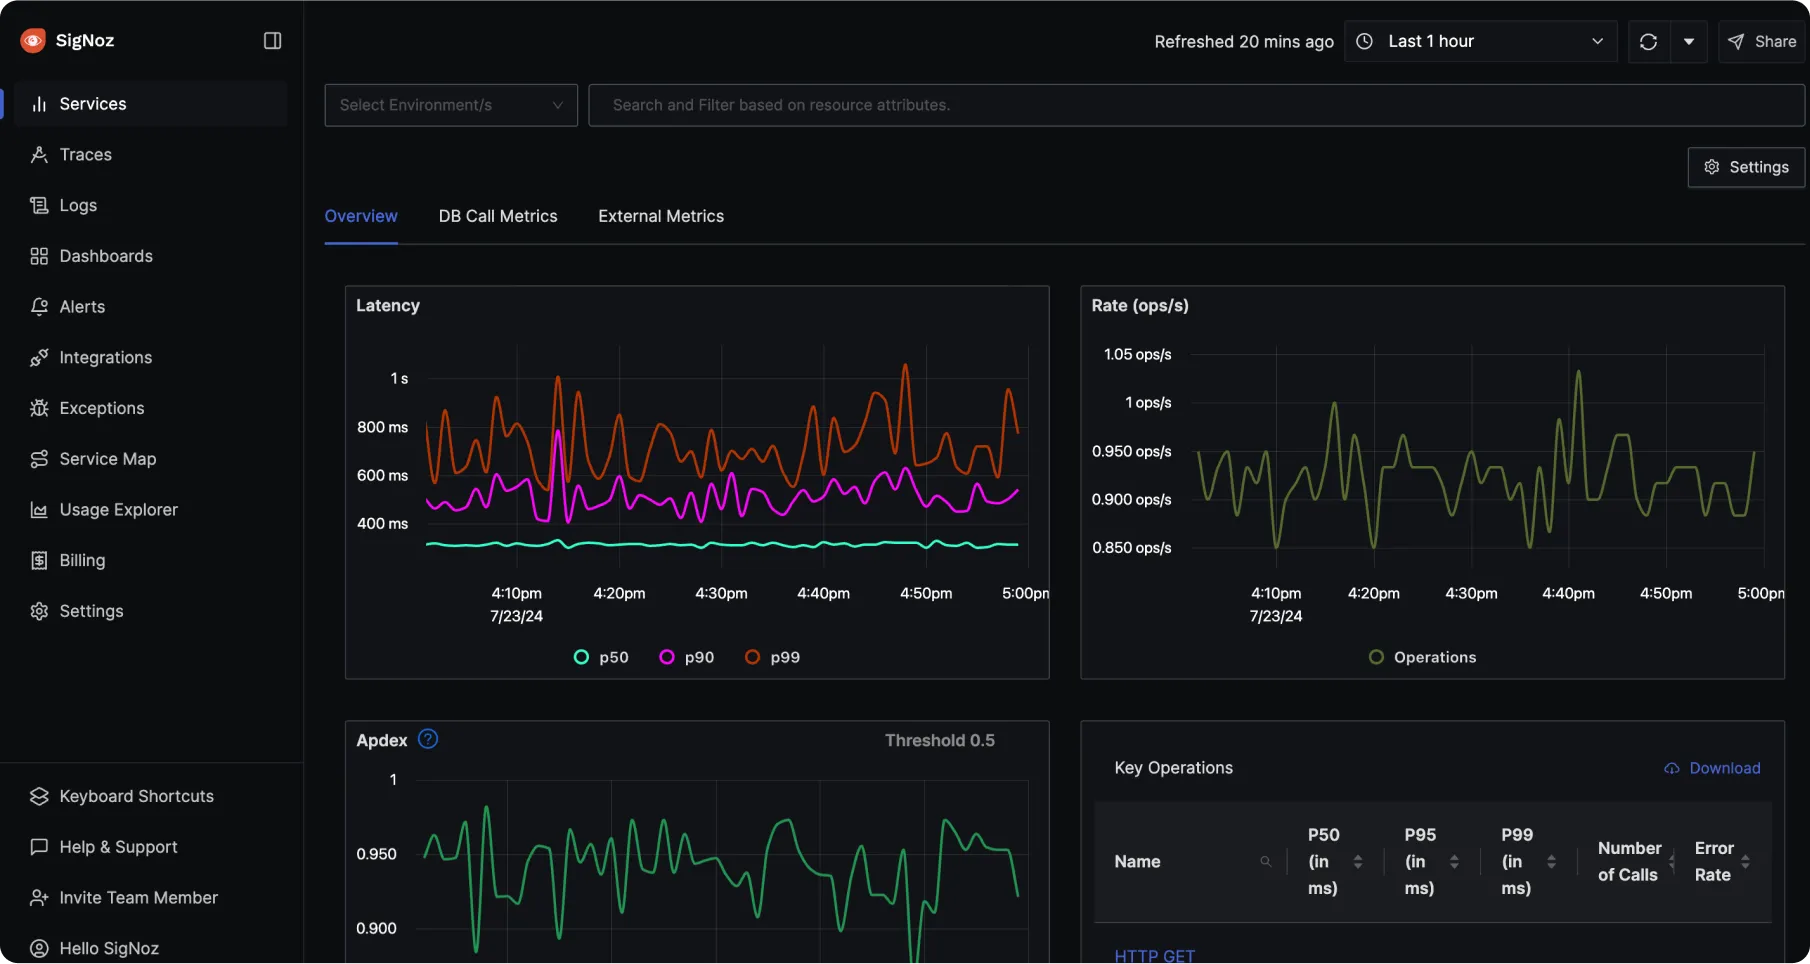
SigNoz is an open-source, OpenTelemetry-native platform built on ClickHouse, with an interface deliberately shaped like the commercial tools it competes with. Logs, metrics, and traces sit in one store, queries run in a ClickHouse-backed language, and instrumentation is standard OTel, so nothing about the integration is proprietary and moving off it later costs less than moving off a vendor agent.
The honest cost is ClickHouse. Running the Community Edition at production volume means someone on the team who understands cluster sizing, compaction, and query performance under load, and that expertise is precisely what you are paying for when you choose Cloud instead. The integration catalog is also smaller than the commercial platforms', so more of the collection work stays with you.
Observability features
- OpenTelemetry-native, so nothing about the instrumentation is proprietary
- Single ClickHouse store behind logs, metrics, and traces
- Community Edition is the complete product rather than a stripped demo
Pricing - Community Edition is free to self-host. Cloud starts at $49 per month as a usage credit covering roughly 163 GB, then $0.30 per GB for logs and traces.
11. Uptrace
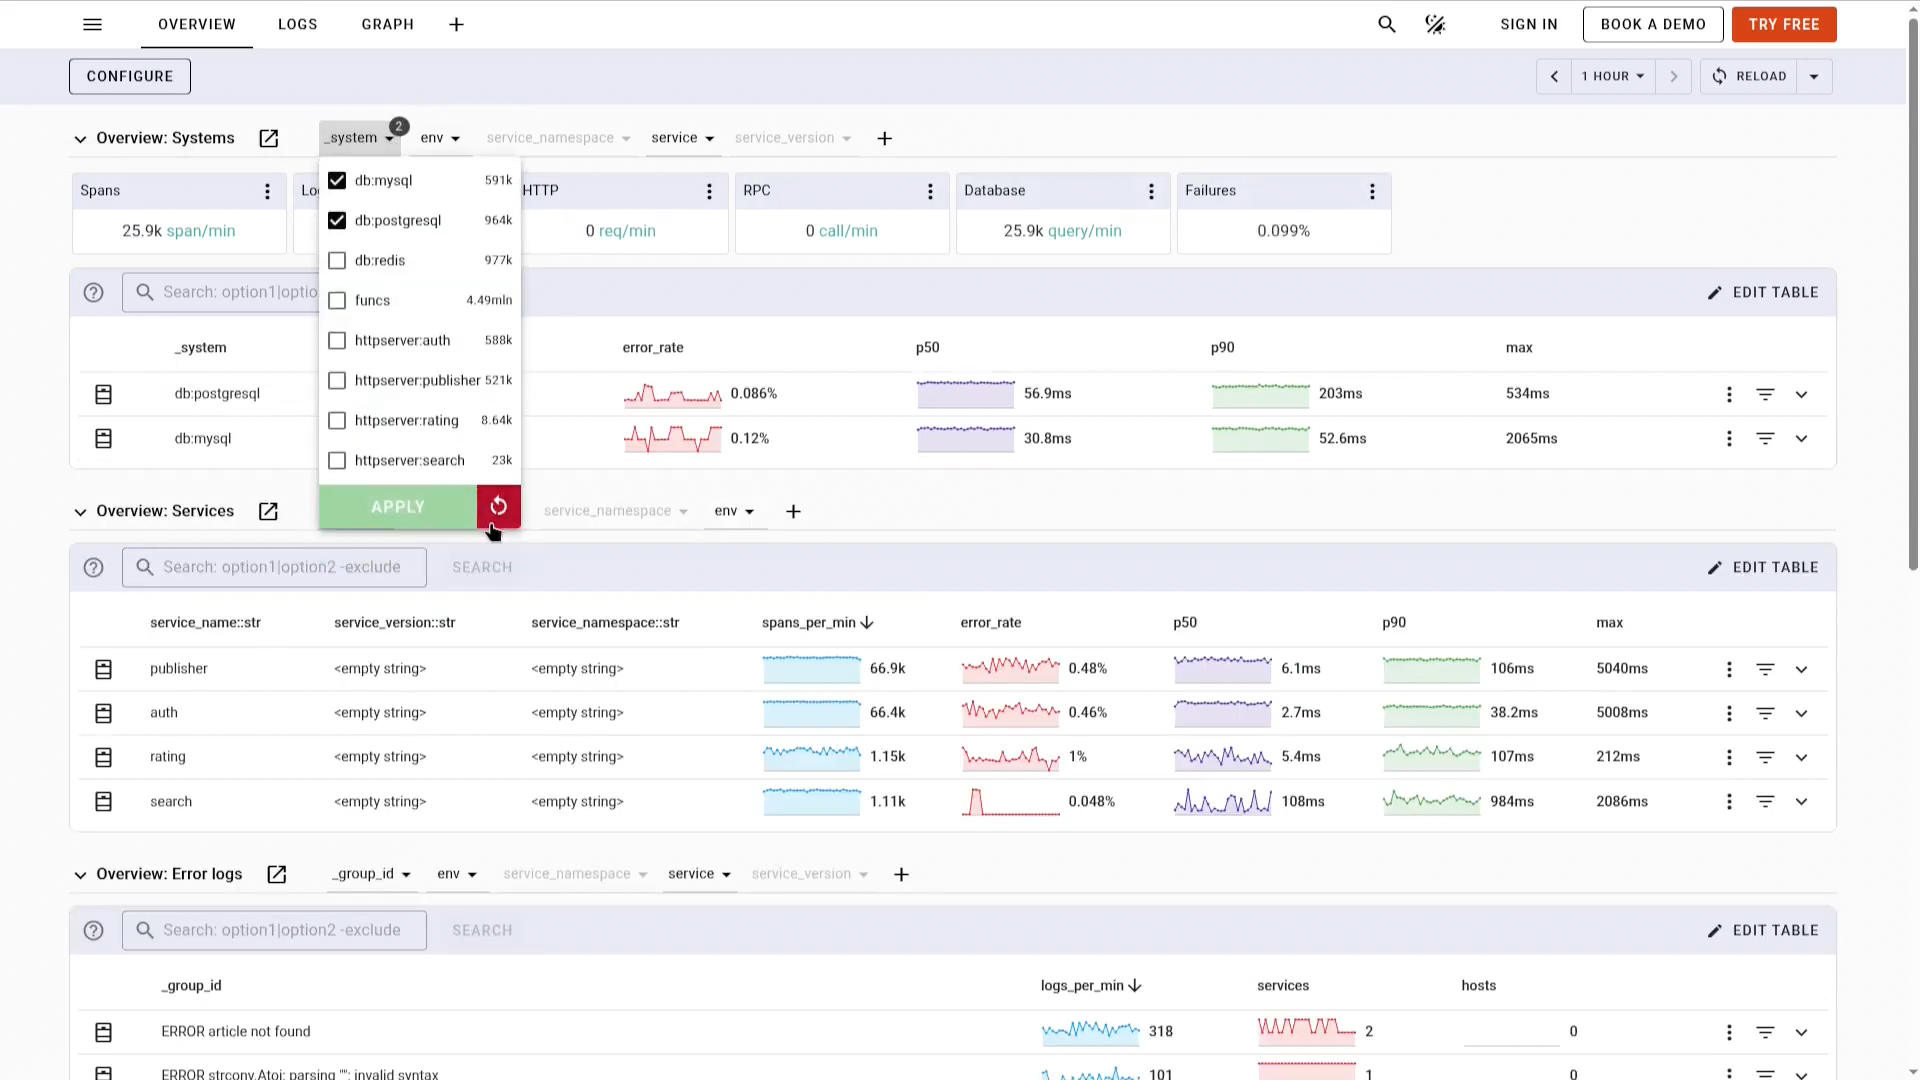
Uptrace is an OpenTelemetry-native platform on ClickHouse, lighter than most of this list and priced with unusual transparency. Traces, logs, and metrics arrive over OTLP, and the pricing page has a slider that produces the actual number rather than a form that produces a sales call.
The meter is ingested volume with no seat or host component, so headcount and infrastructure footprint are both free. Rates start at $0.10 per GB and fall to $0.016 per GB at volume, applied automatically rather than negotiated, and a hard budget cap will stop the bill at a ceiling you set. Default retention is four weeks, with cold storage beyond that at $0.01 per GB-month for spans.
One detail is worth pausing on given the argument this article is making: sampled and dropped data still bills, at $0.01 per GB. Even the platform most explicitly designed around cheap ingest charges you something for the telemetry you decided not to keep, which is a reminder that no pricing model makes the collect-or-cut decision disappear entirely.
Observability features
- Native OTLP ingest, so an existing Collector points at it unchanged
- ClickHouse keeps high-cardinality attributes queryable at volume
- Hard budget cap stops the bill at a ceiling you set
- Community Edition is free forever with no usage limits
Pricing - 50 GB free per month, then from $0.075 per GB with volume discounts applied automatically. Nothing is charged for seats, services, or hosts.
12. Honeycomb
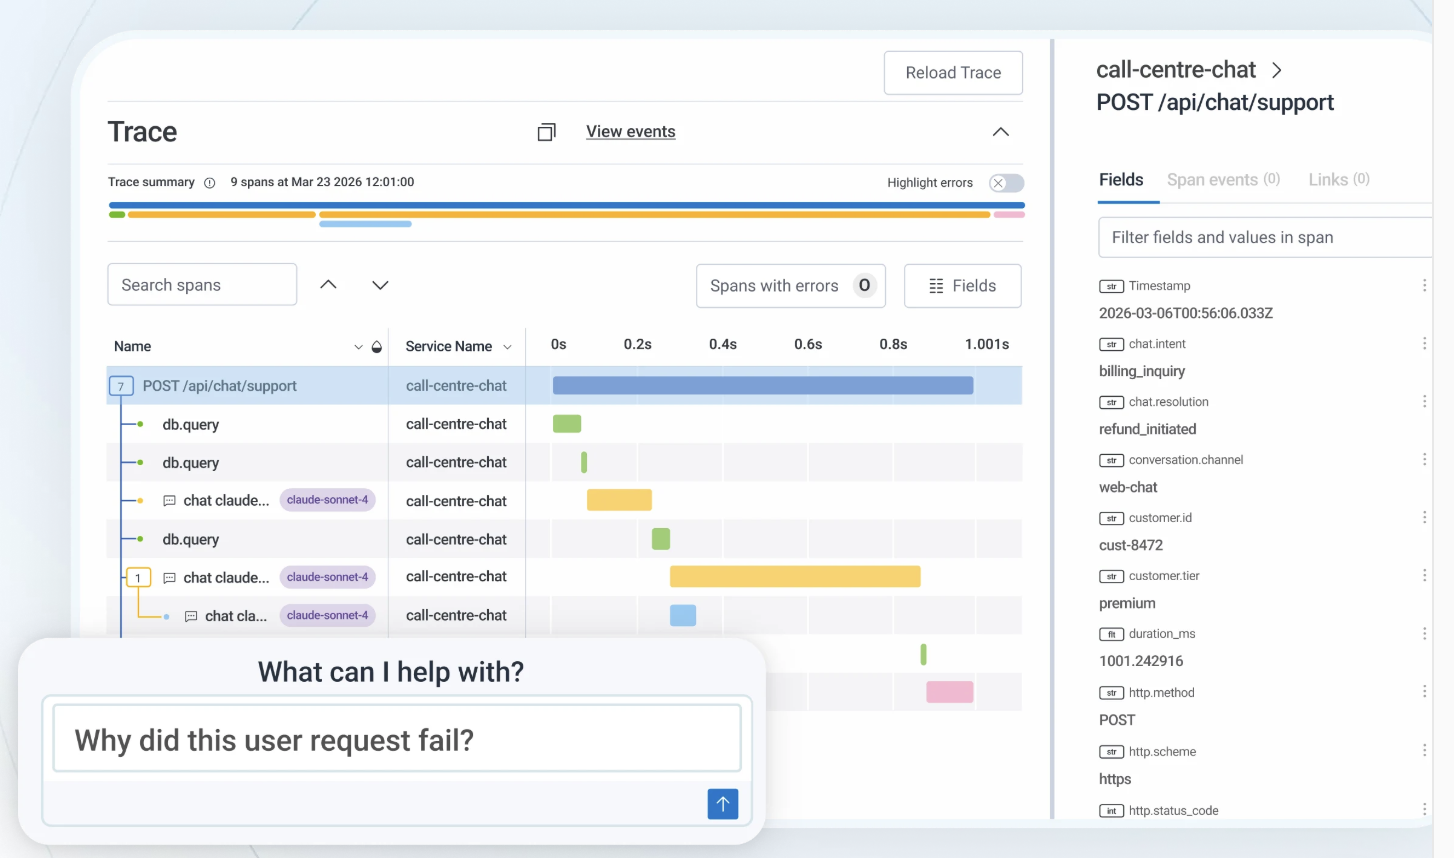
Honeycomb stores wide structured events with arbitrary attributes attached rather than splitting telemetry into three pillars. That means you can query across any dimension you thought to record, including customer ID, build ID, feature flag, or deployment, without having built a dashboard for it first.
Log support and dashboarding are lighter than the general-purpose platforms here, and there is no infrastructure monitoring, so it usually sits alongside something else rather than replacing Splunk on its own.
Billing runs on event volume, which makes it cheap to give the whole engineering org access and expensive to send high-volume, low-value telemetry. Refinery, the tail-based sampling proxy, addresses the second problem by sampling on the complete trace rather than the first span, though you deploy and operate Refinery yourself.
Observability features
- Wide structured events with arbitrary attributes, queryable without predefining dimensions
- Refinery samples on the complete trace, though you operate it yourself
- Seats and querying are unlimited at every tier
Pricing - Event-volume based, with a free tier covering 20 million events per month and paid tiers scaling by event count.
FAQ
Is Splunk free?
There are two free options and they are not the same thing. Splunk Enterprise offers a perpetual Free license that indexes 500 MB per day, for standalone single-instance installations only. It is genuinely restricted: there are no users or roles and no login at all, alerting is unavailable, and ingest actions are unavailable. Exceed the daily cap three times in a rolling 30-day window and Splunk keeps indexing but disables search until you fall back below the threshold. You can bulk load above the cap twice in any 30-day period, which makes it usable for one-off forensic analysis of a large dataset.
Separately, Splunk Observability Cloud has a free edition covering up to 15 hosts.
If you are evaluating free tiers for production AI workloads rather than a home lab, Respan's free tier covers 100k logs, 1k evaluation scores, and unlimited seats, which is enough to instrument a live agent and start scoring its output. Grafana Cloud, New Relic, Uptrace, and Honeycomb all offer free tiers as well, and OpenObserve and SigNoz are free to self-host without limits.
What is Splunk logging?
Splunk logging refers to collecting log data from across an environment into Splunk, where it is indexed and made searchable through SPL. Forwarders installed on hosts ship log files, syslog streams, and application output to indexers, which parse the data, extract fields, and write it to an index. From there you search it, build dashboards on it, and set alerts against it.
The characteristic Splunk behavior is schema-on-read. You do not have to define a structure before ingesting, which is why Splunk handles heterogeneous and legacy log formats well and why it became the default in environments full of systems that emit whatever they emit. The cost of that flexibility is the index itself, which is what the ingest pricing model charges for.
What is Splunk SIEM?
Splunk Enterprise Security is Splunk's SIEM, built on top of the Splunk platform rather than as a separate product. It applies security content to the same indexed data the platform already holds: correlation searches that generate notable events, threat intelligence enrichment, risk-based alerting, and investigation workflows for analysts. It comes in Essentials and Premier editions, with Premier adding SOAR for automated response, UEBA for behavioral anomaly detection, and automated threat analysis.
The relevant point for anyone evaluating observability alternatives is that Enterprise Security is licensed separately and priced separately from Splunk Observability Cloud. Replacing Splunk on the observability side does not touch the SIEM, and the platforms on this list are observability tools rather than SIEM replacements.
How can I reduce Splunk costs?
The lever depends on which meter you are on, which is why the pricing model is worth confirming before optimizing anything.
On ingest pricing, the bill tracks indexed volume, so the levers are filtering low-value data before it reaches the indexer, routing archival data to cheaper storage and querying it in place with Federated Search, and tightening retention on indexes that exist for compliance rather than investigation. Splunk's own Ingest and Edge Processors are built for exactly this. On workload pricing, ingest is no longer the constraint and search compute is, so the levers move to scheduled search hygiene: consolidating overlapping saved searches, widening cron intervals on reports nobody reads, and building summary indexes so expensive queries run once instead of per dashboard load. Activity-based pricing meters both, so both sets apply.
The thing to watch is the second-order cost. Every gigabyte you filter out is a gigabyte unavailable during the next incident, and teams routinely discover the gap at the worst possible moment. If a meaningful share of your spend is telemetry from AI features, a platform metered on model traffic rather than infrastructure volume removes that trade for the part of the stack where it bites hardest, since you can keep full-fidelity traces of every agent run without it moving your infrastructure bill at all.
When did Cisco acquire Splunk?
Cisco announced the acquisition in September 2023 and completed it on March 18, 2024, paying $157 per share in cash for roughly $28 billion in equity value. Splunk stopped trading on Nasdaq at close.