
An agent tells a customer their refund was approved. It was not. The run completed, every request returned 200, and the guardrail passed because nothing in the answer was toxic or personally identifying.
A governance platform can tell you which model version served that response, who approved it, and that it cleared every policy you wrote. It cannot tell you that step seven retrieved a stale document and the model believed it.
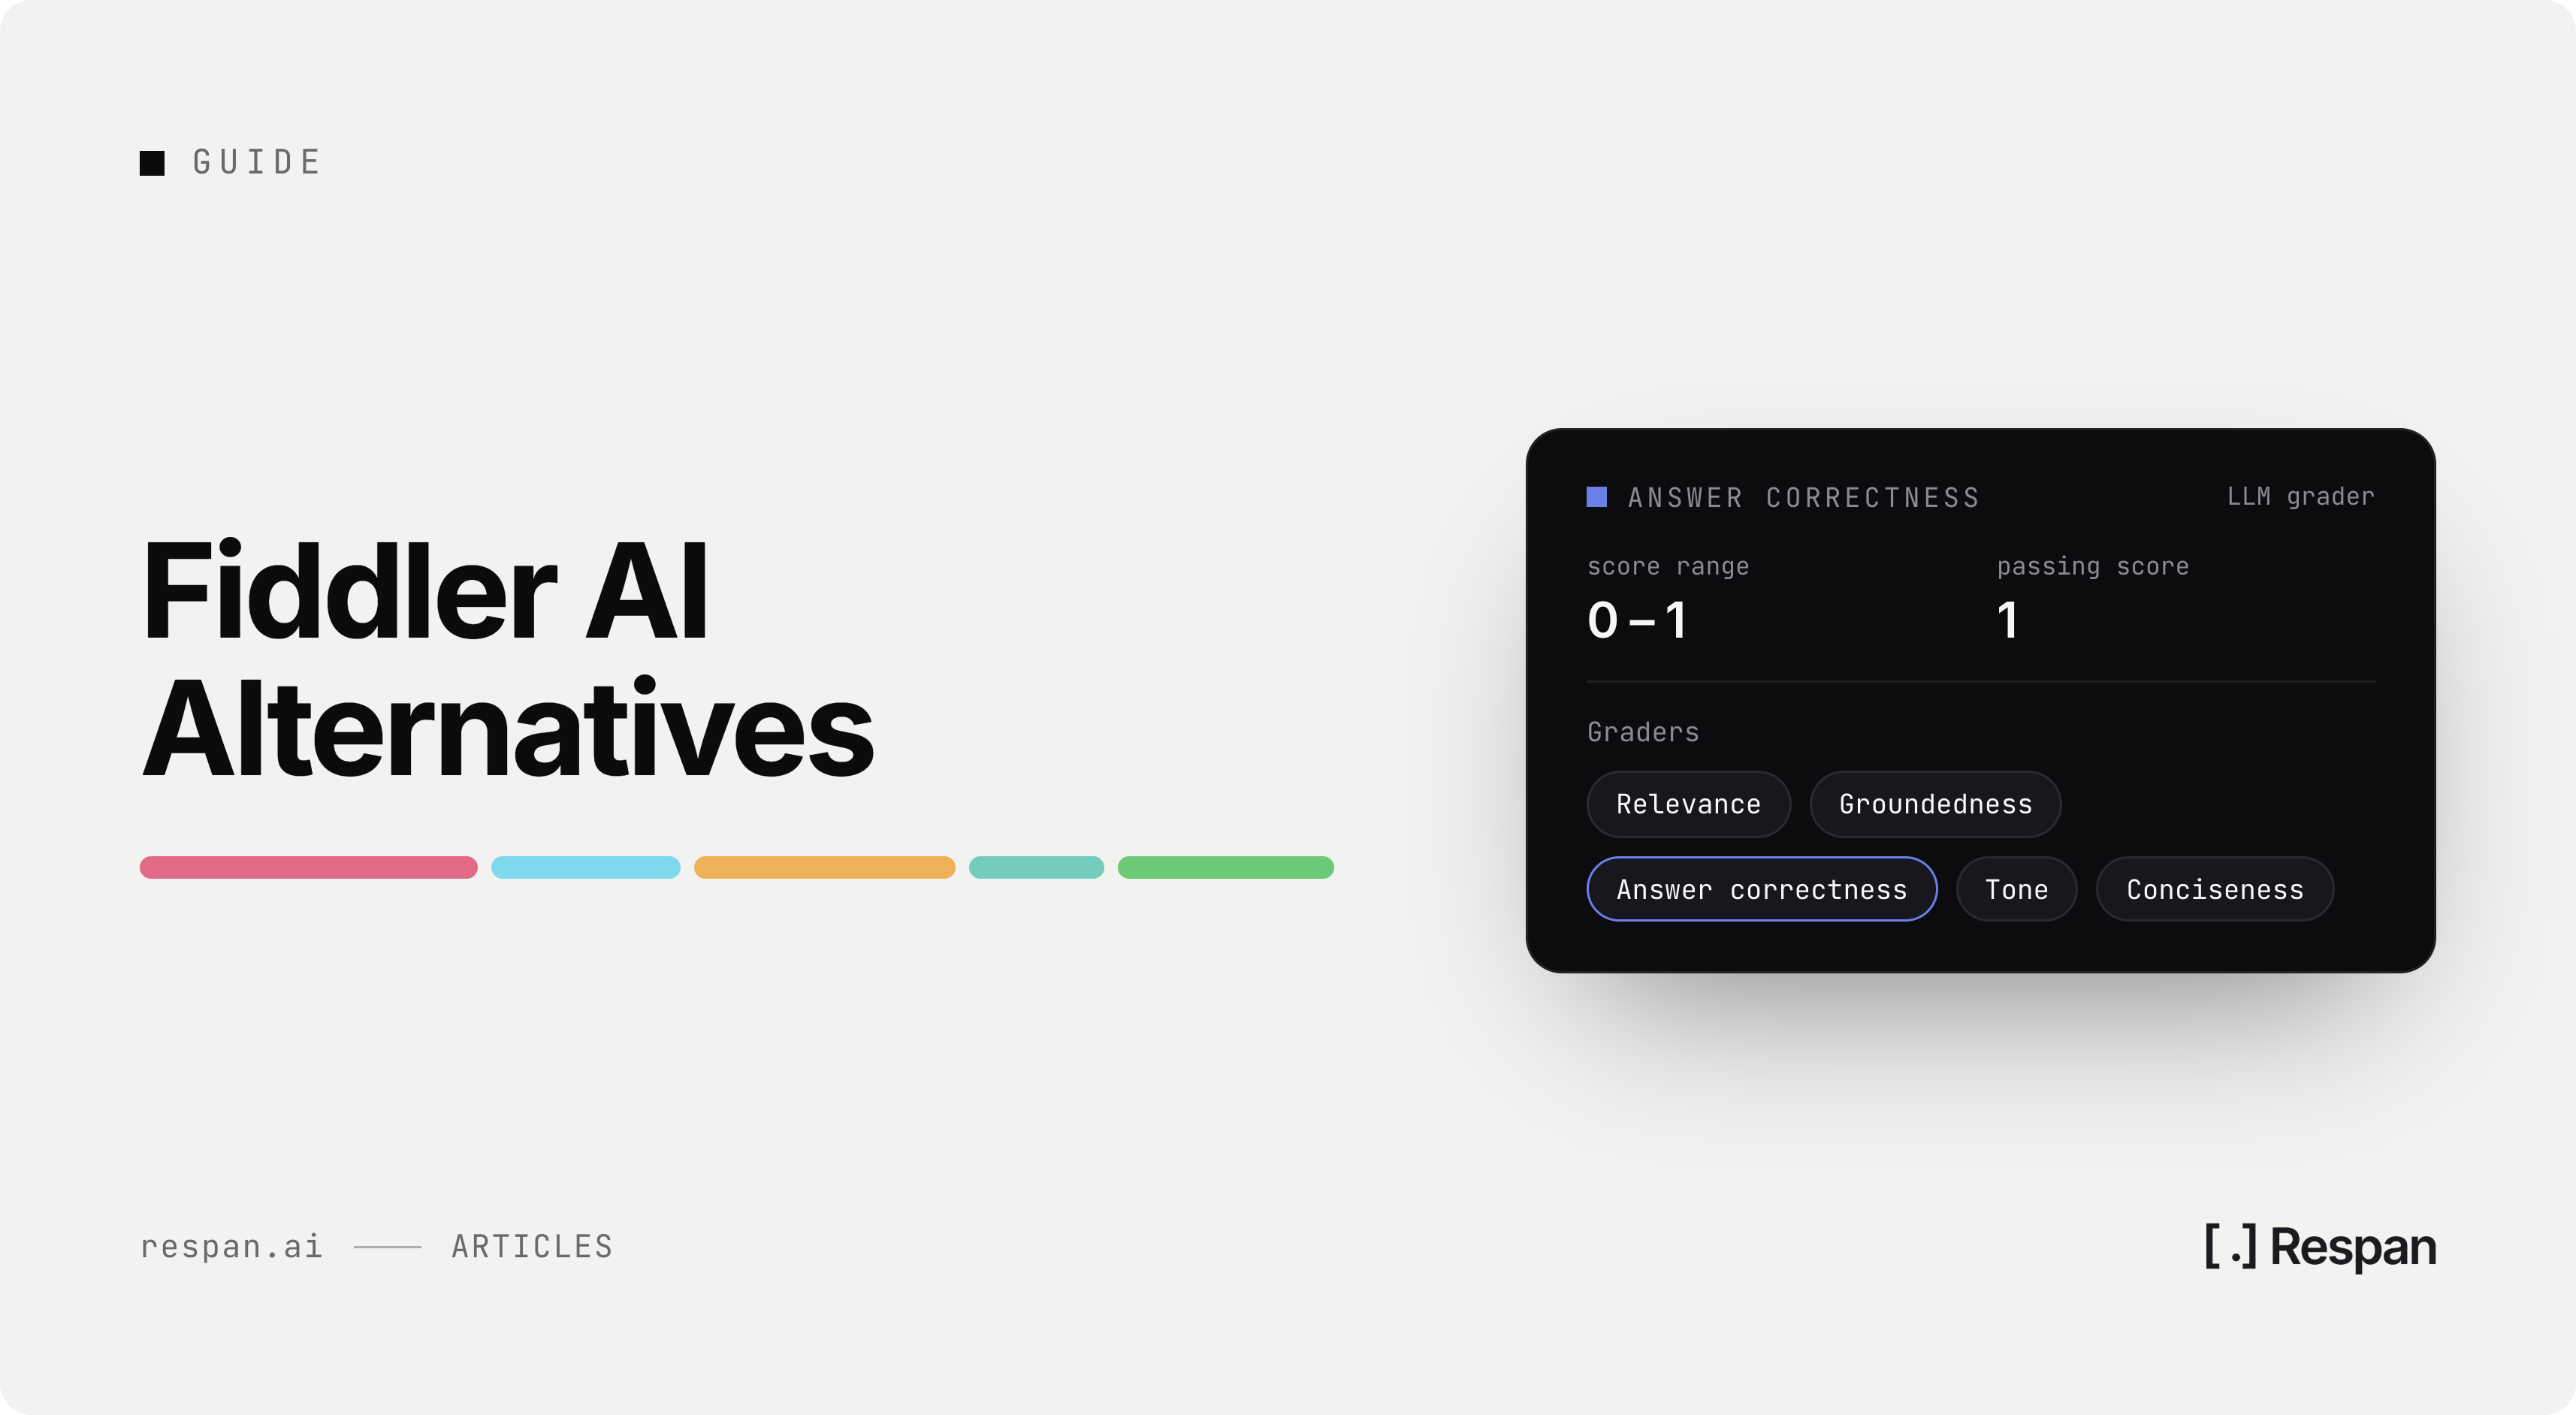
Fiddler AI is built for the first answer and not the second. The product line is AI observability and security, governance and risk and compliance, and guardrails that stop a response before a user sees it. The customer list runs to banks, insurers, health systems, and government. For a model risk function that has to defend a decision to an auditor, that is a coherent purchase.
This guide covers what Fiddler AI does, what it costs at each tier, and eight Fiddler AI alternatives built for the engineers who have to find the step that broke.
What Is Fiddler AI?
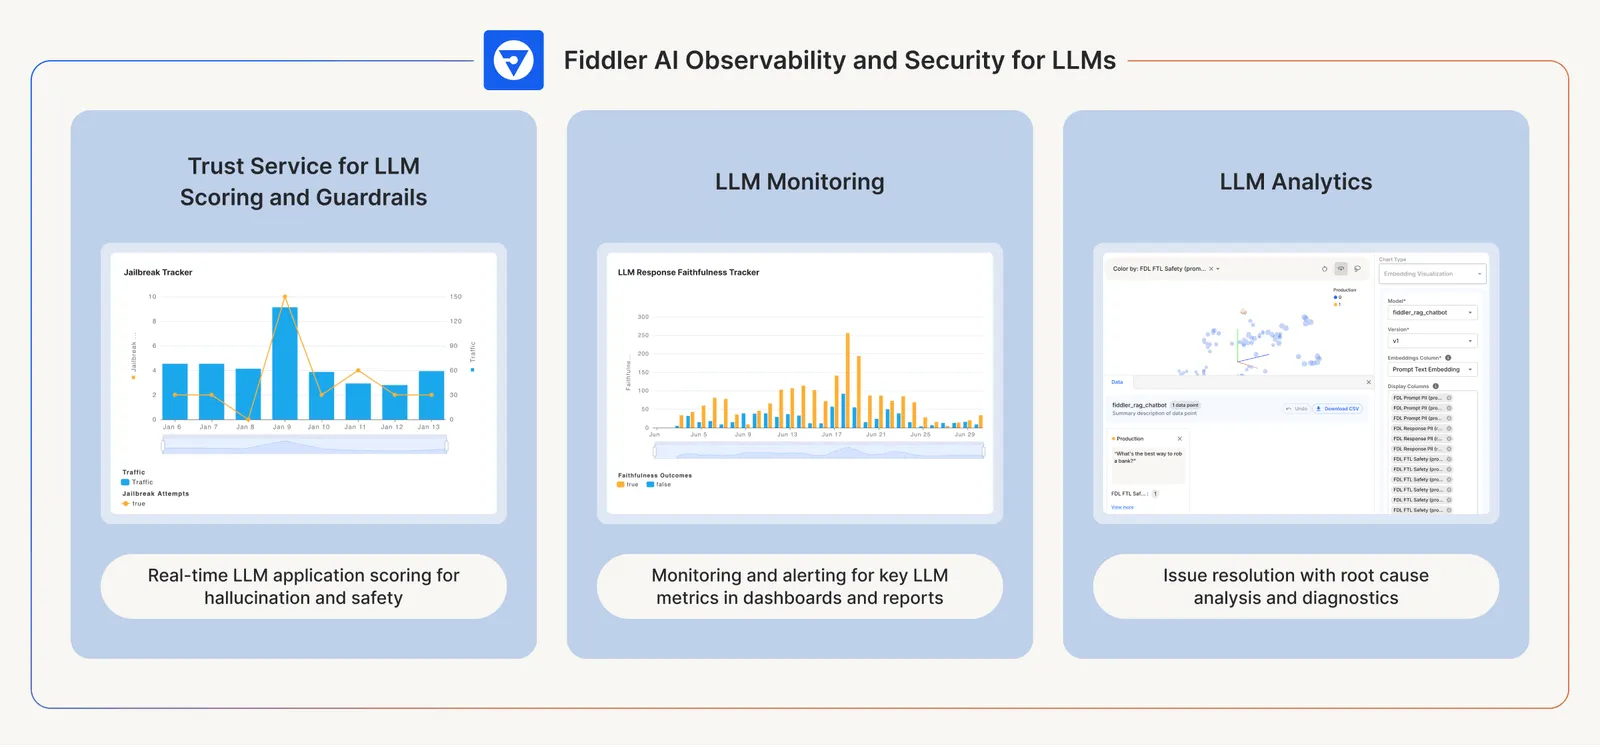
Fiddler AI is an enterprise platform for monitoring, securing, and governing AI systems in production. It started in classical ML monitoring, applying Shapley values and proprietary attribution methods to explain why a model produced a given output. That product still ships. The platform now leads with an AI Control Plane for agents.
For agents, Fiddler records decision lineage, attaching the execution context behind each step so a bad outcome resolves to the decision that produced it. Continuous evaluations score outputs in the same environment from pre-deployment testing through production. Guardrails reject hallucinations, toxicity, PII and PHI exposure, prompt injection, and jailbreaks before a response reaches a user, at under 80ms.
Fiddler AI doesn't offer an LLM gateway. Instead, it reads telemetry from traffic that something else routes, which leaves failover, caching, and per-key spend limits with whatever sits in the request path. Guardrails reject hallucinations, toxicity, PII and PHI exposure, prompt injection, and jailbreaks before a response reaches a user.
Fiddler AI Pricing
Fiddler publishes three tiers:
- Free - Real-time guardrails covering hallucination, toxicity, PII and PHI exposure, prompt injection, and jailbreak attempts. No observability.
- Developer - $0.002 per trace. Unified observability across agentic and predictive systems, tests and experiments, custom evaluators and bring-your-own-judge, role-based access control, and SSO. SaaS deployment only.
- Enterprise - Custom pricing. Enterprise-grade guardrails and scalability, deployment across SaaS, VPC, or on-premise, white-glove support, and a named customer success manager.
Three consequences follow from that structure. The free tier buys enforcement rather than visibility, so the first trace a team wants to inspect moves them onto per-trace billing. Metering by trace ties the bill to how many steps an agent takes rather than how many users it serves, which means refactoring a chain into finer-grained steps raises cost without adding traffic. And the deployment model most regulated buyers need sits on the tier with no published price, so the self-serve path and the compliant path are different purchases.
Pros and Cons of Fiddler AI
Both the strengths and the limits follow from who the platform was built for.
Pros
- Explainability depth. Local and global attribution for model behavior, which matters when a decision has to be defended rather than merely described.
- Inline guardrails at no cost. Policy enforcement runs before a response reaches a user, on the free tier.
- Compliance built in. Governance and risk reporting is part of the platform rather than assembled from exports.
- Deployment flexibility at Enterprise. SaaS, VPC, and on-premise are all supported.
- One platform for classical ML and LLM workloads, which matters for organizations still running both.
Cons
- Built around the governance function. The workflow assumes someone accountable for AI risk, who is often not the person debugging a failed run at 2am.
- Decision lineage answers why a model decided something. That is a different question from which step returned bad data, and the second one is what an engineer opens the tool to answer.
- No self-serve path. Every tier, including Free, routes through a demo request, so evaluating the product starts with a sales conversation rather than an API key.
None of that makes Fiddler a weak platform. It makes it a platform aimed at a particular user, and the eight below are aimed at a different one.
What to Look for in Fiddler AI Alternatives
The criteria that decide whether Fiddler fits are the same ones that separate its alternatives. Most of them eliminate options outright, which is faster than comparing feature lists.
-
Whether the gateway lives on the same platform - Running more than one provider means the record of which model served a request and the record of how that request performed either sit together or get correlated by hand during an incident. Buying them separately is a decision about how incidents feel, not a line item. The gateway landscape varies widely on routing, fallback, and caching.
-
How the billable unit is defined - Across these eight, the meter is variously a trace, a span, an observation, a log, a score, a seat, or a gigabyte, and no two vendors define theirs the same way. A platform that looks cheap per unit can be expensive at your shape of traffic. Model the cost at the volume you expect rather than the volume you have.
-
Whether evaluation runs on live production traffic - An LLM call can return HTTP 200 in 400ms and still hallucinate a refund policy. Scoring offline datasets assembled by hand catches a different class of problem than scoring what users actually received. This is the practical line between observability and monitoring for AI systems.
-
Who can read the output - If answering "was that response correct" requires an engineer to write a script, engineering becomes the queue for every quality question in the company.
-
OpenTelemetry support - The GenAI semantic conventions mean instrumentation written once can export to more than one backend. Proprietary SDKs carry the highest switching cost and OTel-native instrumentation the lowest.
For most teams, there are two primary things to focus on: The billable unit, which determines what a platform costs at the volume you will actually reach, and OpenTelemetry support, which determines what it costs to change your mind later.
The 8 Best Fiddler AI Alternatives
The list runs from closest replacement for what Fiddler does to furthest, so teams migrating a governance workload find their options first and teams starting fresh can read past them.
| Tool | Price | Gateway | Best for |
|---|---|---|---|
| Respan | Free tier, Team $199/mo | Yes | Tracing, evals, prompts, and routing on one platform |
| Arize | Phoenix free, AX from $50/mo | No | Classical ML and LLM workloads under one vendor |
| Galileo | Free tier, Pro from $100/mo | No | Packaged evaluators and inline guardrails |
| Langfuse | Free tier, from $29/mo | No | Self-hosted tracing with full data ownership |
| LangSmith | Free tier, from $39/seat/mo | No | LangChain and LangGraph stacks |
| Braintrust | Free tier, Pro $249/mo | No | Offline eval pipelines and CI/CD quality gates |
| Portkey | Free tier, Production $49/mo | Yes | Routing and spend control before trace depth |
| Datadog LLM Observability | Free tier, from $160/mo | No | Teams already standardized on Datadog |
1. Respan
- Type: LLM engineering platform with a built-in AI gateway
- Price: Free tier, Team $199/month
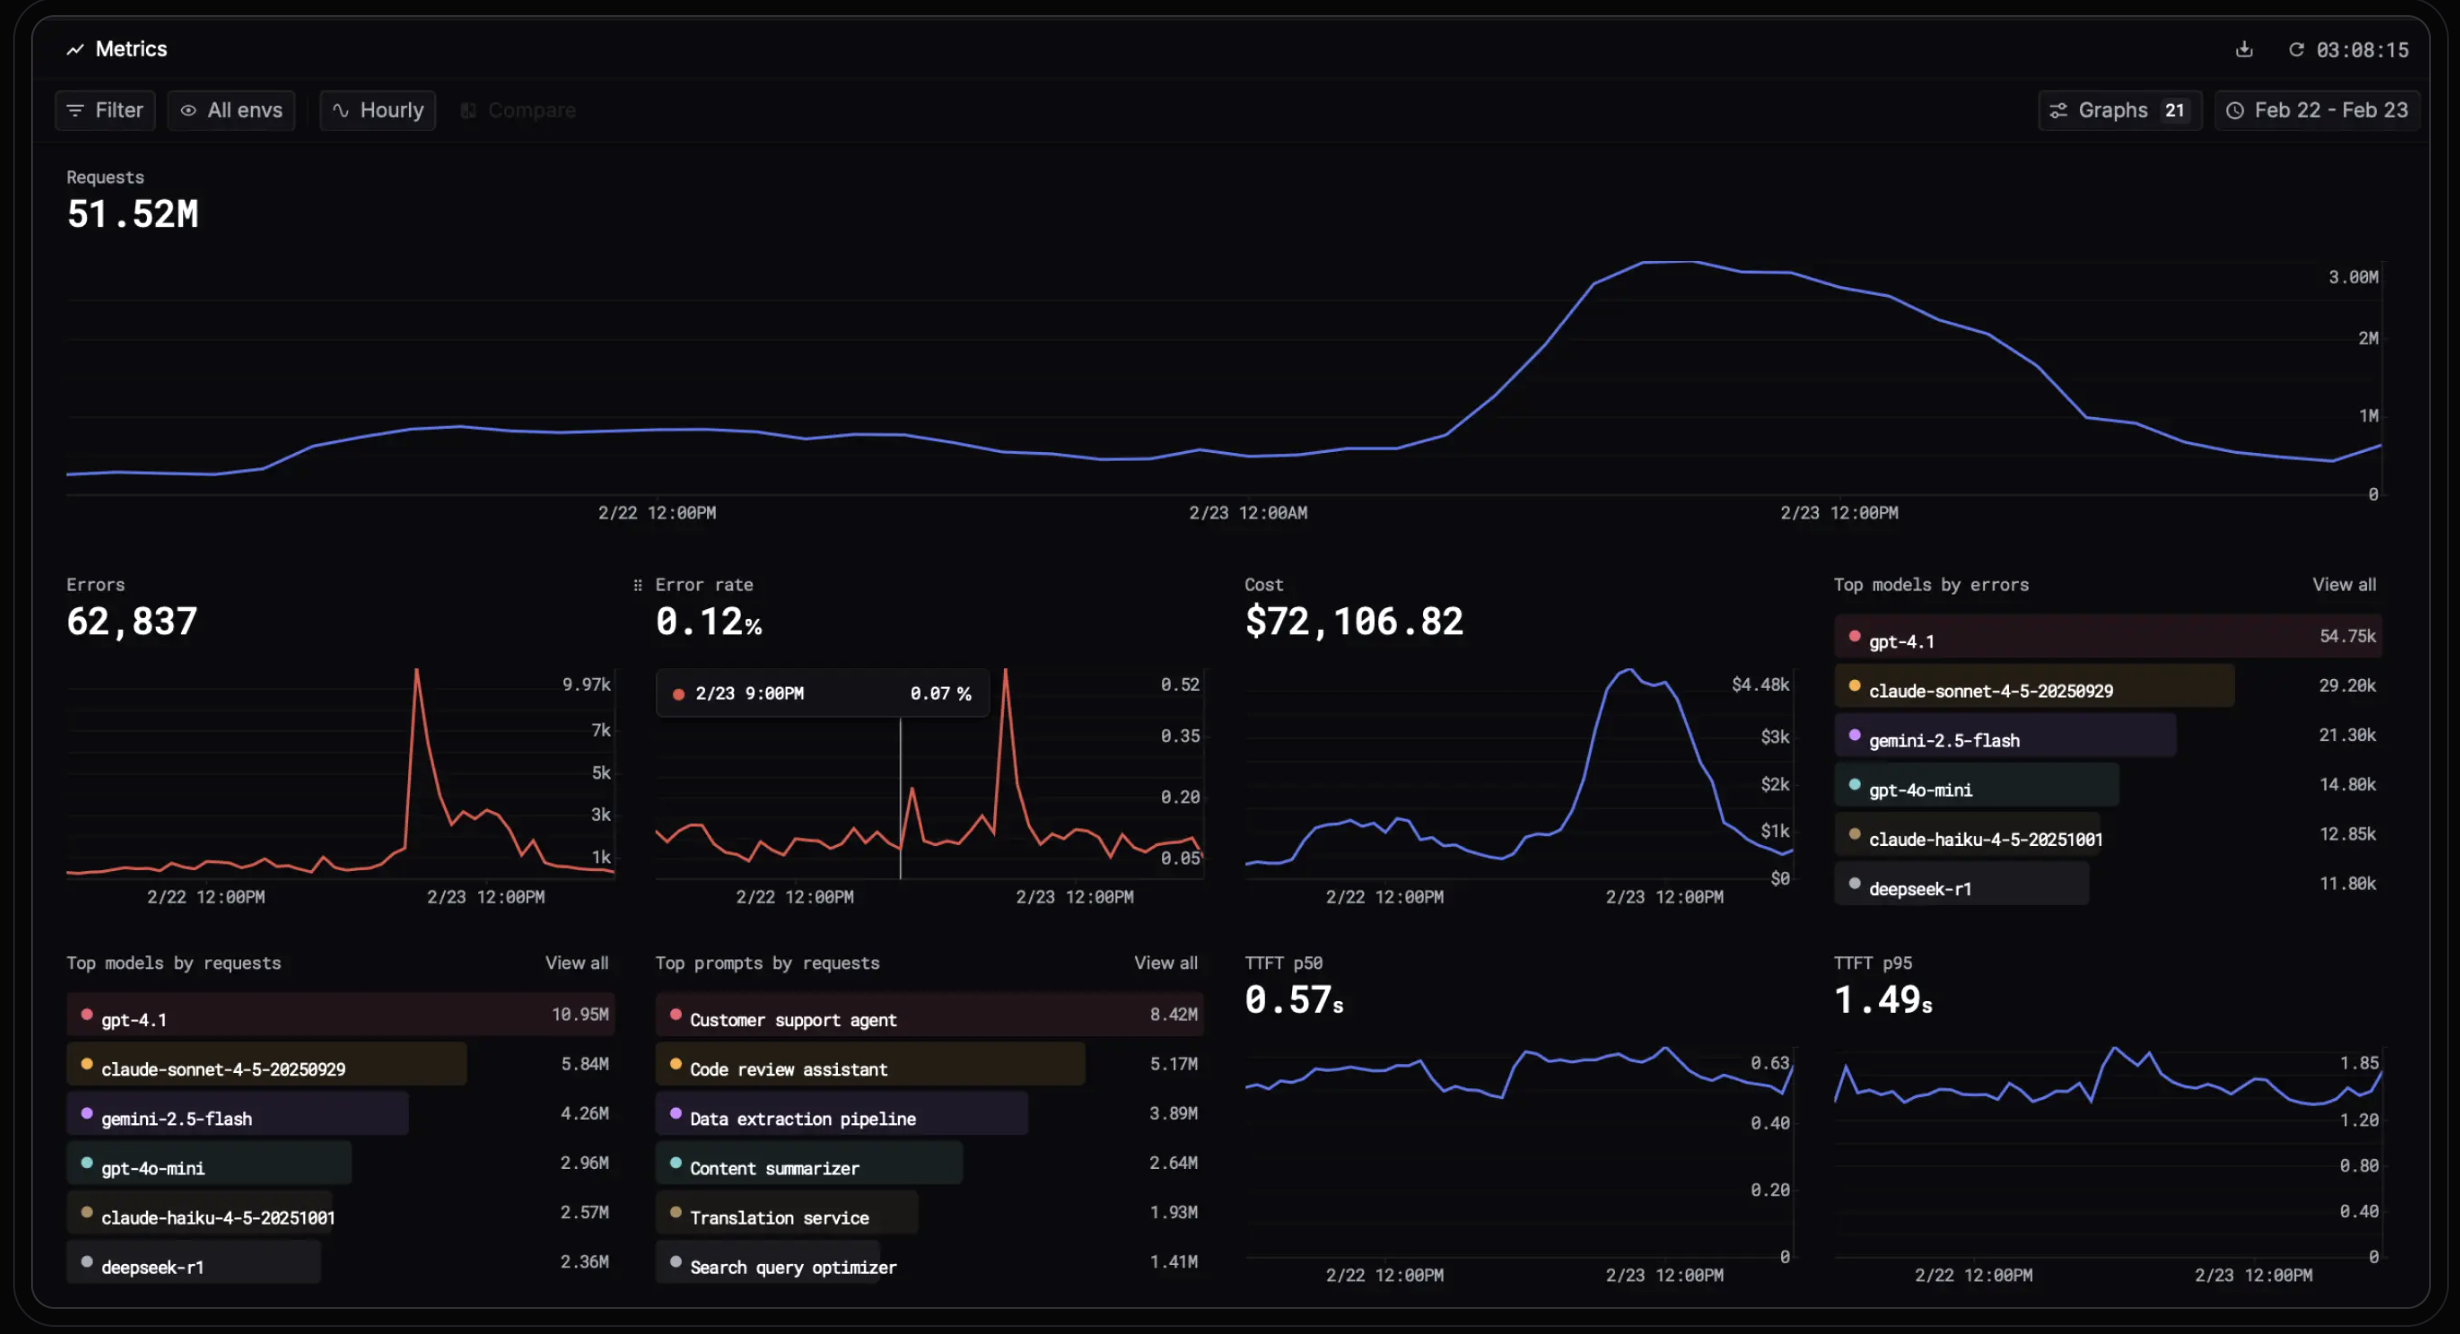
Debugging an agent usually means holding four tools open and matching timestamps between them. Respan puts tracing, evaluation, prompt optimization, and model routing on one platform. Route, observe, and evaluate every LLM call.
Here's why Respan is the best LLM observability tool out there:
-
Full agent traces - Every prompt, tool call, and response renders as one tree, so a bad output resolves to the exact step that caused it rather than a list of successful requests.
-
Metrics tied to the run behind them - A trace carries the prompt version that produced it and the routing decision that served it, which removes the correlation step that consumes most of the time in an incident.
-
Evaluation on live traffic - Rule-based checks and LLM-as-judge score production responses, not only offline datasets, so a quality regression surfaces while it is still small.
-
Monitors that fire on quality - Cost, latency, error rate, and token volume alert Slack, email, or a webhook on breach, scoped by model, project, environment, or user.
-
Cost broken down by feature - Spend splits by model, user, and API key, which names the change that doubled the bill and the week it happened.
-
Routing and failover on the same platform - The AI gateway reaches 1,000+ models through one endpoint with automatic failover, response caching, load balancing, and per-key spend limits, so a provider outage does not become downtime.
-
Red teaming on deployed agents - Tests what an agent blocks and what gets through before a user finds the gap.
-
Enterprise compliance - SOC 2, ISO 27001, GDPR, and HIPAA, with a BAA available.
Instead of reading logs after the fact, use Respan to run observability in production, know when production shifts, and act before it spreads.
For example, Mem0 runs its memory layer on Respan at hundreds of millions of LLM calls a day across multiple providers, at 99.99% reliability. Every user interaction chains extraction, retrieval, synthesis, and orchestration, and each step can hit a different model on a different provider.
Pricing: The free tier covers the full platform at 100,000 logs, 1,000 scores, five datasets, two evaluators, and five prompts, with unlimited seats and seven-day retention. Team is $199 per month billed yearly, lifting datasets, evaluators, and prompts to unlimited, retention to 30 days, and scores to 10,000, with five members included and additional seats at $15 each.
Best fit: teams running agents in production who would rather debug one system than four.
Stop guessing why your LLM app broke
See what your agents actually did in one place. Respan traces every prompt, tool call, and response, tracks cost and latency, and runs evals so you can go from a bad output to the exact step that caused it.
2. Arize
- Type: ML and LLM observability platform
- Price: Phoenix free, AX from $50/month
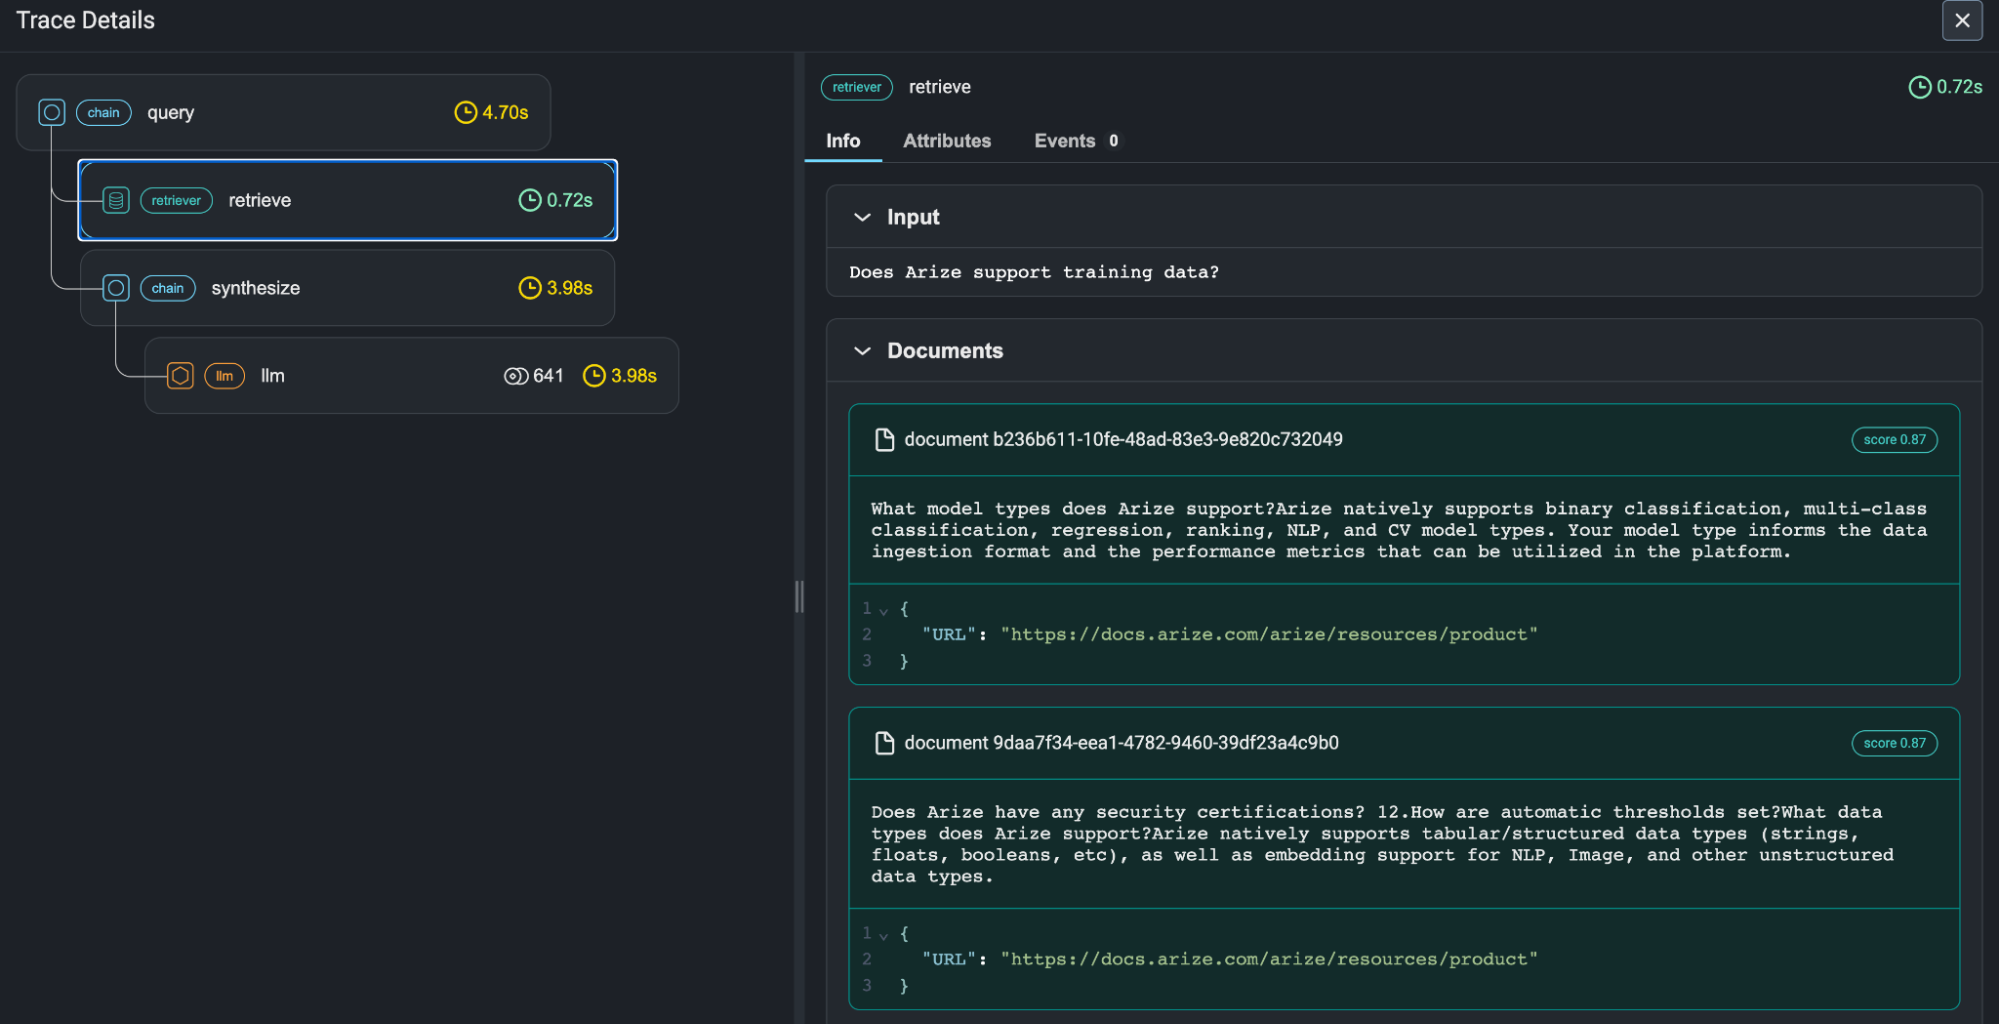
Arize sells two products. Phoenix is an open-source tracing and evaluation library under Elastic License 2.0 that runs locally, in a notebook, or in Docker. Arize AX is the managed platform, covering tracing, evaluation, monitoring, and prompt iteration. Both span classical ML monitoring and LLM workloads, which is the same range Fiddler covers.
Where it falls short: built-in metrics for faithfulness and hallucination are not included, so evaluation means writing custom evaluators. Prompt versioning is limited. Retention is 15 days on AX Free and 30 days on AX Pro. There is no gateway. Between AX Pro at $50 a month and a custom Enterprise contract there is no middle tier.
Pricing: Phoenix is free and self-hosted with no usage caps. AX Free is $0 at 25,000 spans per month, 1GB of ingestion, and 15-day retention. AX Pro is $50 per month at 50,000 spans, 10GB, and 30-day retention, with additional spans at $10 per million and additional ingestion at $3 per GB. AX Enterprise is custom, available as SaaS or self-hosted, and adds SOC 2, HIPAA, SSO enforcement, RBAC, and multi-region deployment.
Best fit: organizations running classical ML and LLM workloads together that would rather not add a second vendor.
3. Galileo
- Type: Evaluation and guardrails platform
- Price: Free tier, Pro from $100/month
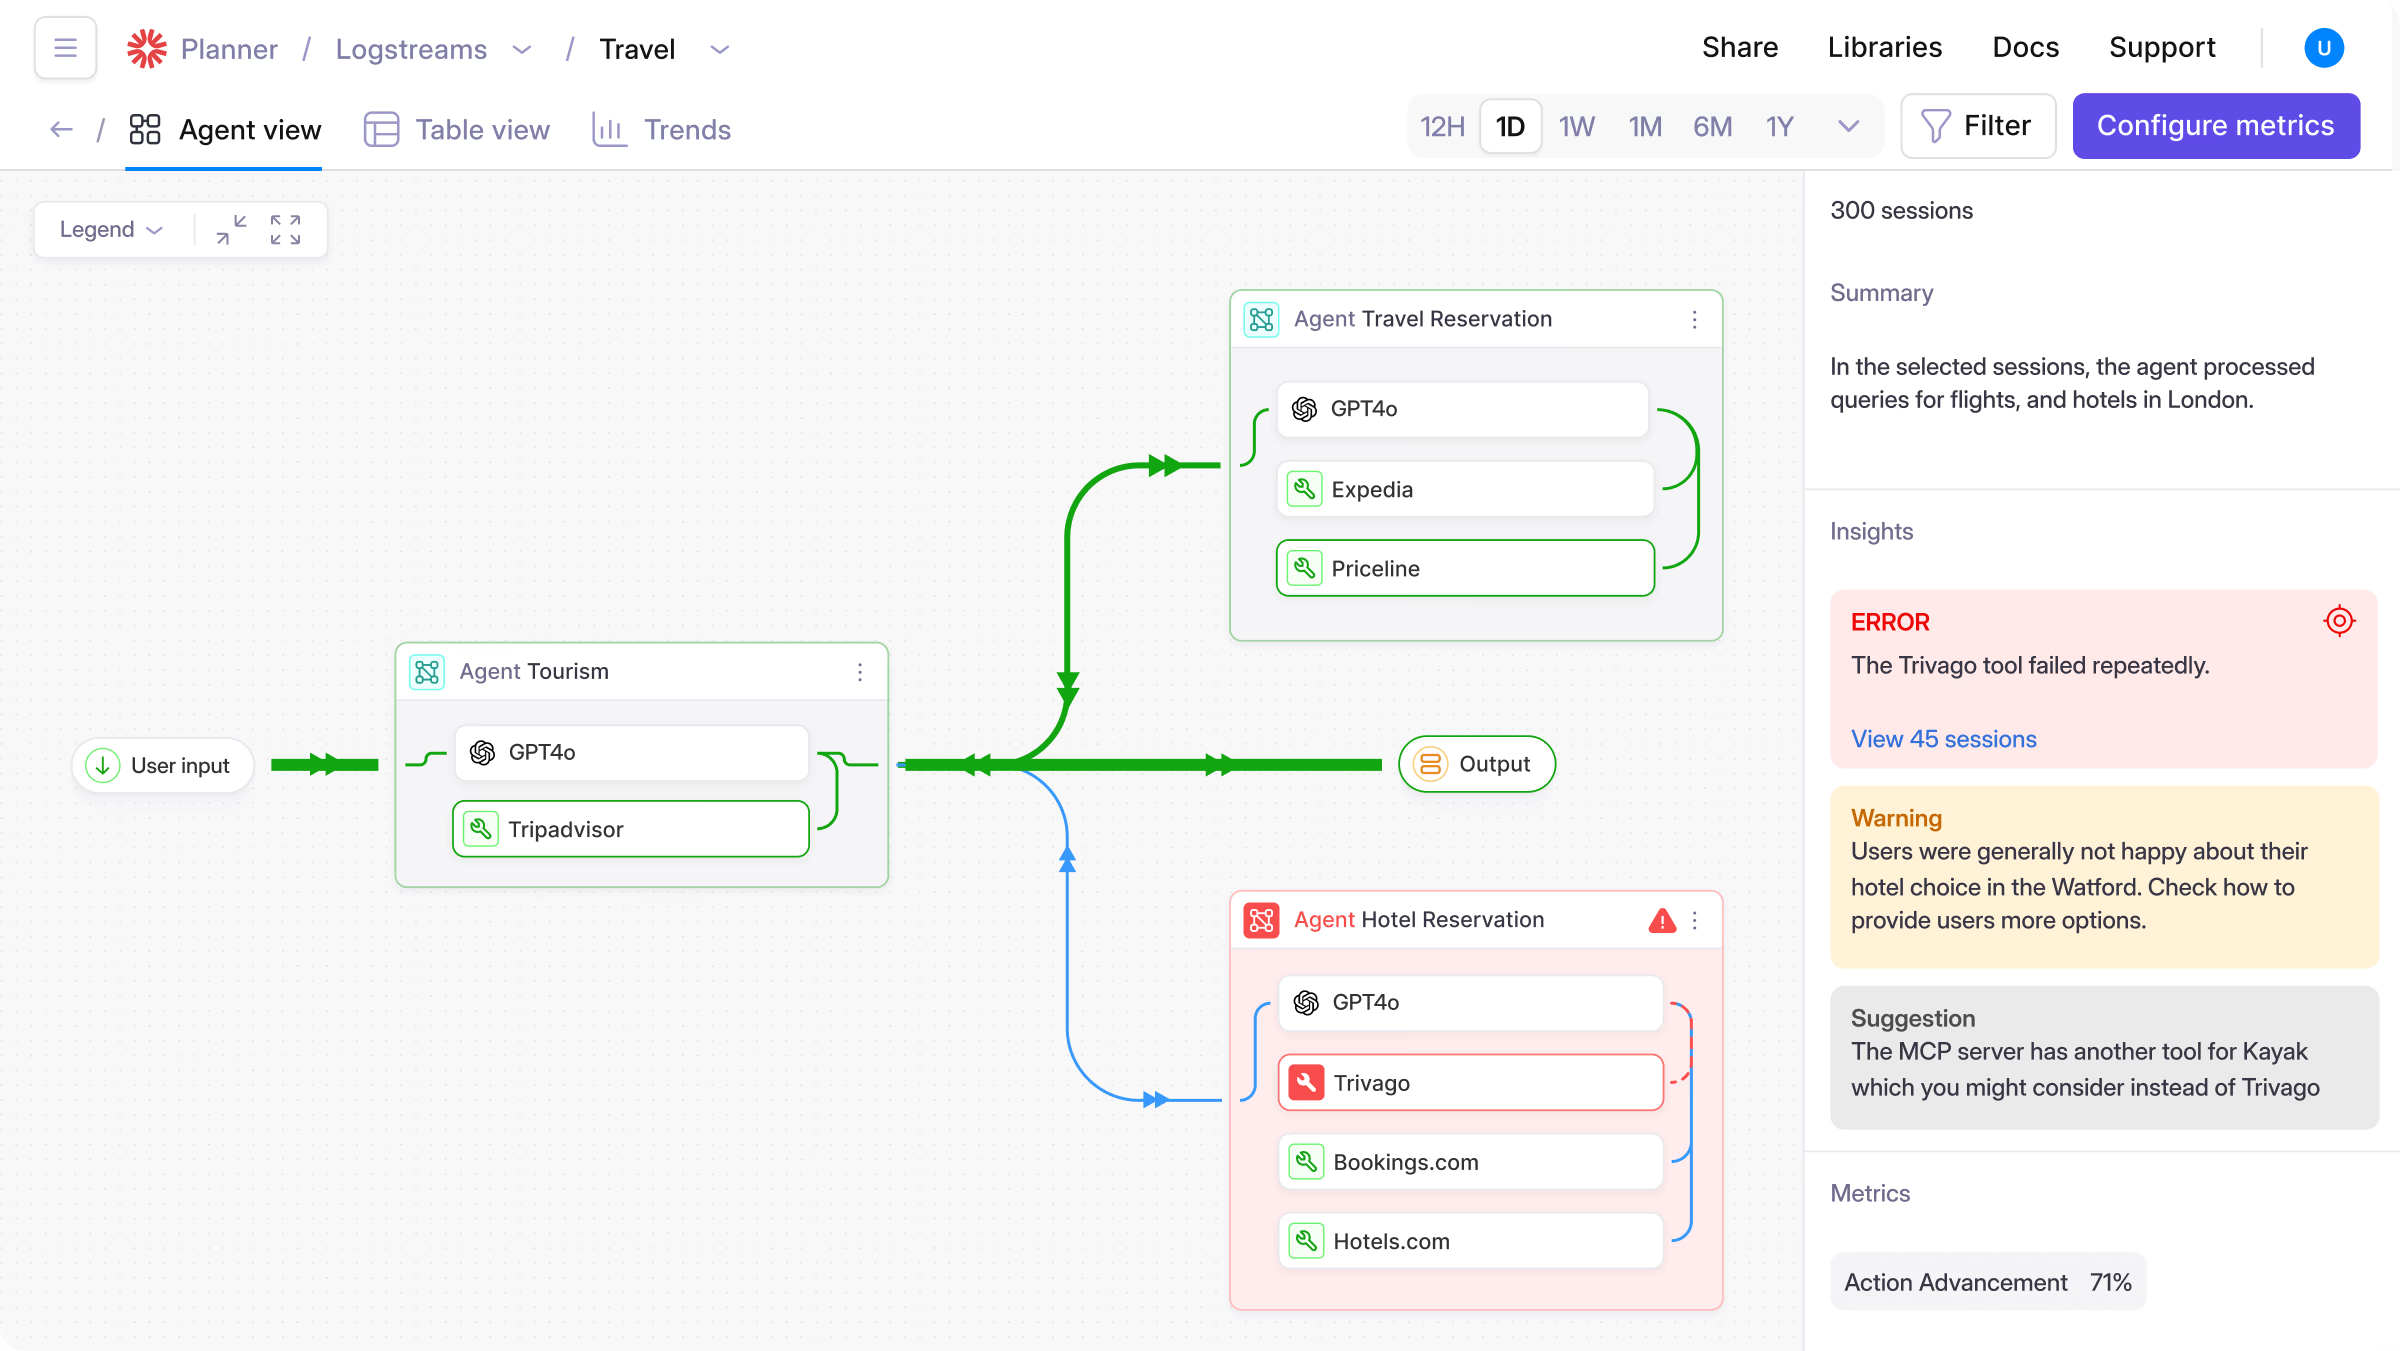
Galileo is a closed-source evaluation and guardrails platform. It scores outputs with Luna-2, its own family of small language models, and can reject a response inline before it reaches a user. Agentic metrics cover flow adherence, task completion, conversation quality, and agent efficiency.
Where it falls short: runtime guardrails and self-hosting are both Enterprise-only, so neither tier with a published price includes them. The free tier stops at 5,000 traces per month. There is no source to audit or extend, no gateway, and no way to gate a release on evaluation results without custom work.
Pricing: Free covers 5,000 traces per month with unlimited users and unlimited custom evaluators. Pro is $100 per month billed annually or $150 billed monthly, covering 50,000 traces with usage-based overages, standard RBAC, advanced analytics, and Slack support. Enterprise is custom and is where runtime guardrails, VPC and on-premise deployment, SSO, and dedicated support live.
Best fit: teams whose primary requirement is packaged evaluation and inline guardrails, with the budget for the tier where the guardrails actually sit.
4. Langfuse
- Type: Open-source LLM observability platform
- Price: Free tier, from $29/month
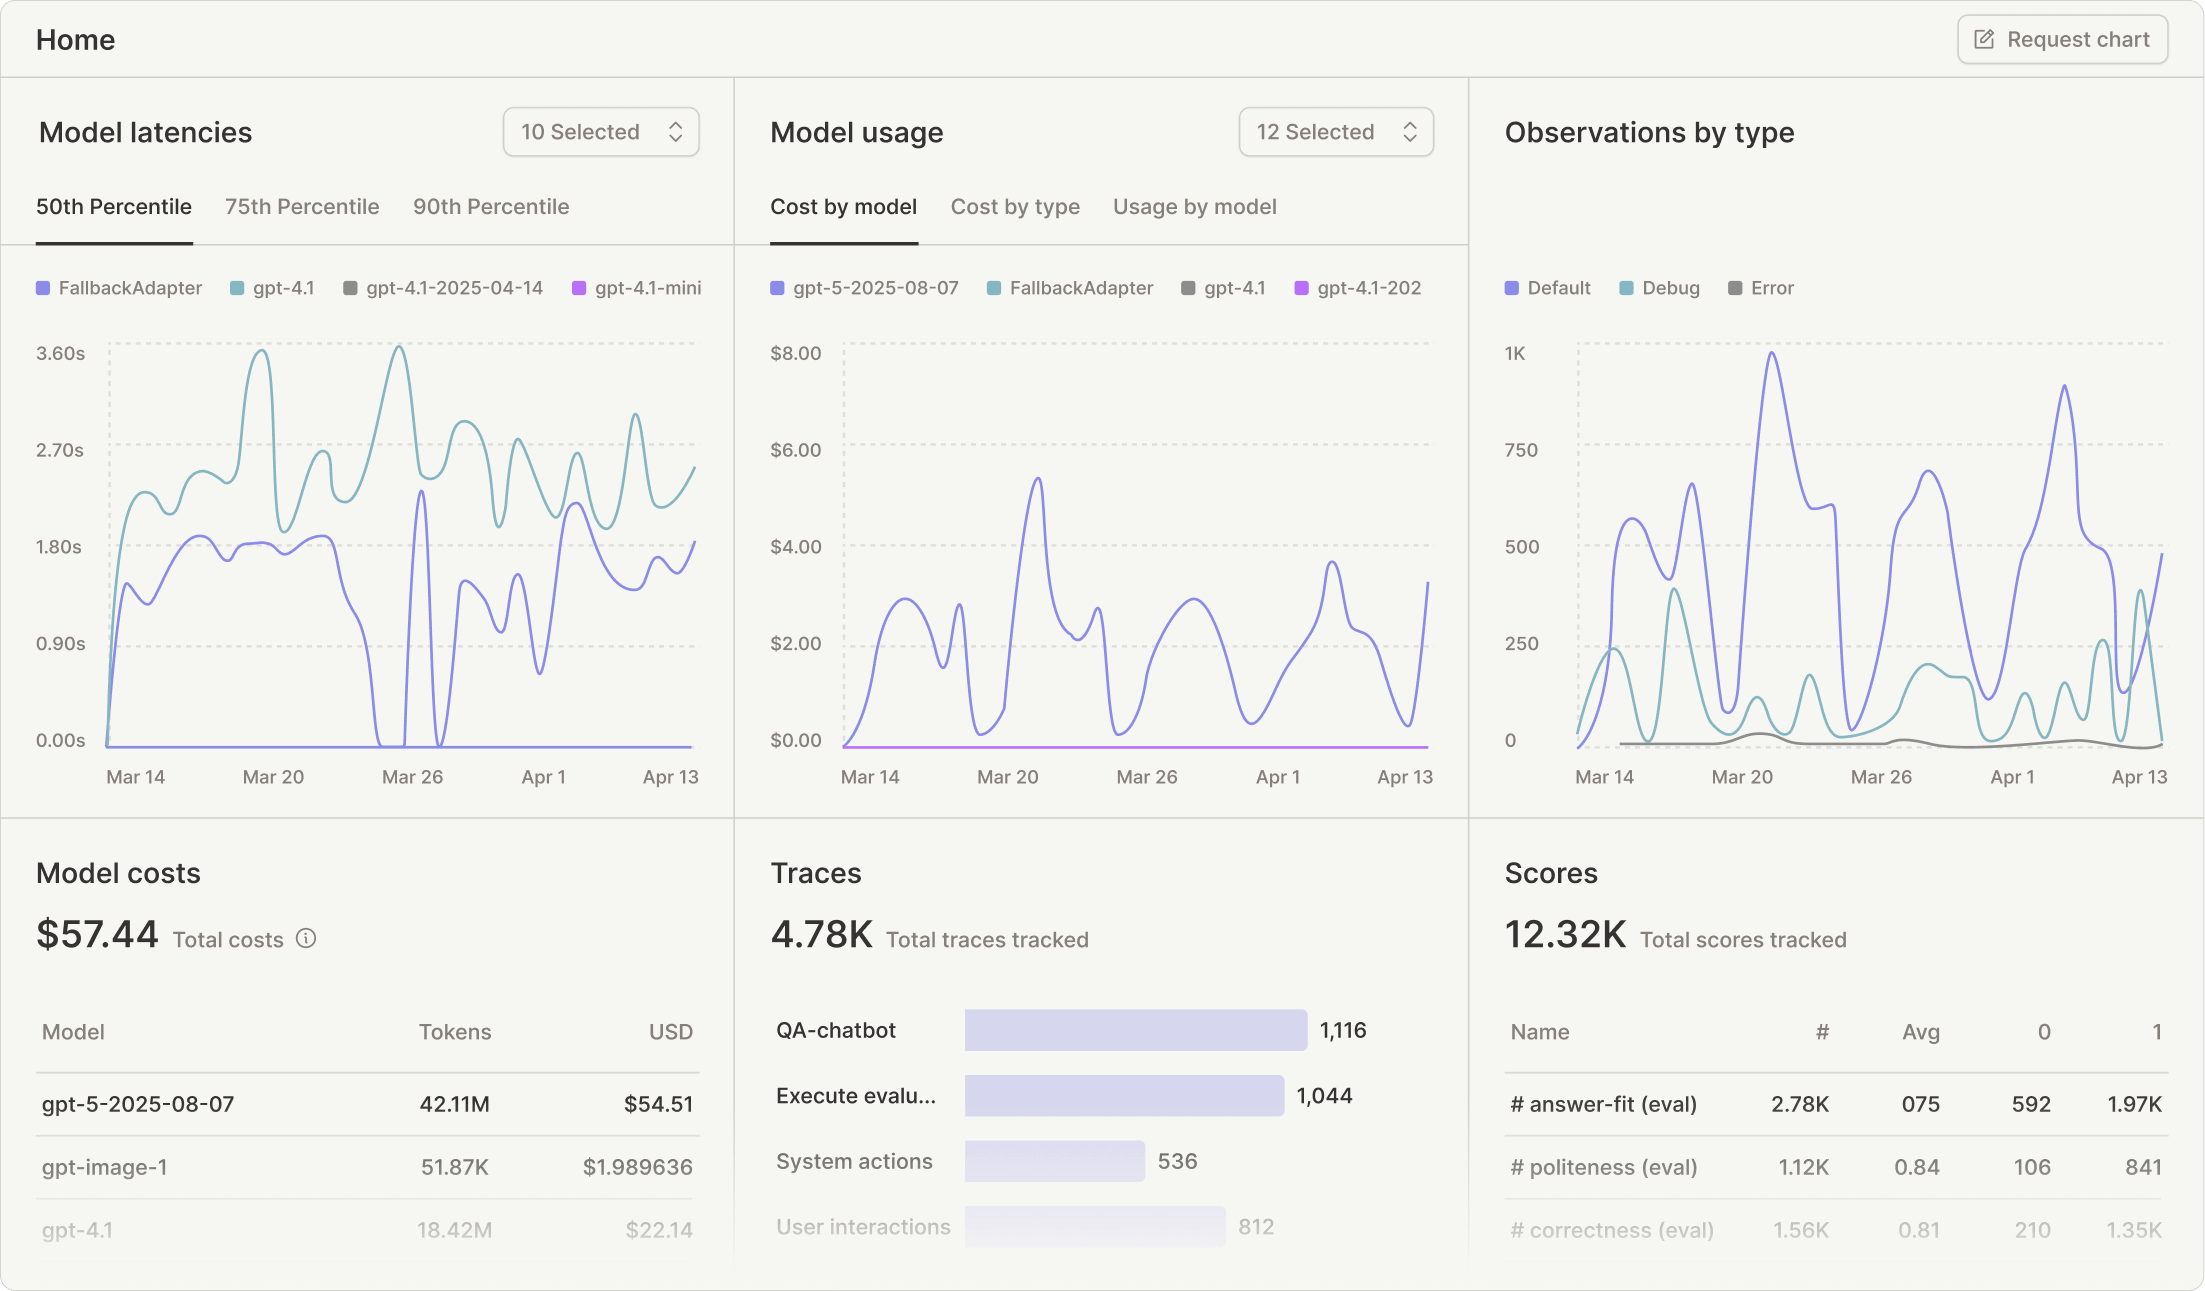
Langfuse is an open-source tracing and prompt management platform. The MIT-licensed core self-hosts as the full product, with no seat caps, retention limits, or usage caps, and managed cloud is the alternative. ClickHouse acquired Langfuse in January 2026 with no change to pricing, licensing, or self-hosting.
Where it falls short: Langfuse scores outputs through LLM-as-a-judge evaluators and annotation queues, but every score bills as a unit alongside every trace and observation, so scoring live traffic multiplies the meter instead of adding a flat cost on top of it. There is no gateway. Self-hosting in production means operating Postgres, ClickHouse, Redis, and object storage, so the MIT license describes licensing cost rather than total cost.
Pricing: Hobby is free at 50,000 units per month with 30-day retention and two users, where a unit is any trace, observation, or score sent to the API. Core is $29 per month at 100,000 units with unlimited users and $8 per additional 100,000. Pro is $199 per month and adds SOC 2 Type II, ISO 27001, and HIPAA. Enterprise is $2,499 per month for SCIM, audit logs, and SLAs. Self-hosting the MIT core costs nothing in licensing and whatever the infrastructure costs.
Best fit: engineering teams with data residency requirements and the ops appetite to run the stack themselves.
5. LangSmith
- Type: Observability and evaluation platform
- Price: Free tier, from $39/seat/month
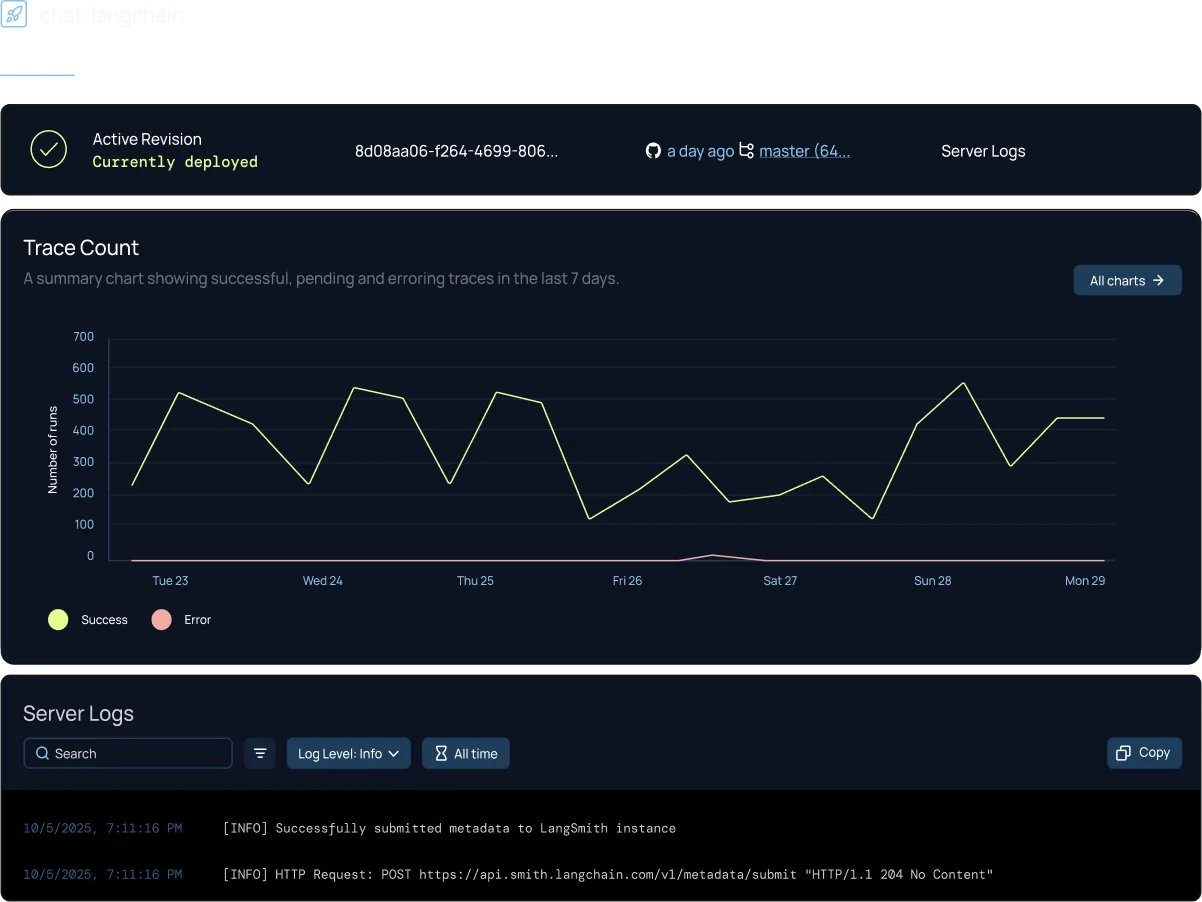
LangSmith is the LangChain team's tracing and evaluation platform. It renders full execution trees and routes selected traces to human reviewers through annotation queues, whose output feeds evaluation datasets. A traceable wrapper covers code outside LangChain.
Where it falls short: trace depth outside LangChain and LangGraph is thinner, which makes adoption a bet on a framework as much as on a platform. Built-in evaluation metrics are limited with tools like LangSmith. Self-hosting is Enterprise only. Pricing is per seat, which restricts who can use the annotation queues. Trace overage rates change with the retention setting, so a configuration choice drives the invoice at volume. There is no gateway.
Pricing: Developer is free at 5,000 traces per month. Plus is $39 per seat per month with 10,000 base traces, then $2.50 per 1,000 traces at 14-day retention or $5.00 per 1,000 at 400-day retention. Enterprise is custom. At a million traces a month, the retention setting alone roughly doubles the bill.
Best fit: teams whose stack is LangChain today and will still be LangChain in two years.
6. Braintrust
- Type: Evaluation-first platform
- Price: Free tier, Pro $249/month
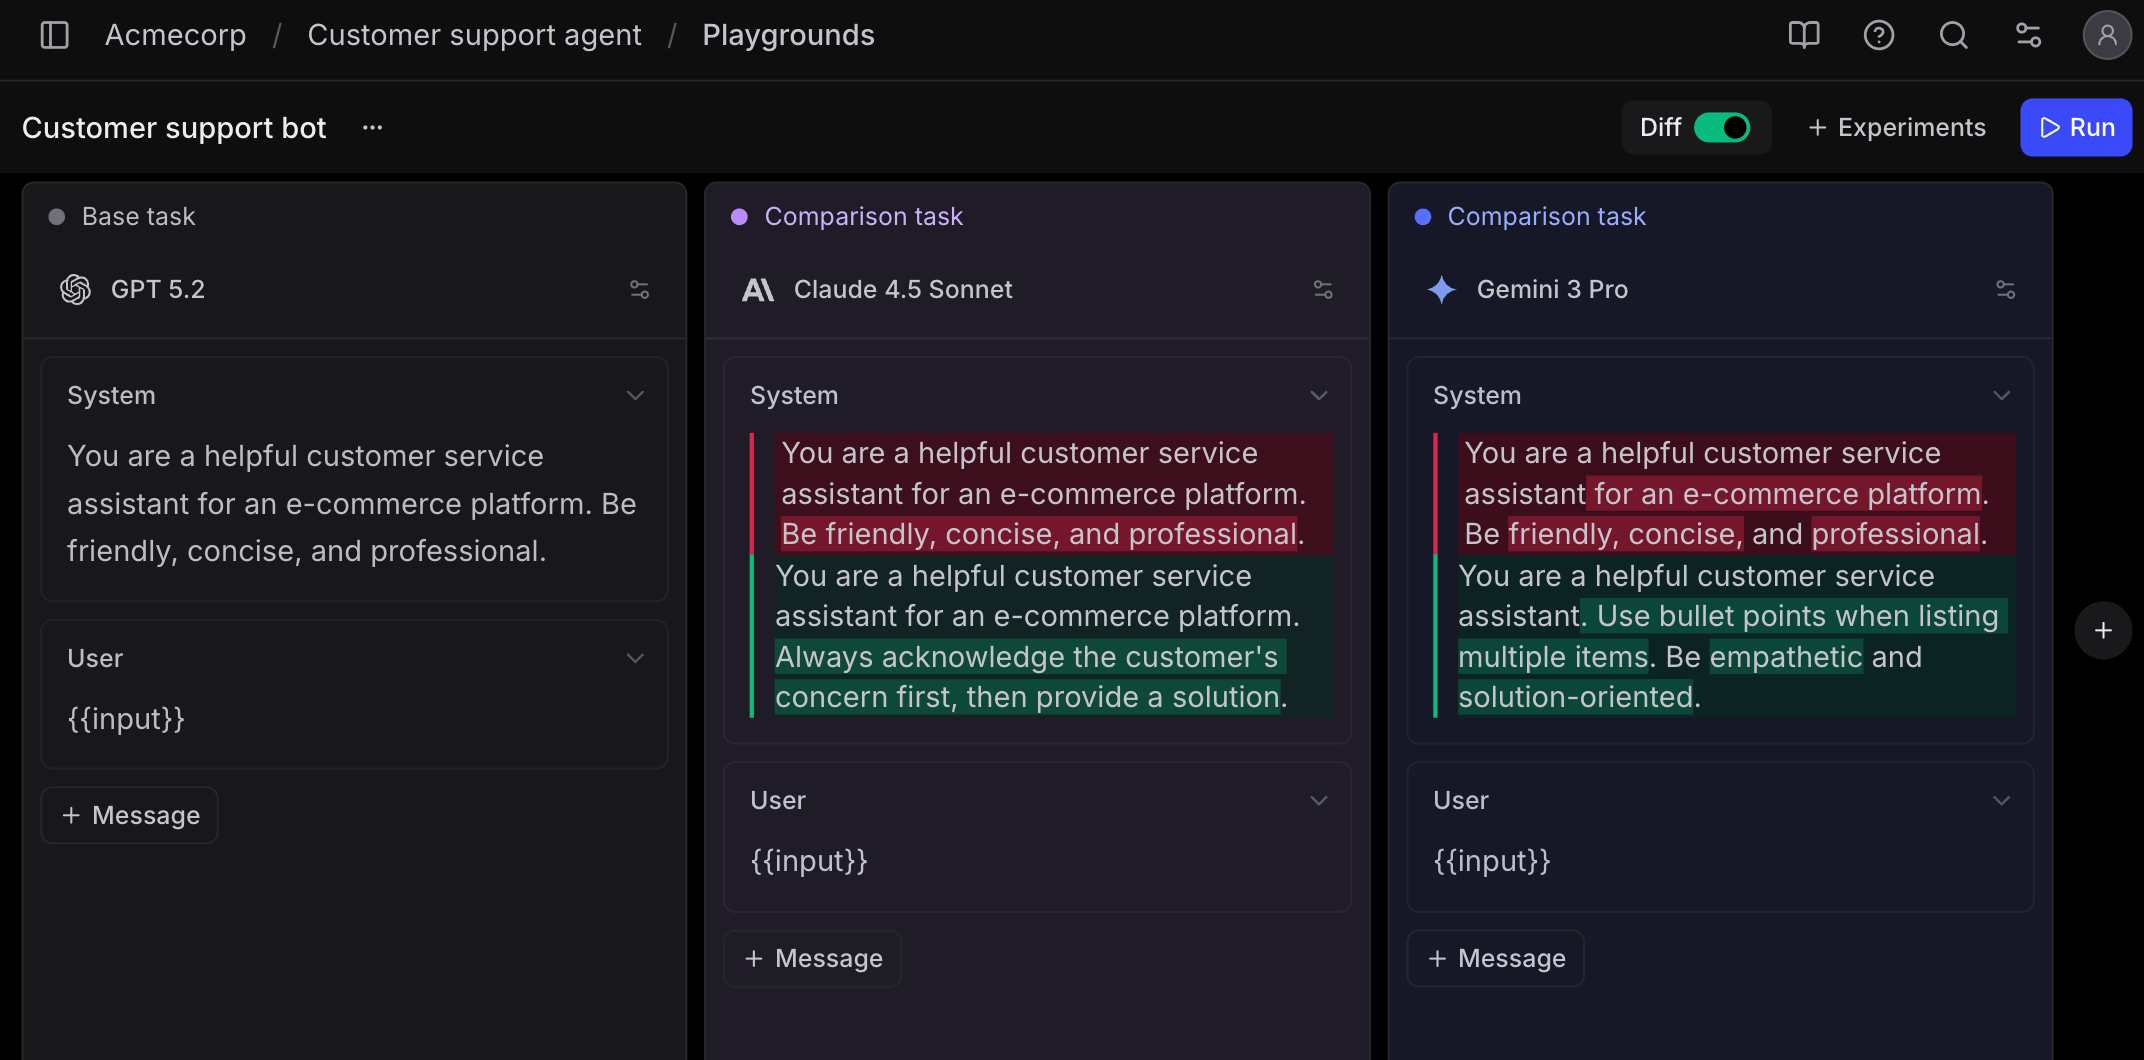
Braintrust is an evaluation platform. Datasets, code-based scoring functions, comparison reports, and regression testing are the core of it, and evaluation results can block a merge in CI/CD. Billing runs on processed data volume rather than trace count.
Where it falls short: tracing serves the evaluation workflow rather than production debugging, so it is less developed than in tools built for incident response. There is no gateway. Self-hosting is Enterprise only and that pricing is not published. Evaluation volume tracks the size of the test suite rather than traffic, so the tier jump arrives on a schedule the team does not set.
Pricing: Free covers 1GB of processed data and 10,000 scores with unlimited users. Pro is $249 per month at 5GB and 50,000 scores. Enterprise is custom. Data-volume billing diverges from trace billing at agent scale, since a run carrying large retrieved contexts costs more than a run with many small steps.
Best fit: teams where evaluation discipline is the constraint rather than production visibility.
7. Portkey
- Type: AI gateway with observability
- Price: Free tier, Production $49/month
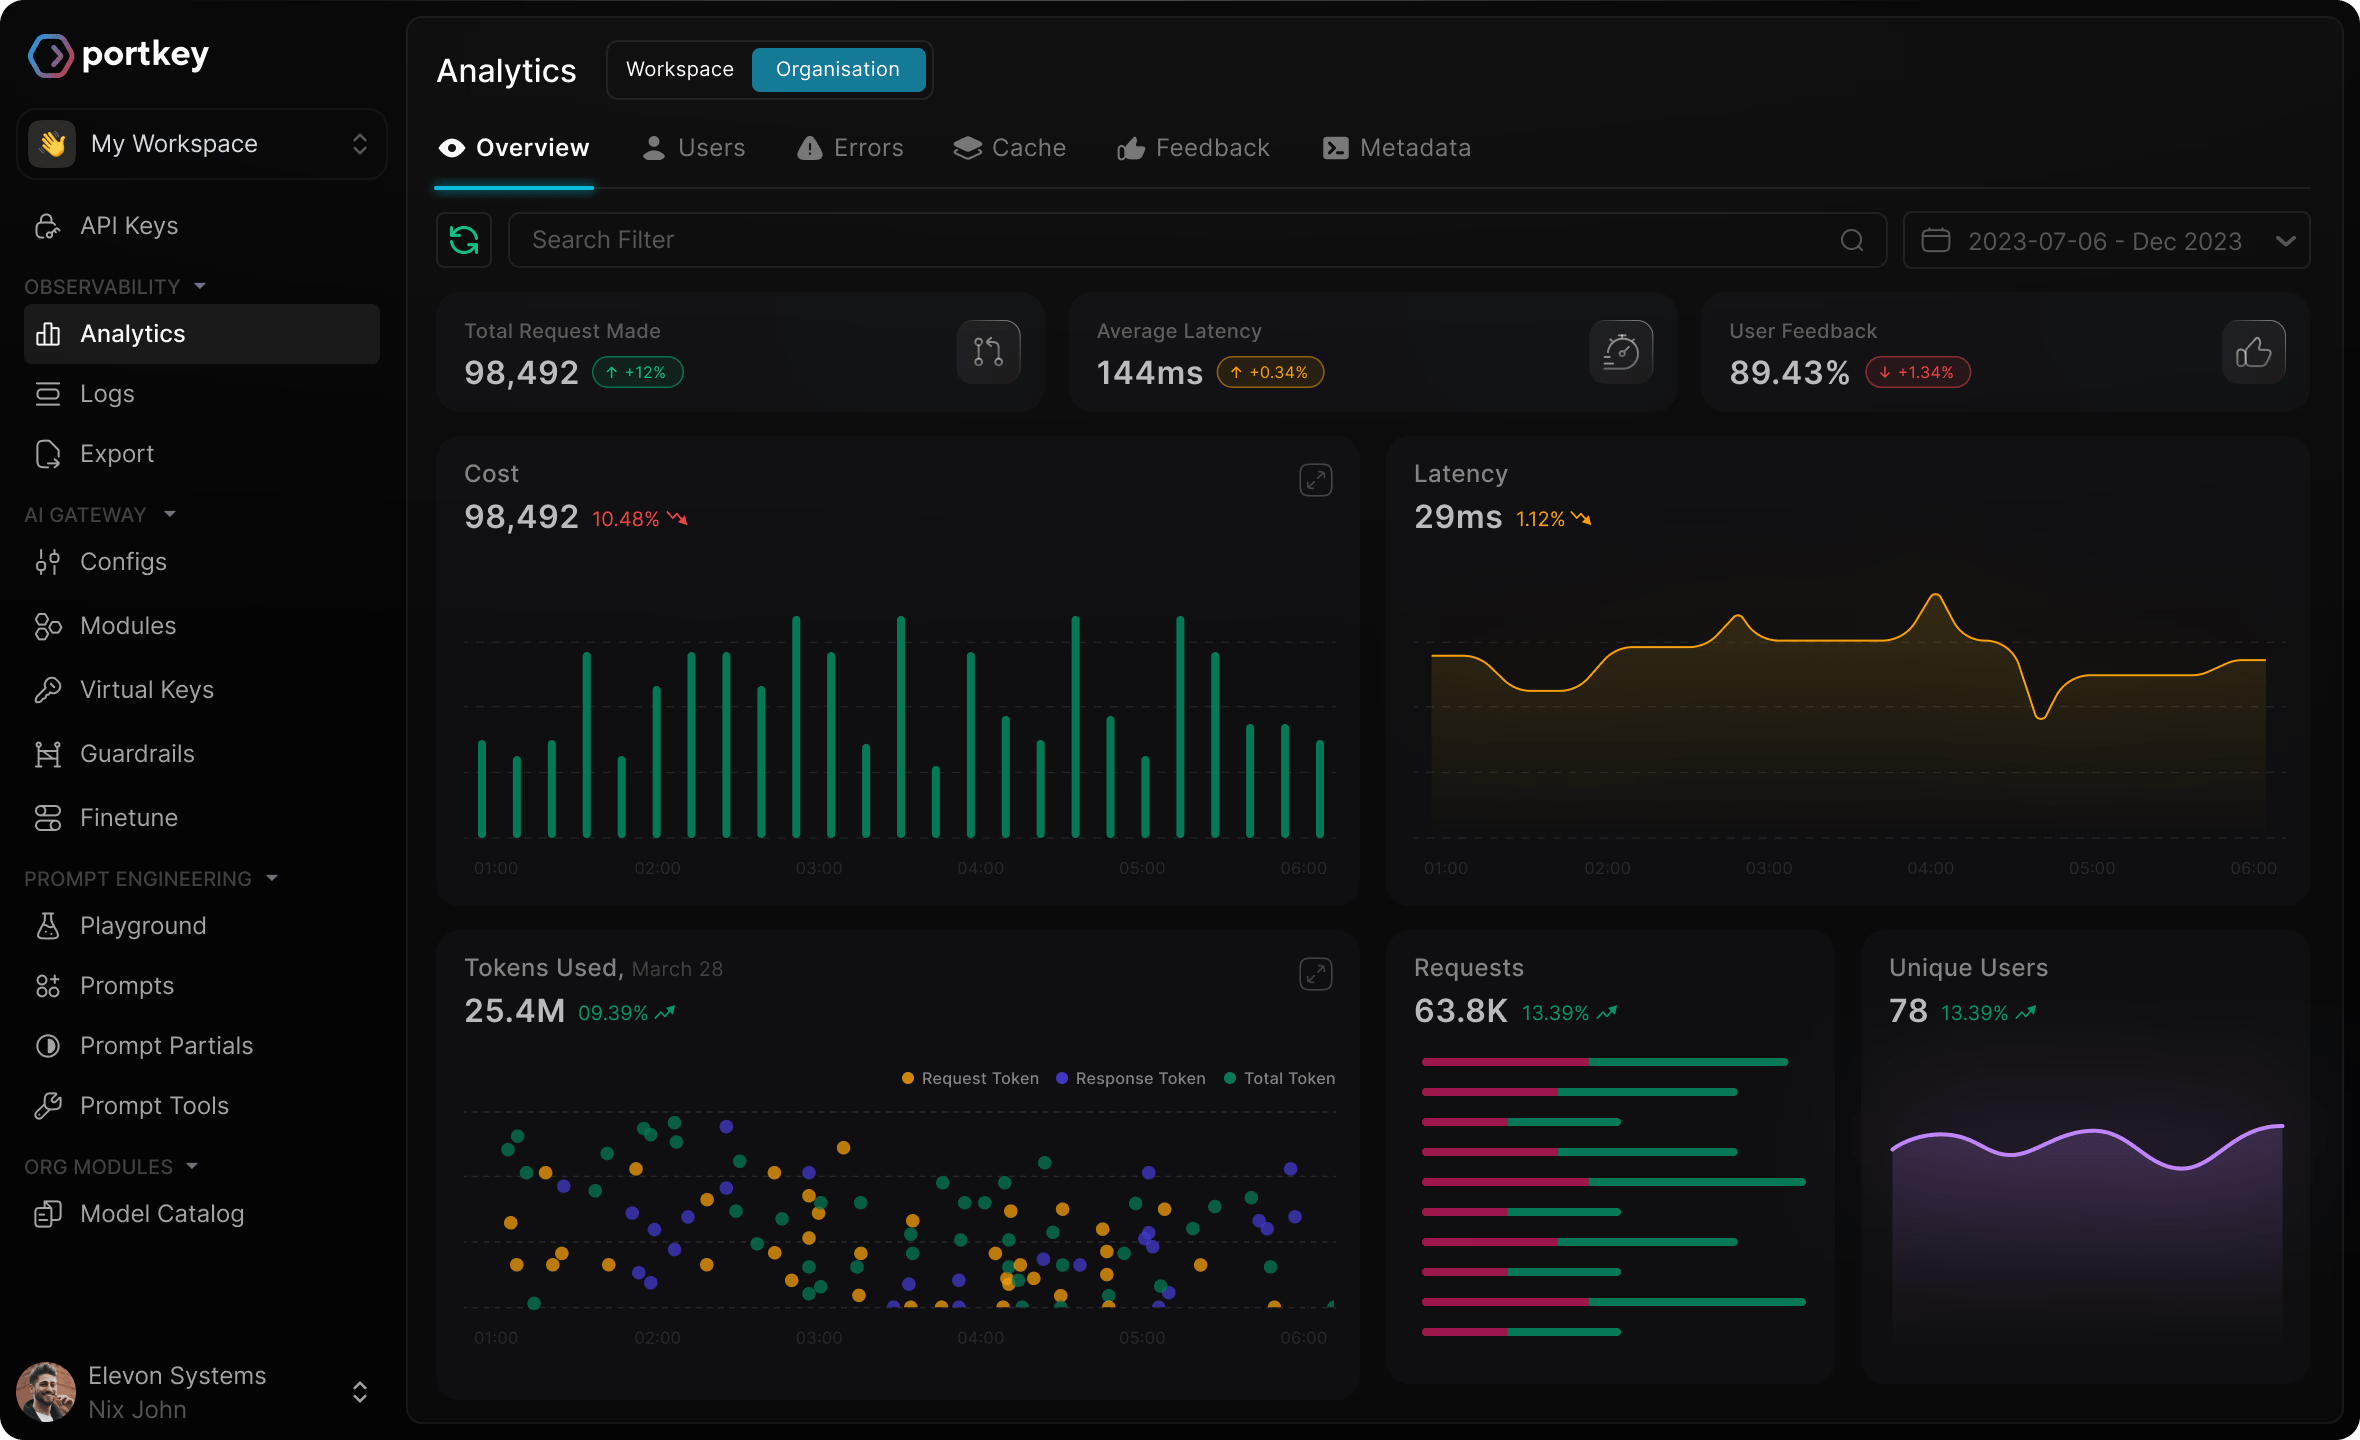
Portkey is an AI gateway with observability attached. One endpoint fronts model providers with fallbacks, load balancing, retries, timeouts, and both simple and semantic caching, and virtual keys carry budget and rate limits. The gateway is open source and self-hostable. Palo Alto Networks has acquired Portkey, so the roadmap now sits with a network security company.
Where it falls short: visibility is request-shaped. Portkey sees calls passing through it rather than the reasoning between them, so an agent run reads as a sequence of related requests and step-level depth still requires application-side instrumentation. Evaluation is limited to guardrail templates. The free tier is 10,000 logs at three-day retention, which Portkey's own plan description calls unsuitable for production. The proxy sits in the request path, so its availability is your availability.
Pricing: the open-source gateway is free to self-host. Developer is free at 10,000 recorded logs per month with three-day log retention and 30-day metrics. Production is $49 per month at 100,000 logs with 30-day retention, plus $9 for every additional 100,000 requests up to three million. Enterprise is custom, starts at 10 million logs per month, and adds VPC hosting, SOC 2, ISO 27001, GDPR, HIPAA, BAA signing, SSO, and custom retention periods.
Best fit: teams whose first problem is routing and spend control rather than trace depth.
8. Datadog LLM Observability
- Type: APM platform with an LLM module
- Price: Free tier, from $160/month
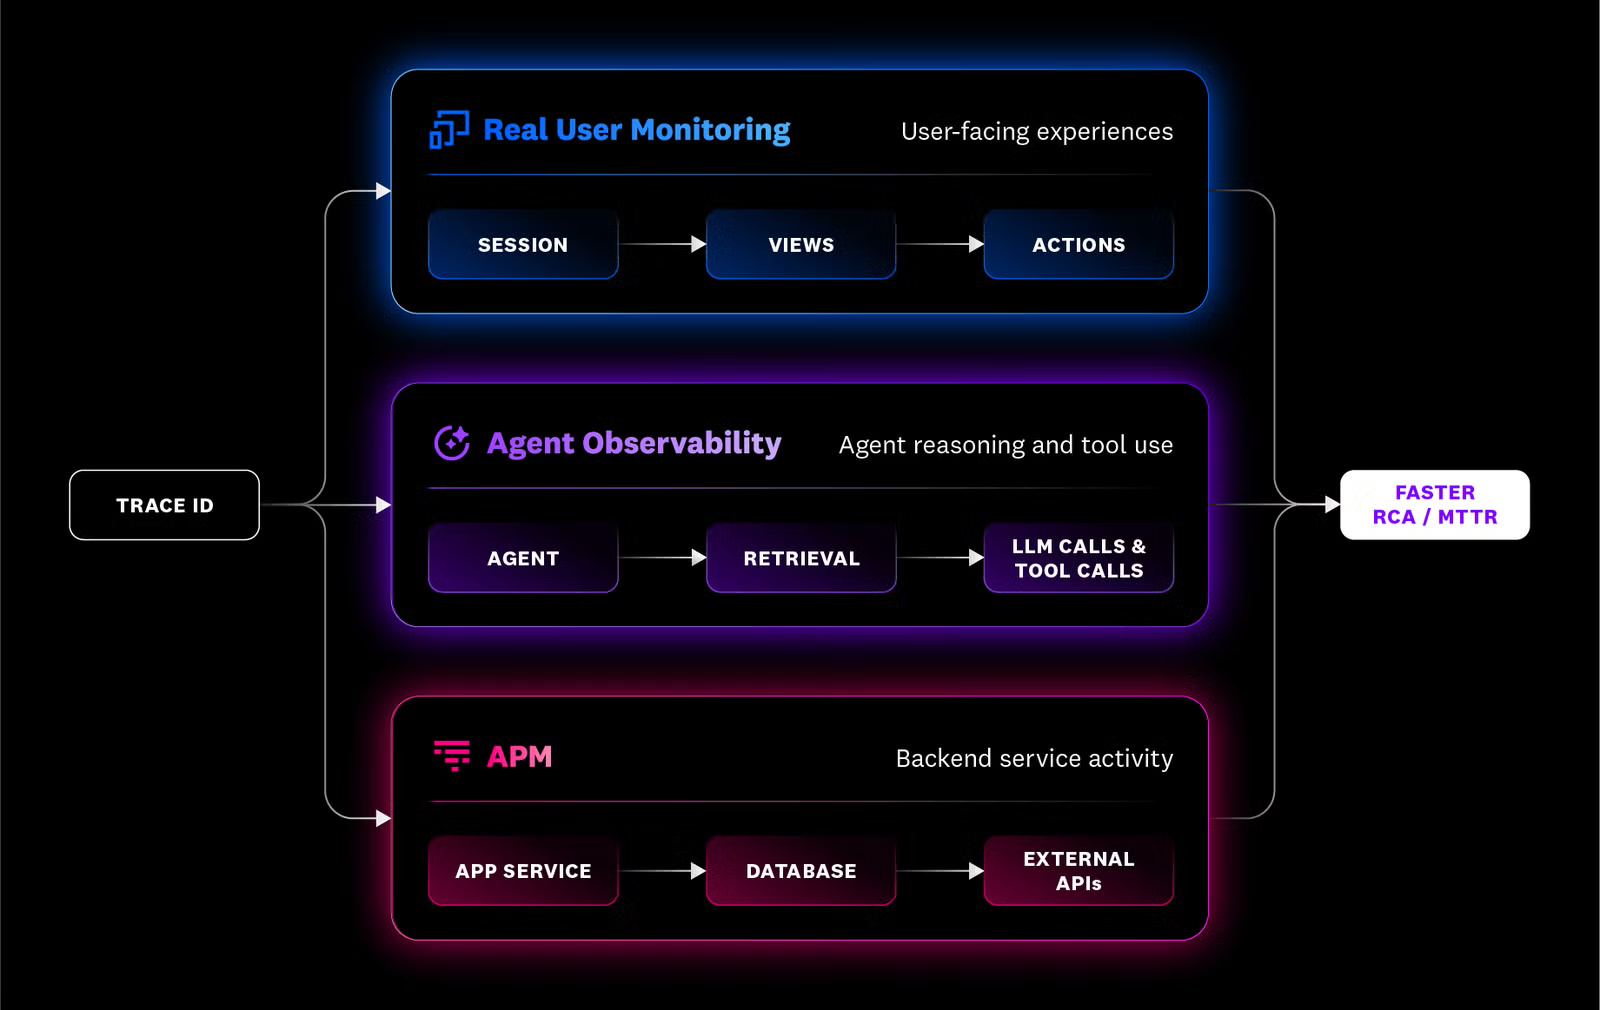
Datadog LLM Observability is an LLM module on an APM platform. It correlates LLM spans with the rest of an application trace, and instruments through the Python SDK or through environment variables in serverless environments.
Where it falls short: alerting fires on latency and error rate, which are the failure modes LLM systems produce least often. Retention defaults to 15 days on both the free and paid tiers, with extensions billed per 10,000 spans. There is no self-hosting and no gateway. Every other Datadog product bills separately, so $160 is a floor rather than a total.
Pricing: the free tier covers 40,000 LLM spans per month. Pro starts at $160 per month for 100,000 LLM spans, with on-demand usage billed beyond that. Only LLM spans bill, so tool, embedding, retrieval, and agent spans do not count against the allowance.
Best fit: teams already standardized on Datadog, or as a secondary destination fed by OpenTelemetry from a dedicated platform.
Stop guessing why your LLM app broke
See what your agents actually did in one place. Respan traces every prompt, tool call, and response, tracks cost and latency, and runs evals so you can go from a bad output to the exact step that caused it.
FAQ
What is the best Fiddler AI alternative?
Respan is built around finding the step that broke. It renders the full agent run as one trace, scores live production traffic rather than curated datasets, breaks cost down by model, user, and API key, and puts the gateway that routed a request on the same platform as the trace that recorded it. Which of the others fits depends on what you are replacing.
How much does Fiddler AI cost?
Fiddler publishes three tiers. The free tier covers real-time guardrails only. The Developer tier is $0.002 per trace and includes observability, tests and experiments, custom evaluators, RBAC, and SSO on SaaS deployment. Enterprise is custom-priced and adds enterprise-grade guardrails, VPC and on-premise deployment, and dedicated support.
Does Fiddler AI have a free tier?
Yes, but it covers guardrails rather than observability. The free tier detects hallucinations, toxicity, PII and PHI exposure, prompt injection, and jailbreak attempts. Inspecting a trace requires the Developer tier and per-trace billing.
Is Fiddler AI built for LLM and agent workloads?
It supports them. Fiddler has repositioned around an AI Control Plane for agents, with agentic observability, continuous evaluations, and inline guardrails, and the Developer tier covers agentic and predictive systems explicitly. The question is not capability but orientation. The workflow, the compliance surface, and the deployment story are all shaped for the governance function, which is a different reader than the engineer trying to find the step that broke.
What is the difference between AI governance and LLM observability?
Governance answers whether an AI decision can be defended: who approved the model, what it was trained on, why it produced a given output, and whether the process meets a regulatory standard. LLM observability answers what the system did on a specific run and what to change next: which prompt version was live, which tool call returned bad data, which model served the request, and what it cost.
The distinction sorts the vendor landscape. Arthur, WhyLabs, Evidently, and TruEra all sit on the governance and model monitoring side alongside Fiddler, which is why they dominate directory listings for this term. If the reason for leaving Fiddler is that engineers cannot debug agents in it, swapping to another model monitoring platform reproduces the problem. The AI observability tools built for LLM workloads are a separate group that solves that problem.
How do I migrate off Fiddler AI?
Instrument the new platform alongside Fiddler rather than cutting over. Writing instrumentation to OpenTelemetry GenAI semantic conventions rather than a proprietary SDK makes the next migration cheap, and several platforms here ingest OTLP directly. Run both in parallel long enough to confirm the new traces answer the questions the old dashboards answered, then decide what historical data needs exporting. Drift history and explainability artifacts generally do not carry across, so export what an audit would require before the contract lapses.
Route, observe, and evaluate every LLM call
An agent completes twelve steps, returns a wrong answer, and every span is green. Governance tooling records that the run happened and who is accountable for it. It does not tell an engineer which step to fix.
Respan gives you the full agent run as one trace, evaluation on live traffic rather than curated datasets, cost attribution down to the feature, and monitors that fire on quality instead of status codes, with the gateway that routed the request on the same platform as the trace that recorded it.