10 Best Jaeger Alternatives for Distributed Tracing (2026)
Dylan CableSeptember 18, 2026
Jaeger v2 retired the Jaeger clients, so your instrumentation is already OpenTelemetry and moving backends is an endpoint change. Here is what ten of them do once the spans arrive.
Jaeger v1 stopped receiving updates on December 31, 2025, including security patches. Anyone still running it has to touch the deployment, and upgrading to v2 is the obvious next step.
It is worth knowing what that upgrade involves, because v2 rebuilt the backend on the OpenTelemetry Collector framework and retired the Jaeger client libraries in favor of OpenTelemetry SDKs. Spans leave your application over OTLP, so the instrumentation in your services is already vendor-neutral, and pointing it at a different backend is an endpoint and a config file rather than a re-instrumentation effort.
That changes what the decision is about. Switching cost and lock-in are what a migration evaluation usually turns on, and neither applies the way it used to. What you are choosing is what a backend can do with a span once it has it: how you find the span, what it reads off it, and whether it can act on what it finds. Because the export runs through a Collector, you can also send the same spans to more than one destination, which makes "replace Jaeger" one option rather than the only one.
The ten Jaeger alternatives below are compared on exactly that.
Jaeger is an open-source distributed tracing platform, originally built at Uber in 2015 and now a CNCF-graduated project. It collects spans from instrumented services, stores them, and reassembles them by trace ID so a single request appears as a waterfall showing which operation ran, how long it took, and whether it failed.
Since v2, Jaeger runs on the OpenTelemetry Collector framework and receives OTLP natively on ports 4317 and 4318. The standalone agent tier from v1 is gone, and so are the Jaeger client libraries, which the project retired in favor of OpenTelemetry SDKs. A modern Jaeger deployment is the collector, the query service, and the UI, with an external storage backend behind them.
Storage is where the operational weight sits. Jaeger keeps spans in Cassandra or Elasticsearch, and those clusters scale with span volume and retention rather than with the size of your application, so the team running Jaeger ends up running a database whose load has no relationship to the services it observes.
What a span carries is the other half. Jaeger reads the fields it was designed around: service name, operation, duration, status, parent, and tags. When a span arrives carrying attributes it has no view for, the attributes are stored and searchable as tags, which is correct behavior and also the limit of it.
A model call that returns a wrong answer in 900 milliseconds with a 200 status looks identical to a healthy one on every field Jaeger organizes around, and the underlying mechanics of how that request gets assembled are covered in more depth in our guide to distributed tracing.
Is Jaeger Deprecated?
Jaeger v1 is deprecated. It reached end-of-life on December 31, 2025 and receives no further development, bug fixes, or security patches.
Jaeger v2 is not. It was released in November 2024, it is the supported line, and the project is still shipping against it. If a tutorial you are following mentions the Jaeger agent, the Jaeger client libraries, or jaegertracing/all-in-one, it is describing the architecture that ended.
Practically, the deprecation is what puts the backend decision back on the table. A team on v1 has to touch the deployment anyway. Since v2 retired the clients and the instrumentation is OpenTelemetry regardless of where the spans land, the migration to v2 and the migration to something else cost roughly the same amount of work.
What to Look For in Jaeger Tracing Alternatives
Because every backend here accepts OTLP, the criteria that usually dominate a migration evaluation are worth less than they look. Ingest compatibility is table stakes and switching cost is a config change. What separates these tools shows up after the spans arrive:
How you find a span - Search by trace ID covers the case where you already have the ID from a log or an error report. Search by attribute covers the case where you do not.
Cardinality tolerance - Attaching a customer ID, a tenant, or a model name to every span is only useful if the query engine can filter on a field with millions of distinct values without falling over.
What the backend reads versus stores - Every tool here will accept an arbitrary attribute. Fewer of them have a view organized around it, which is the difference between a searchable tag and a field the product understands.
Whether it can act on what it finds - A tracing backend that shows you a slow span and a platform that alerts on one are different products, and Jaeger has no built-in alerting at all.
Signal scope - Traces alone means running Prometheus and a log store beside it, and correlating across them yourself. Traces, logs, and metrics in one place means one system to operate and one query surface.
What the meter counts - Per host, per GB ingested, per event, per seat, and per metric sample diverge sharply at volume. Spans that carry prompts and outputs are larger than ordinary service spans, so an ingest meter moves faster on AI traffic than a host meter does.
What you operate - Free and self-hosted is a licensing statement. The cost is the storage cluster and its uptime during the incident you are using it to debug.
Whether it can run beside Jaeger - A Collector can export the same spans to more than one destination, so a backend that covers a gap Jaeger leaves does not have to replace Jaeger to be worth adopting.
Run the shortlist against real traffic from one service rather than a demo app. Search quality and cost at volume are both things that only show up once the span count is real.
10 best Jaeger Alternatives For Distributed Tracing
Here's our list of the best Jaeger alternatives for distributed tracing:
1. Respan
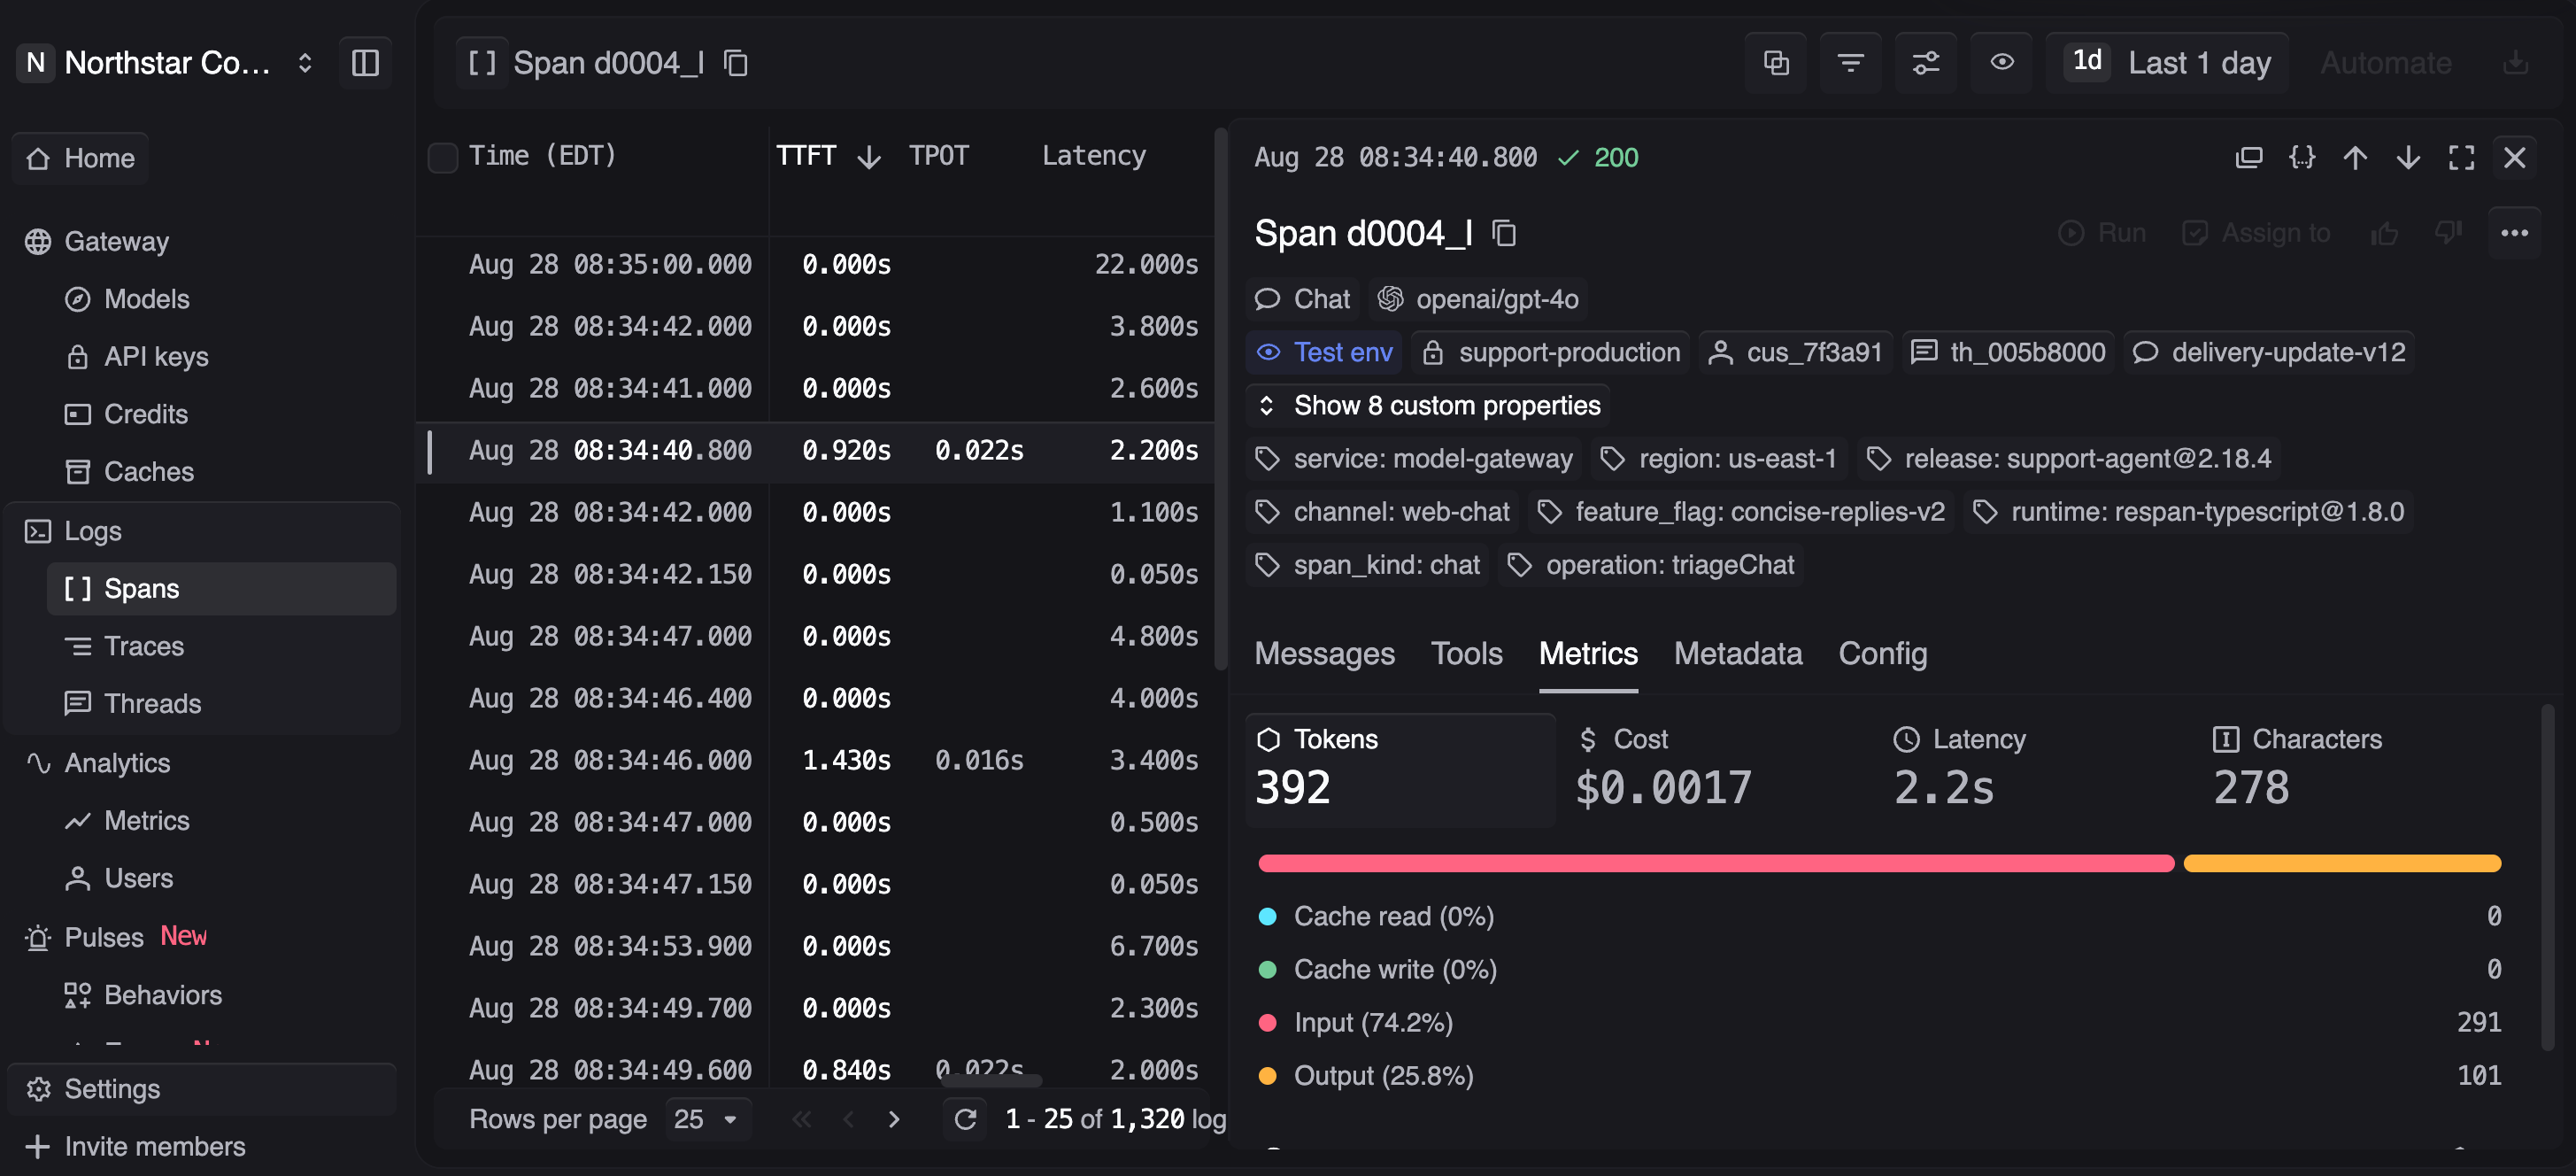
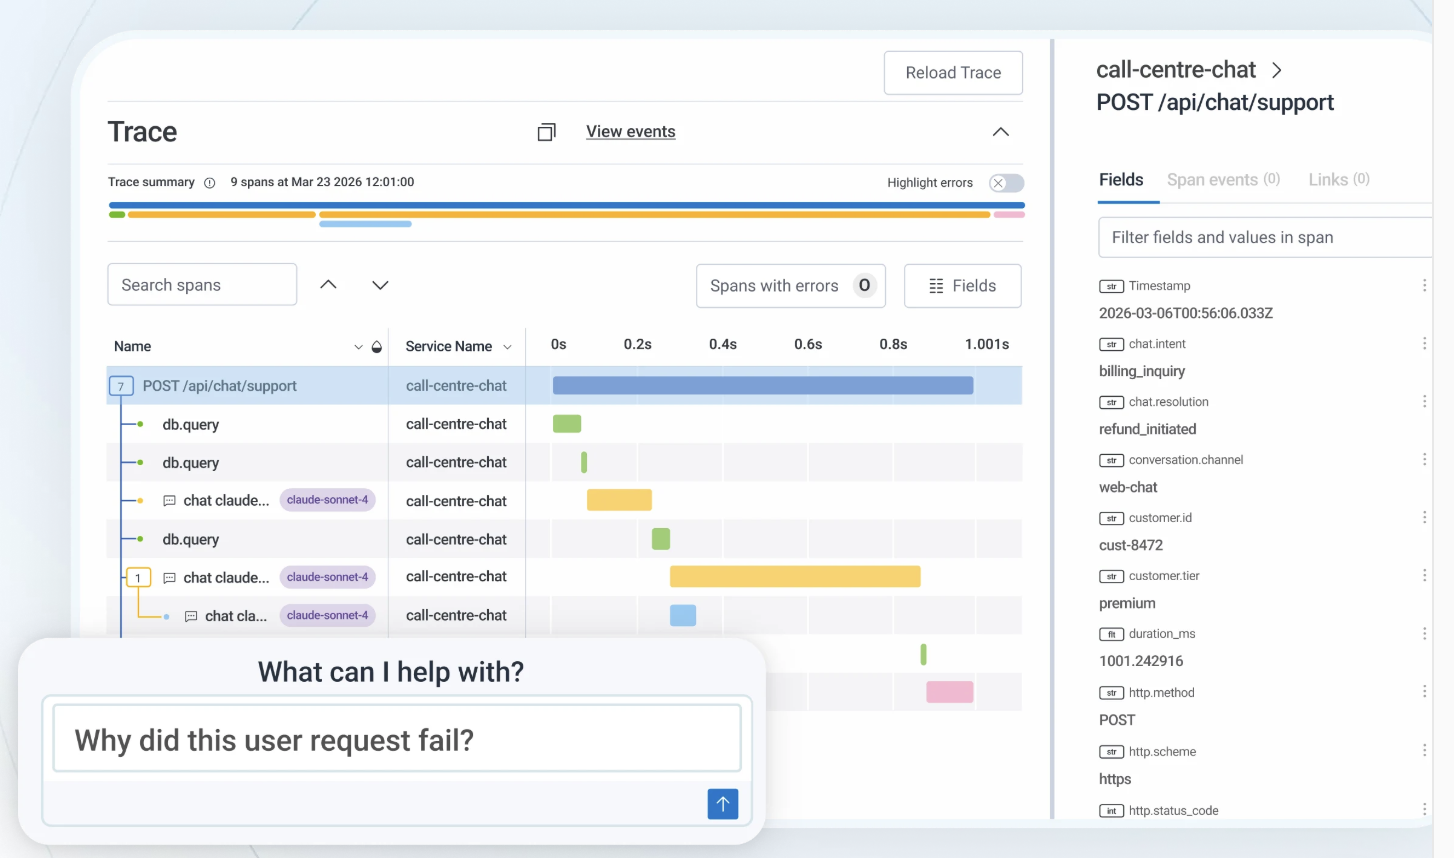
Respan reads the part of a span that a tracing backend stores as a tag. Every model call, tool run, retrieval, and agent turn arrives as a span with its prompt, output, latency, and cost attached, and an evaluator turns the output into a score that sits on the span next to the duration. Route, observe, and evaluate every LLM call from one platform.
It accepts OTLP over HTTP in JSON or Protobuf and maps GenAI, OpenLLMetry, and OpenInference attributes automatically, keeping everything else as queryable metadata. A Collector fanning out means the service spans keep going to whichever backend you pick from this list while the same stream reaches Respan for the model calls, with no second instrumentation project.
The score is also where the fix starts. A bad result in production becomes a dataset, that dataset runs against a new prompt version or a different model in an experiment, and the comparison tells you whether the change worked before it ships.
Pros:
See the whole conversation - Threads group multi-turn sessions so a bad answer on turn five traces back to context set on turn two.
Measure quality with scores - LLM judges, deterministic code checks, and human review compose into one evaluator, running offline or on sampled live traffic.
Know where every dollar goes - Cost breaks down by model, request, and end customer, with soft and hard spend caps per key, customer, or org.
Stay up when a provider fails - One endpoint reaches 1,000+ models at roughly 10ms added P95, with fallback chains you define, retries, and exact-match caching.
Ship prompt changes without redeploying - Prompts live as versioned templates outside application code and go live the moment you publish.
Hear about it before customers do - Monitors on cost, errors, latency, or tokens reach Slack, email, or a webhook the moment a threshold breaches.
Pass the security review - SOC 2, HIPAA with a BAA, GDPR, and ISO 27001, with PII masking and log omission available.
Cons: Retention runs only 7 days on the free plan.
Pricing: Free covers 100k logs, 1k scores, 7-day retention, and unlimited seats. Team is $199 per month billed yearly for 10k scores, 30-day retention, and unlimited datasets, evaluators, and prompts, with Enterprise adding SAML and a 99.99% SLA.
2. Grafana Tempo
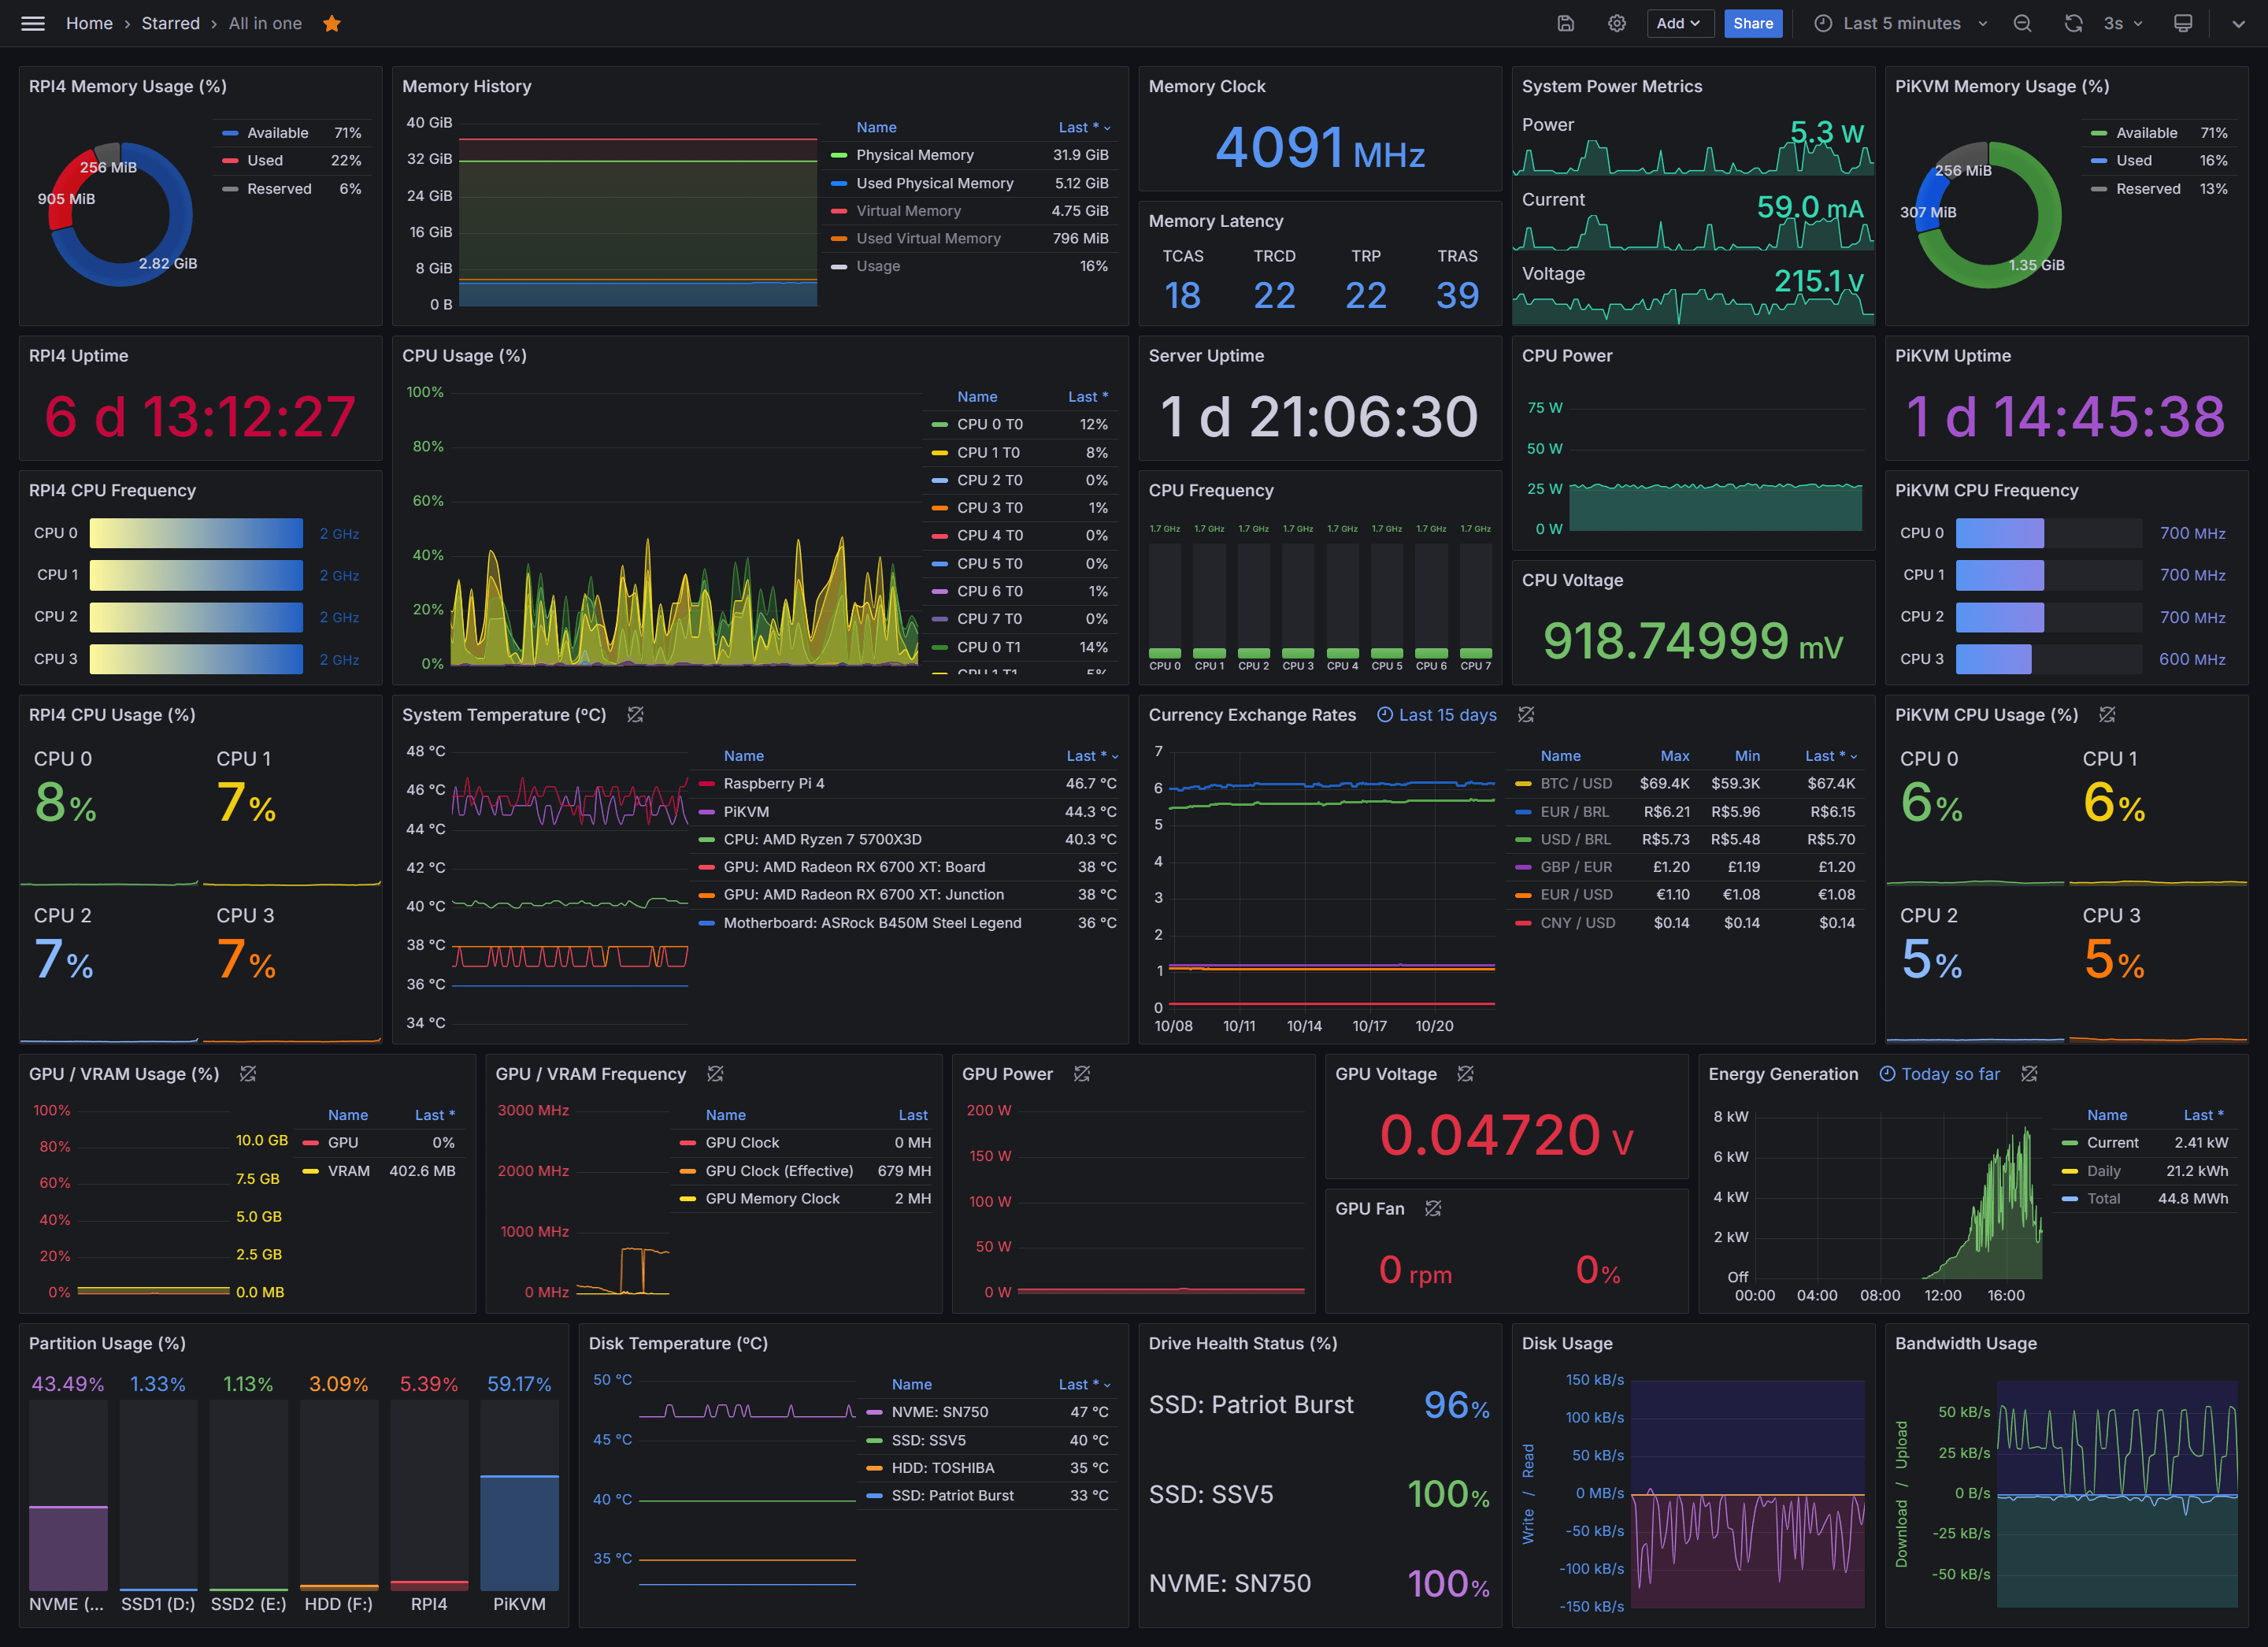
Grafana Tempo puts spans in object storage rather than in a database you operate, which is the clearest answer to the part of Jaeger that costs the most. S3 or GCS replaces the Cassandra or Elasticsearch cluster, and the storage bill tracks volume instead of tracking cluster capacity you provisioned in advance.
Search has moved on from the reputation. TraceQL selects traces on span and resource attributes, timing, and duration, with scoped lookups across span, resource, event, and link attributes, so the older characterization of Tempo as a trace-ID lookup service no longer holds.
What you take on is the rest of the stack. Tempo covers traces, and metrics and logs live in Mimir and Loki beside it, each answering to its own query language. Correlating a latency shift to a log line to a metric means PromQL, LogQL, and TraceQL rather than one search bar, and running the LGTM components is more moving parts than running Jaeger was.
Pros:
Object storage backend - No stateful database cluster to run, scale, or keep up during an incident.
TraceQL attribute search - Scoped queries on span and resource attributes with basic aggregates.
Exit guarantee - The components behind Grafana Cloud are the same Apache 2.0 components you can run yourself.
Cons: Traces only, so metrics and logs come from separate backends with separate query languages, and the operational surface is wider than a single tracing backend.
Pricing: Apache 2.0 and free to self-host, where the cost is object storage plus the compute behind the Tempo components. Grafana Cloud runs it as a managed backend alongside Mimir, Loki, and Pyroscope, billing each signal on its own meter.
3. SigNoz
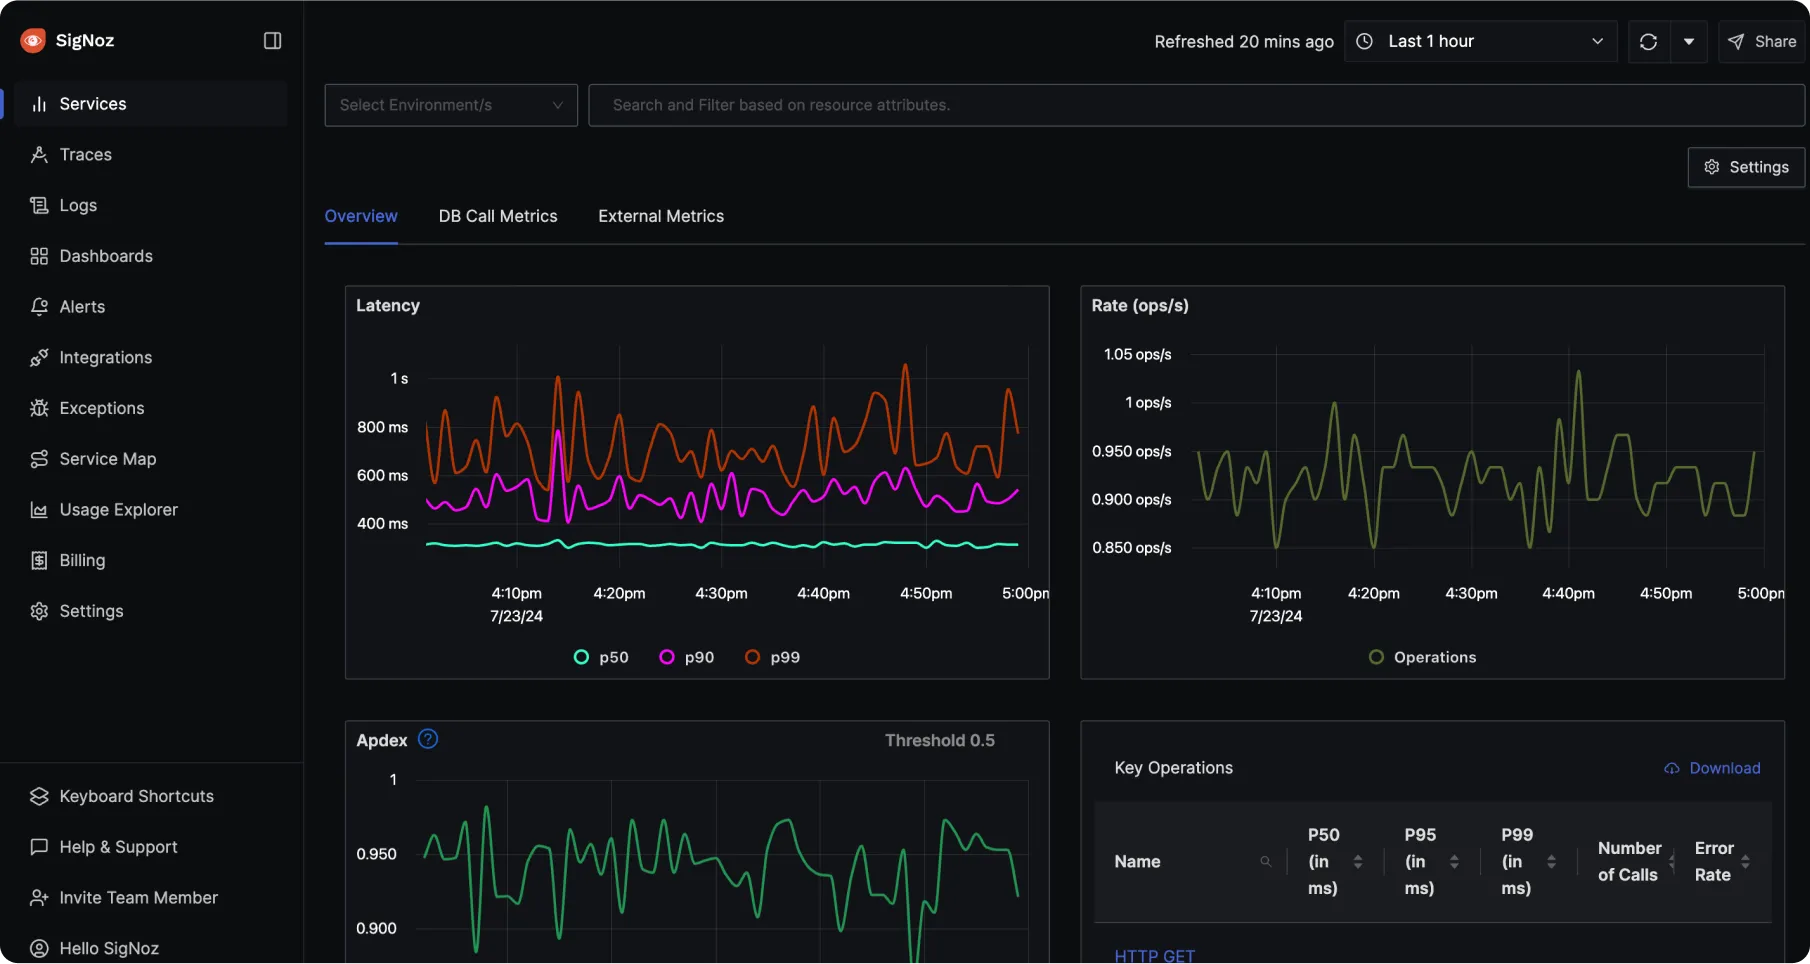
Data volume is the only thing SigNoz charges for. No per-host line, no per-seat line, and no premium for custom metrics, which removes the two meters that make an evaluation of the commercial suites difficult to forecast. Traces, metrics, and logs go into ClickHouse and come back out through one query interface, so the correlation Jaeger asks you to do by hand happens in the product.
It is OpenTelemetry-native end to end, which means instrumentation written against SigNoz points at any other OTLP backend later without a rewrite.
Free is a licensing statement rather than a cost statement. Self-hosting SigNoz means running and scaling a ClickHouse cluster and owning its uptime, and while that is a simpler proposition than operating Jaeger, Prometheus, and an ELK stack separately, it is still a database you depend on during an incident. On the cloud side, metrics bill per sample rather than per GB, so a high-cardinality metric with many dimensions moves the bill on a different axis than trace volume does and has to be modeled on its own.
Pros:
One meter - Data volume only, with no host, seat, or custom-metric charges.
All three signals - Traces, metrics, and logs correlated in a single query surface.
ClickHouse backend - Columnar storage built for analytical queries over large span volumes.
Cons: Default retention runs 15 days on logs and traces and one month on metrics, self-hosting means owning a ClickHouse cluster, and HIPAA with a BAA sits on Enterprise.
Pricing: Community Edition is free and self-hosted with no data caps. Teams Cloud starts at $49 per month including $49 of usage, roughly 163 GB of logs or traces, then $0.30 per GB and $0.10 per million metric samples, with Enterprise from $4,000.
4. Zipkin
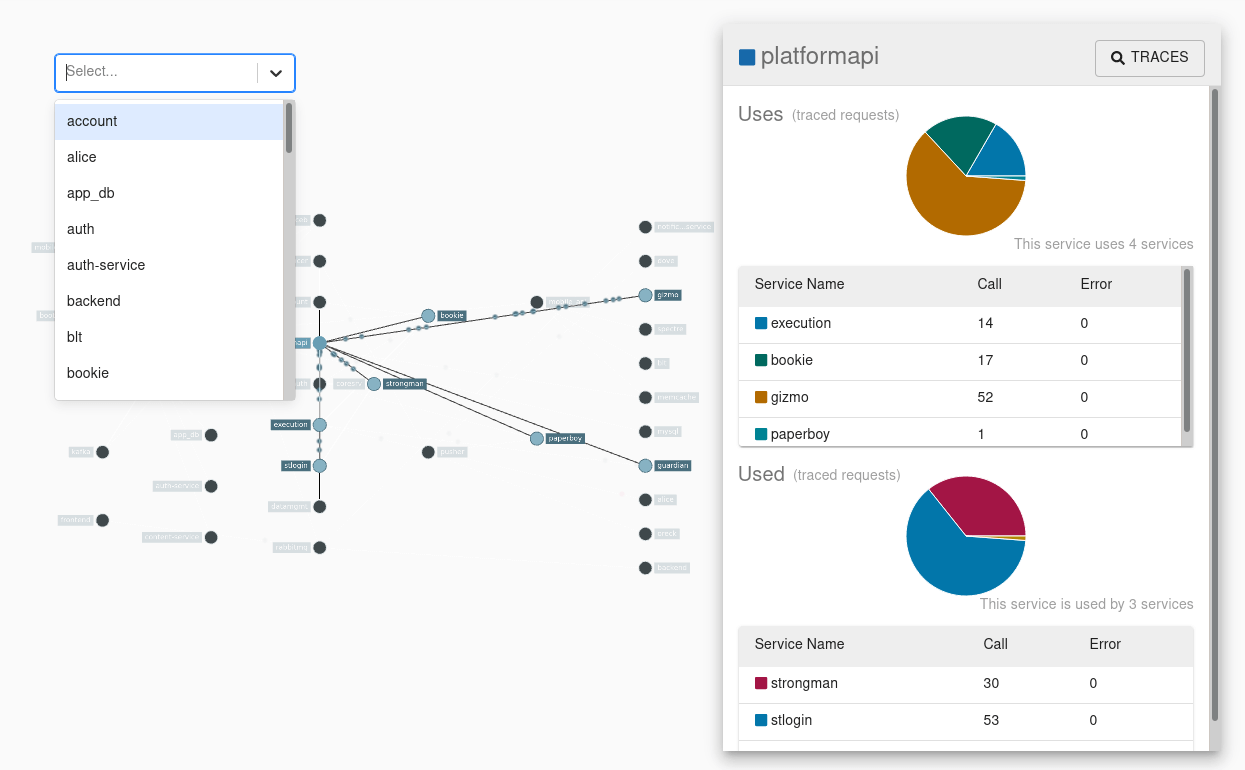
Zipkin is the other tracing system that came out of the same era, built at Twitter around the time Jaeger was being built at Uber, and the two share a scope. The server runs as a single executable jar or Docker image, and the UI searches by service, operation, tags, and duration alongside a dependency diagram of how traced requests move between applications.
OpenTelemetry now routes users toward it over OTLP. The project deprecated the Zipkin exporter specification in December 2025 in favor of Zipkin's OTLP ingestion support, with existing stable exporters patched until at least December 2026. The ingestion lives in the openzipkin-contrib zipkin-otel module rather than the core server, so getting OTLP into Zipkin means adding that module or taking a Collector hop, which is one more piece than the tools above need.
Pros:
Lightweight to run - Single jar or container, with a smaller footprint than a Jaeger deployment.
Long track record - Mature, stable, and extensively documented after more than a decade in production use.
Cons: OTLP arrives through a contrib module or a Collector rather than the core server, the scope stops at traces, and Cassandra and Elasticsearch deployments need a separate Spark job to aggregate dependency links.
Pricing: Apache 2.0 with no license cost. The spend is the storage cluster and the dependency-aggregation job beside it.
5. Uptrace
Pricing is where Uptrace separates from most of this list. Traces bill at $0.100 per GB, logs at the same rate, and metrics at $0.025 per million datapoints, with retention set independently per signal from one month to a year. There is no host count and no seat count in the calculation, so the bill tracks the telemetry you send and nothing else.
The product around it is deliberately narrow. Traces, metrics, and logs land in ClickHouse behind an interface built for ad hoc querying across high-cardinality attributes, with alerting on query conditions, and both SaaS and self-hosted deployments are available. The managed option removes the storage cluster without requiring you to adopt a larger platform around it.
The narrowness is the tradeoff. Enterprise access controls, security monitoring, and the breadth of integrations the large suites carry are not part of it, and it is a smaller project than SigNoz or Grafana with a correspondingly smaller community to lean on. Also worth modeling before committing: traces and logs meter at the same rate per GB, so spans carrying full prompts and outputs bill like log volume rather than like ordinary service spans.
Pros:
Predictable meter - Per-GB on traces and logs, per-datapoint on metrics, with nothing charged per host or per user.
Retention as a dial - Each signal keeps its own retention window from one month to a year.
Cons: A smaller project with a narrower feature set than the all-in-one platforms, and per-GB metering on traces means prompt-heavy spans are billed at log rates.
Pricing: Free to start with no card. Usage-based from there at $0.100 per GB for traces and logs and $0.025 per million metric datapoints, which puts 500 GB of traces, 200 GB of logs, and a billion metric datapoints at one-month retention around $95 per month.
6. Honeycomb
Wide structured events are the unit Honeycomb stores, and traces, logs, and metrics are derived from them rather than kept as separate signal types. The practical result is that any field on an event is queryable without anyone having decided in advance that the field would matter, which is what makes it strong on the outage that only affects one API version in one region on one platform.
That design rewards rich instrumentation. Attaching a tenant, a feature flag state, a model name, or a prompt version to every span costs you nothing in query performance, and BubbleUp will compare a slow or failing selection against the baseline and surface which attribute explains the difference.
Event metering is the thing to check before modeling cost, because a trace with 150 spans counts as 150 events and instrumentation granularity drives the bill in a way host counts never do. Agent runs make that worse rather than better, since a single request can produce dozens of spans across planning, retrieval, and tool calls.
Pros:
High-cardinality queries - Any field on an event is filterable without pre-built indexes.
Usable free tier - 20 million events and 100 million metric datapoints monthly, with tracing included.
Cons: Metering on events means a deep trace costs proportionally more, log search is thinner than what the search-based platforms offer, and Service Map and Private Cloud sit behind Enterprise.
Pricing: Free covers 20M events and 100M metric datapoints monthly with tracing, BubbleUp, and 2 triggers. Pro starts at $150 per month for 750M events and 3.75B datapoints with SSO and 2 SLOs, and Enterprise is custom.
7. Datadog
The argument for Datadog is that everything is already in it. APM, infrastructure metrics, logs, RUM, synthetics, and security sit behind one interface with first-party telemetry, so pivoting from a slow span to the host metrics underneath it and the logs that span emitted takes no wiring.
Cost is where it turns. Datadog meters hosts hourly, discards the top 1% of hours, and bills the month at the peak of what remains, so a five-day traffic spike sets the rate for all thirty days. In Kubernetes the billable unit is the node rather than the pod, and an agent misconfigured as a sidecar counts every pod as a host. Those details move a bill further than the headline rates do, which is worth keeping in mind while evaluating tools like Datadog.
LLM spans are handled in a separate product on a separate meter. Agent Observability accepts GenAI-convention spans over OTLP, through the Datadog Agent, or through a Collector, and evaluations attach to those spans through an API. So service tracing scales with host count while the AI side scales with span volume, and the two have to be forecast independently.
Pros:
Breadth in one place - Over a thousand integrations across infrastructure, APM, logs, RUM, and security.
Correlated by default - First-party telemetry means no manual joining between signals.
Mature tooling - Service maps, flame graphs, and anomaly detection that need no assembly.
Cons: Six separate meters make the bill hard to forecast, host billing penalizes autoscaling, the proprietary agent is the well-trodden path despite OTLP support, and code-level profiling sits on the top APM tier.
Pricing: APM runs $31, $35, and $40 per host per month, with Infrastructure a separate meter from $15 per host and logs at $0.10 per GB ingested plus $1.70 per million events indexed. Agent Observability is free to 40,000 LLM spans per month, then $160 per month for 100,000.
8. New Relic
Hosts, containers, and cloud functions are free on New Relic. It does not count them. What it counts is telemetry volume and how many engineers are allowed to look at it, which inverts the model that most other platforms use and makes it unusually easy to forecast for a team with steady headcount and variable traffic.
Seats are the constraint to check first. Standard caps at five full platform users, and the sixth engineer joining an on-call rotation forces the jump to Pro. Because the people who need to read a trace during an incident are exactly the people the meter counts, the cost model can work against the behavior tracing exists to enable, which is the tension behind the New Relic alternatives worth comparing against it.
Ingest is the other line to model. Spans carrying prompts and completions are large relative to ordinary service spans, so an application with meaningful AI traffic burns through the free 100 GB faster than its request count suggests. New Relic handles the AI layer in its own AI Observability product, reporting performance, reliability, and token usage on those calls.
Pros:
No host charges - Infrastructure, containers, and functions are all uncounted.
Real free tier - 100 GB of ingest, one full platform user, and unlimited basic users.
Full-stack coverage - Traces, logs, metrics, browser, and infrastructure under one platform.
Cons: Full platform seats cap at five on Standard before the jump to Pro, ingest is harder to forecast with prompt-heavy spans, and FedRAMP Moderate and HIPAA eligibility require Enterprise with Data Plus.
Pricing: Free covers 100 GB of ingest, one full platform user, and unlimited basic users. Full platform users run $10 for the first and $99 for each additional on Standard up to five, then $349 annually on Pro with no cap, with data at $0.40 per GB past the free allowance or $0.60 on Data Plus.
9. Elastic APM
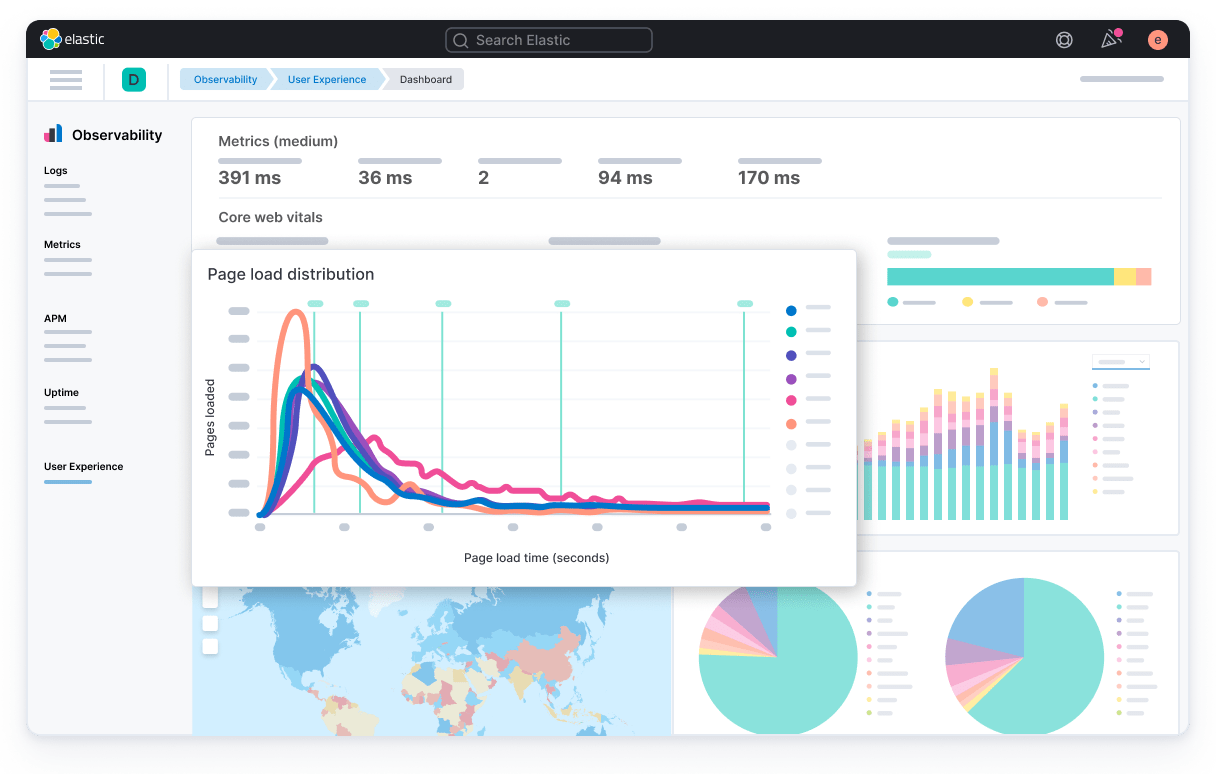
Ad hoc search is the workflow Elastic APM is built around, because traces land in the same Elasticsearch cluster as everything else you index and the query surface is the one your team already uses for logs. For an organization running the ELK stack, adding tracing is a configuration change rather than a procurement cycle, and the Elastic Distributions of OpenTelemetry keep the instrumentation portable.
That shared index is also what makes it good at the awkward middle of an investigation, where you have a slow span, a suspicion, and a log line that might or might not be related. Searching both in one place beats correlating by trace ID across two products.
One billing detail matters more than the headline rate. Elastic meters uncompressed data measured at the end of the ingest pipeline, before compression, so billed volume runs higher than both your raw source data and the resulting index and an estimate built from either comes in low. Traces also price at roughly four times metrics on ingest and retention, which puts a trace-heavy workload at the expensive end of the tier rather than at the advertised one.
Pros:
One index for everything - Traces sit beside logs and metrics in the same searchable cluster.
OTel distributions - Elastic's own OpenTelemetry builds keep instrumentation vendor-neutral.
Deployment range - Serverless, hosted, or fully self-managed.
Cons: Billing counts uncompressed volume at the end of the ingest pipeline, traces cost around four times metrics on both ingest and retention, and self-managed means owning shard management and cluster health.
Pricing: Serverless Logs Essentials is $0.07 per GB ingested and $0.017 retained. Complete adds traces, metrics, SLOs, and machine learning at $0.09 per GB for logs and traces against $0.023 for metrics, with retention at $0.019 and $0.005.
10. Apache SkyWalking
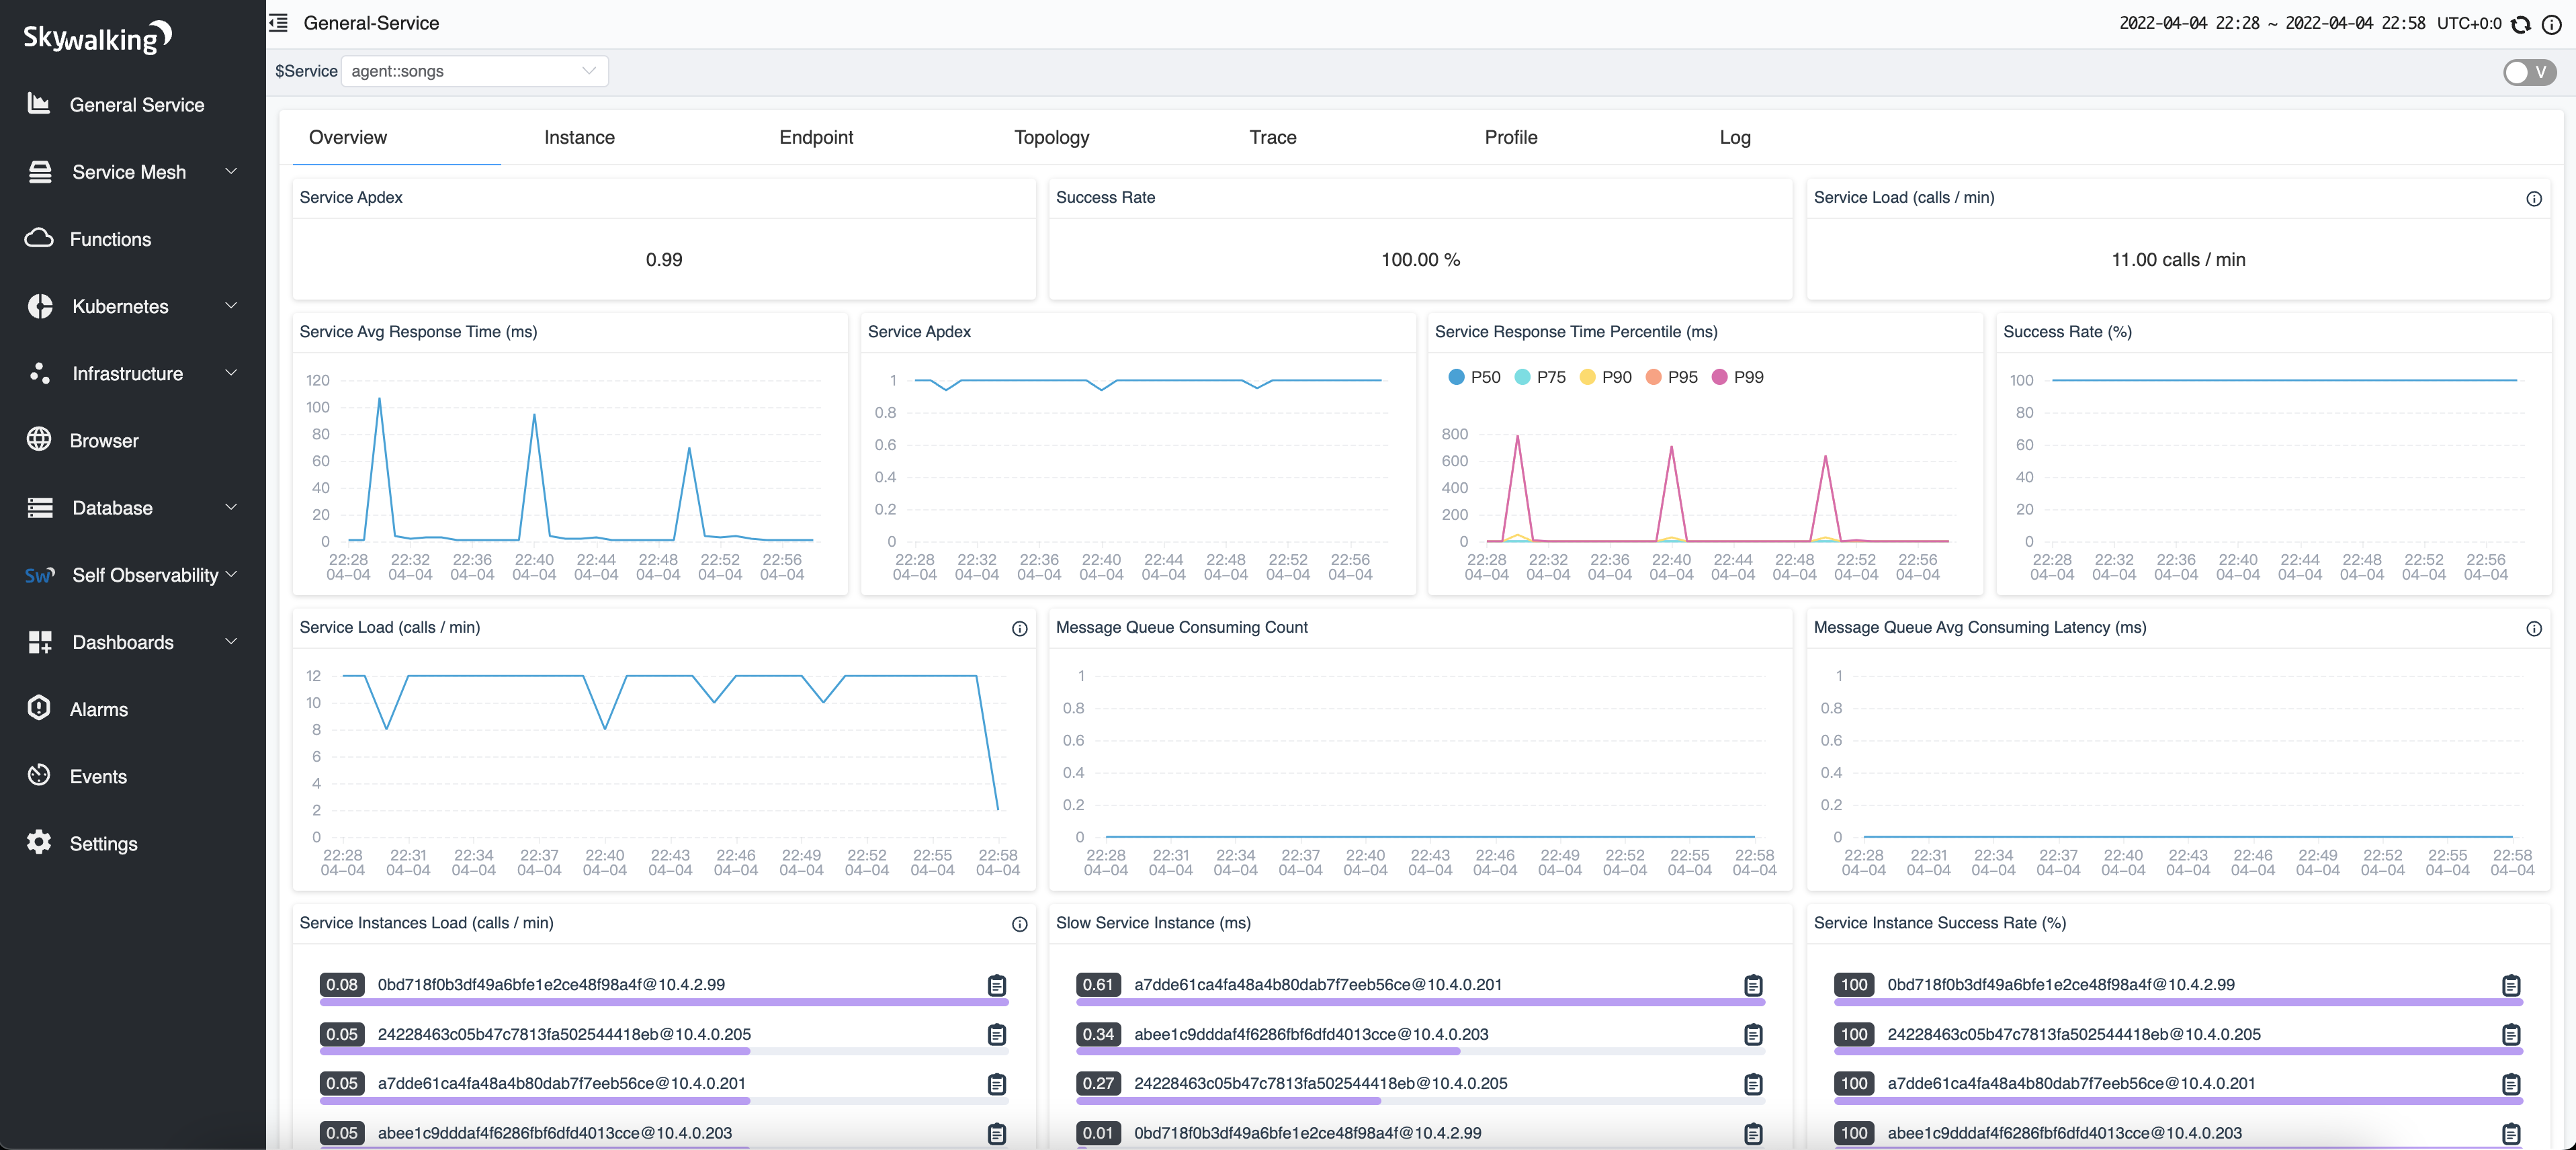
Apache SkyWalking is an open-source APM built for cloud-native and microservices environments, covering distributed tracing, metrics, service topology, and alerting in one server rather than across separate components. On paper that is a direct answer to the traces-only scope and missing alerting that send teams away from Jaeger, and it has been production-proven at scale for years.
Ingest is where it differs from everything above, and it is the reason it sits last here. SkyWalking's OTLP trace handler converts incoming OTLP spans to Zipkin trace format, and using it requires enabling both the Zipkin receiver and the Zipkin query in the server configuration.
That conversion is the thing to weigh. It works, and it means SkyWalking is the one option on this list where "point the endpoint somewhere else" understates the job, since custom attributes survive only as far as the Zipkin format carries them. SkyWalking's own agents are the better-supported path into it, which brings back the instrumentation lock-in that moving to OpenTelemetry was meant to end.
Pros:
Wide scope in one server - Tracing, metrics, topology, and alerting without assembling separate systems.
Apache 2.0 - No license cost and an established Apache Software Foundation governance model.
Cons: OTLP traces are converted to Zipkin format and need the Zipkin receiver and query enabled, native SkyWalking agents are the better-supported ingest path, and some query capabilities depend on which storage backend you run.
Pricing: Apache 2.0 with no license cost. The spend is the OAP server and whichever storage backend you choose to operate behind it.
Keep Jaeger. Add the layer it was never built for.
Respan reads the prompt, tool calls, cost, and eval score on every LLM span, then turns a bad score into a dataset and a tested fix. Fan out your existing OTLP stream and try Respan for free.
Yes, and since v2 it is the only supported way. Jaeger retired its own client libraries in favor of OpenTelemetry SDKs, and the v2 backend receives OTLP natively on ports 4317 for gRPC and 4318 for HTTP. You instrument with OpenTelemetry, export over OTLP, and Jaeger is one of several backends that can receive that stream.
Because the backend is swappable, the same instrumentation feeds more than one destination. A Collector can send service spans to Jaeger and route the same stream to Respan, which maps GenAI, OpenLLMetry, and OpenInference attributes to model, token, input, and output fields and scores the result, so the model calls get a view organized around them without the rest of your tracing setup changing.
Jaeger vs Zipkin: which should you use?
They solve the same problem and came out of the same period, so the choice is closer than the comparison suggests. Jaeger v2 has the more modern architecture, running on the OpenTelemetry Collector framework with native OTLP ingest and no extra module required. Zipkin is lighter to stand up and run, and its OTLP support arrives through the openzipkin-contrib zipkin-otel module or a Collector hop rather than through the core server.
If you are already on Jaeger and considering Zipkin, the more useful question is what problem you are trying to solve. Both are traces-only backends with an external storage cluster and no built-in alerting, so moving between them changes the operational details without changing the scope. If the gap you are trying to close is what the spans themselves carry, Respan reads the prompt, cost, and output on a model call and scores it, and it runs alongside either one from the same Collector.
Do you have to replace Jaeger to add another tracing backend?
No. The OpenTelemetry Collector can export the same spans to more than one destination, so a fan-out configuration sends service spans to Jaeger and the same stream to a second backend. Nothing in the application changes, and the SDKs stay exactly as they are.
This is usually the cheaper move when the gap is specific rather than general. If Jaeger covers your microservice tracing and what you need is a view of the model calls with prompts, cost, and quality scores attached, adding that layer is a Collector config change rather than a migration.
What does a Jaeger alternative cost to run?
Less than the Jaeger deployment it replaces, in most cases, because the storage cluster is usually the largest line and several options remove it. Respan starts free with 100k logs, 1k scores, 7-day retention, and unlimited seats, with Team at $199 per month billed yearly, and there is no cluster to run behind either tier. Tempo, Zipkin, and SkyWalking carry no license fee and move the cost into object storage or a database plus the engineering hours to operate it, which land on whoever is already on call.
On the commercial side the meter matters more than the rate, because the same traffic produces very different bills depending on what gets counted. Datadog charges per host with APM from $31 and infrastructure as a separate line. New Relic charges nothing for hosts and instead counts ingest and full platform seats. Honeycomb counts events, so a trace with 150 spans costs 150 times one span. Uptrace and SigNoz count gigabytes, and Elastic counts uncompressed gigabytes measured before compression.
Model whichever meter you choose against twelve months of growth, and check what happens to it when spans start carrying prompts and outputs, since those are considerably larger than ordinary service spans.