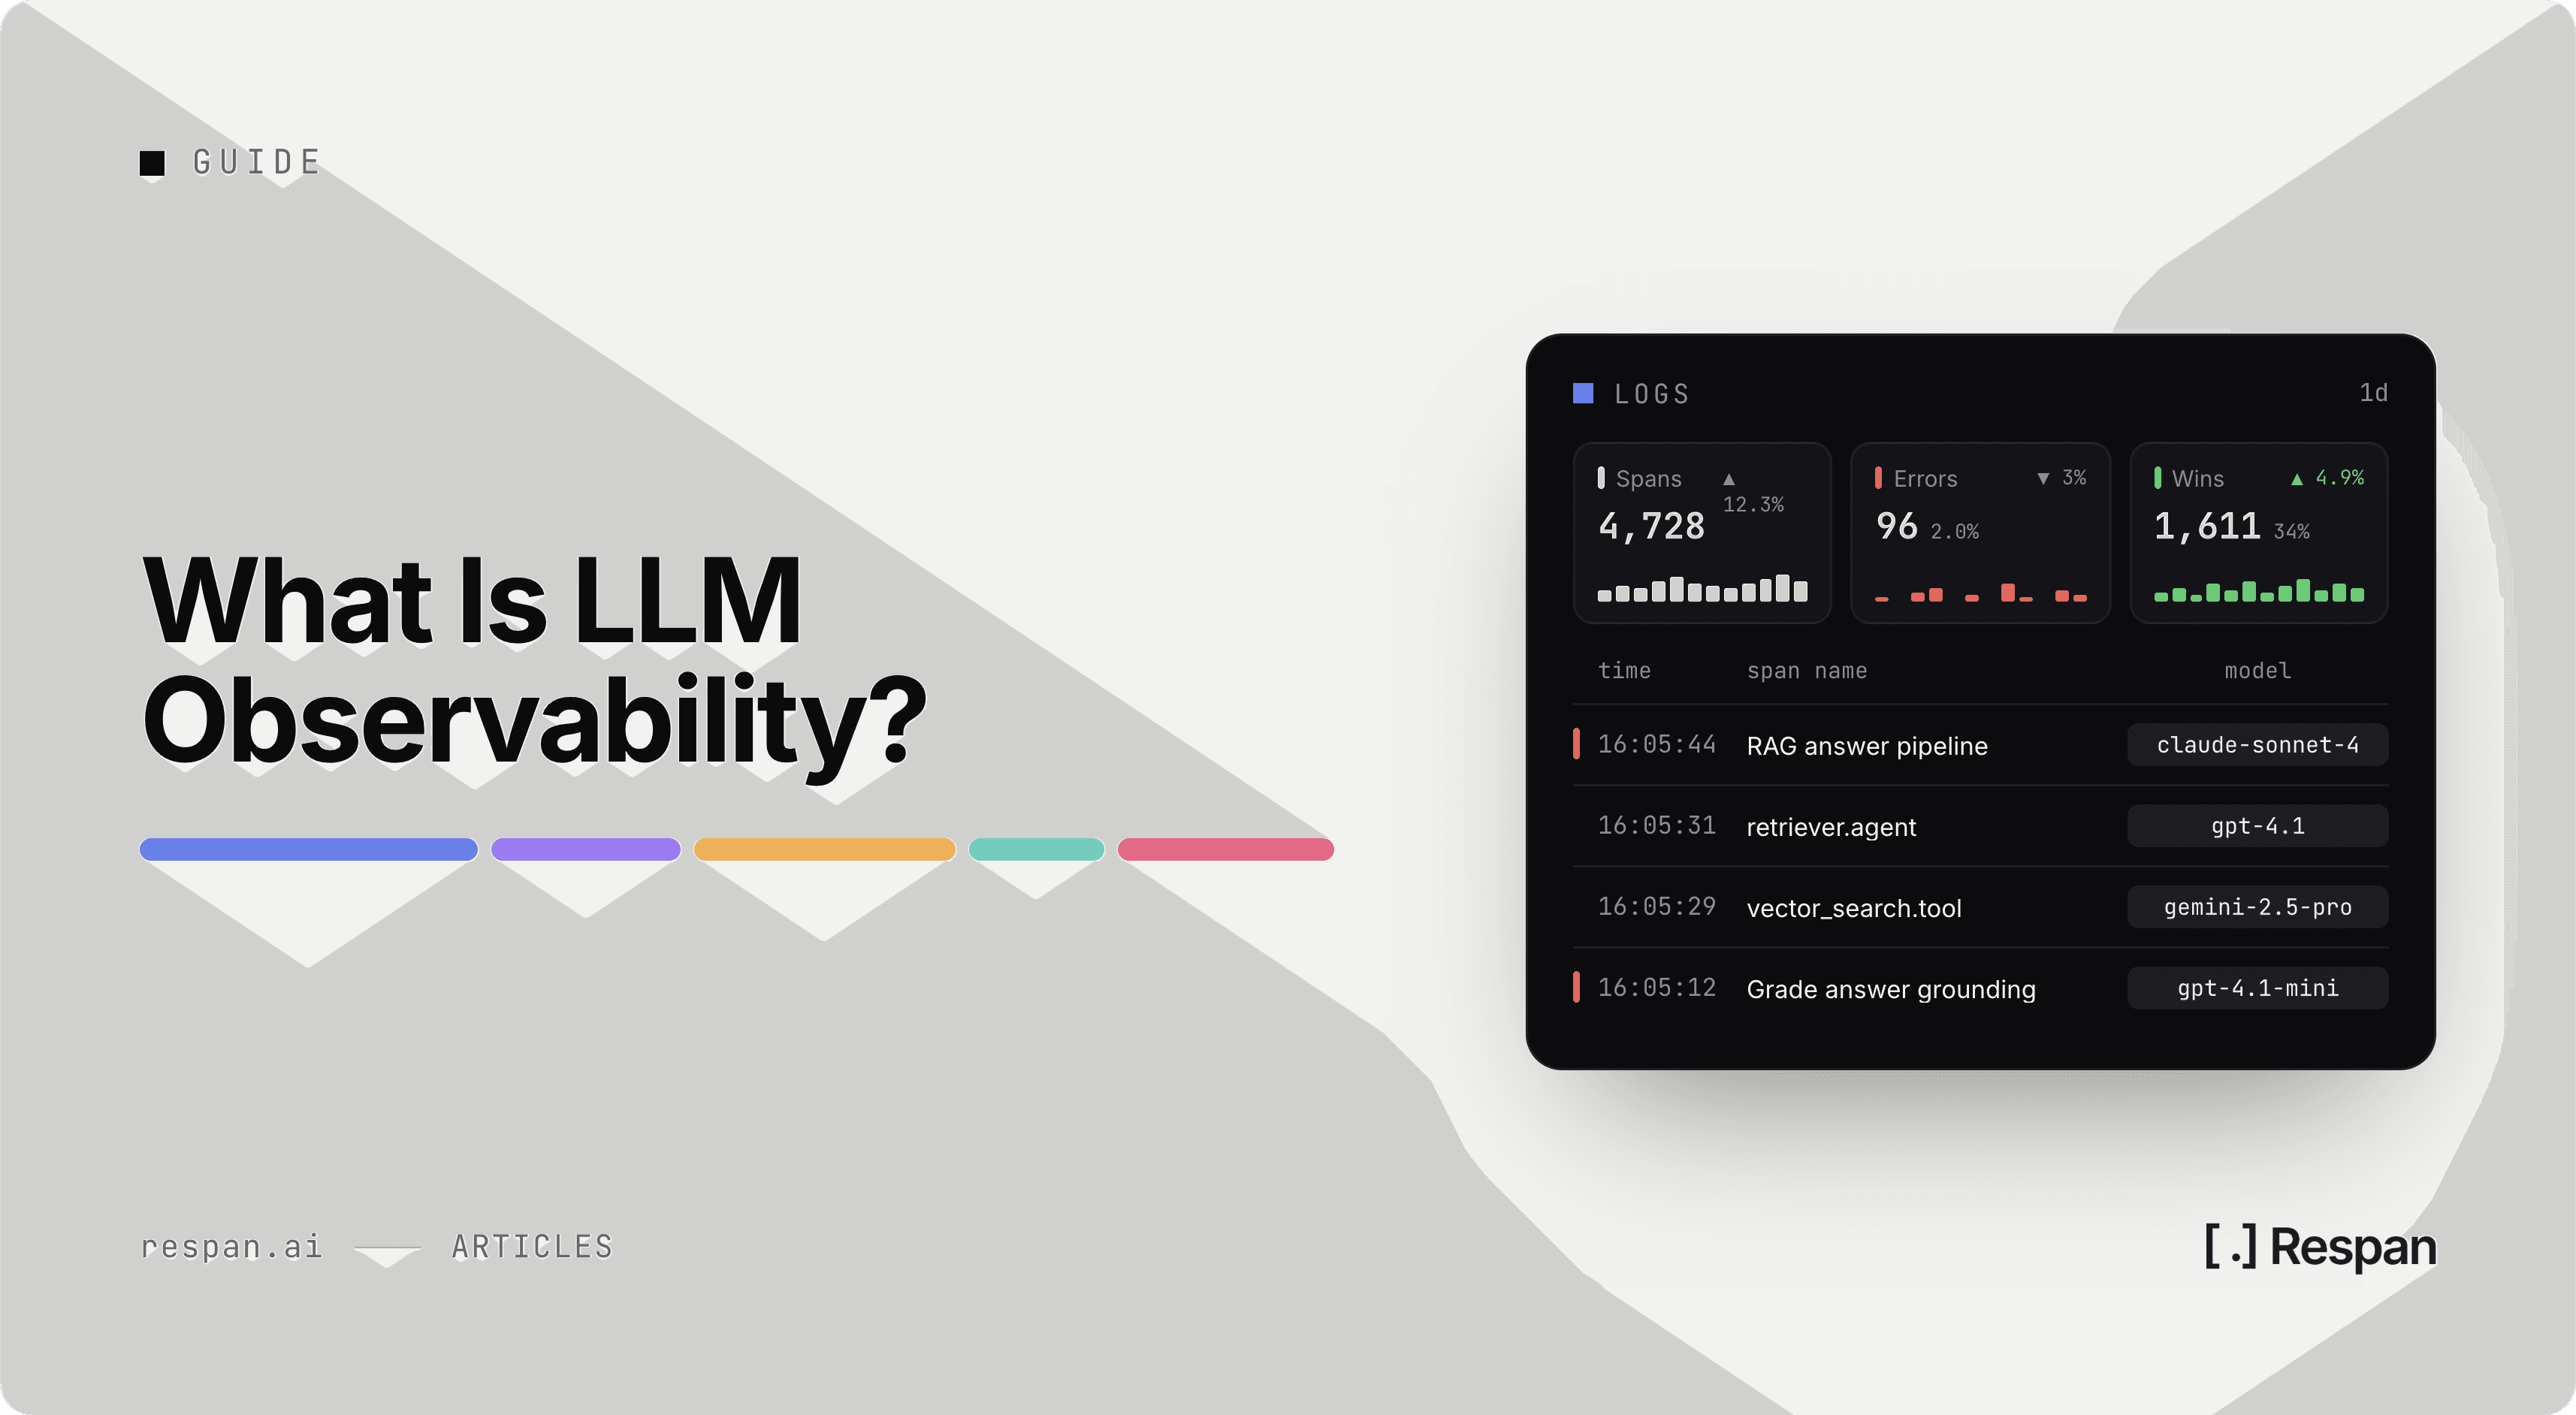
Most LLM apps start out with a few print statements and a provider dashboard. That holds up until a user reports a bad answer and nobody can say which prompt version produced it or which model served it, and the question developers end up asking is some version of "why did it say that?"
That gap gets more expensive as an app adds retrieval, tool calls, and more than one model provider, because each one is another place a request can go wrong without throwing an error.
The fix is to treat every LLM call as something worth keeping a full record of, so the answer to "why" is already sitting there when you need it.
Below is what LLM observability is, the key metrics to track, and the best practices for setting it up.
What Is LLM Observability?
LLM observability is the practice of recording what every LLM call in your application did, from the prompt and context that went in to the completion that came out, along with its latency, its cost, and a score for whether the output was right.
Where traditional observability asks whether a service is healthy, LLM observability asks whether a specific response was correct and why it came out the way it did. The useful unit is the individual call. Each one should carry the prompt and the version it came from, the model it was routed to, the tokens and cost it used, any retrieved documents or tool results it saw, and the eval score attached to its output, so a bad answer leads straight to its cause instead of to a search across several tools.
LLM Observability Example
For example, take a text-to-SQL feature that answers analytics questions in plain English. A user reports that last quarter's revenue number looks wrong, even though the query ran without an error. The call-level data for that request shows what happened:
- Prompt version - The request used v14 of the system prompt, which a teammate edited the day before and which dropped the instruction to exclude refunded orders.
- Model - The router sent it to the same model as always, which rules the model out as the cause.
- Retrieved context - The schema snippet pulled into the prompt was current and included the refunds table.
- Eval score - A code check that compares totals against a reference query had already flagged a drop in pass rate the morning after v14 shipped.
Without that data, the investigation starts with rerunning the question and hoping it fails the same way. With it, the fix is rolling back one prompt version.
Why LLM Observability Matters
LLM apps fail in ways traditional monitoring wasn't designed to see, and a few properties make that harder:
- Non-deterministic output - The same prompt can return a different answer on every run, so replaying the input rarely reproduces the bug. You need the record of what actually happened.
- Failures that look like successes - A hallucinated citation or an ignored instruction comes back with the same status code and latency as a good answer, and only the content is wrong.
- Mixed intent behind one endpoint - A single chat endpoint can handle summaries, lookups, and code questions, and a prompt change can improve one of them while quietly breaking another.
- Cost that moves without breaking anything - A longer system prompt or a model swap can raise spend per request well before anyone looks at the invoice.
Each of those is a reason to capture the full call rather than a summary of it, since the details that explain a failure are the ones aggregate metrics throw away.
Core Components of LLM Observability
LLM observability comes together from a handful of capabilities that all work on the same call-level data, and each one answers a different question about a request.
Tracing
Tracing captures each request as a tree of spans: the prompt that was built, the documents retrieved, the model call, and any tool invocations, each with its own inputs, outputs, and timing. A single chat completion might be one span and a chain with retrieval and tools might be a dozen, but in both cases the trace shows the context the model actually had, and LLM tracing is the instrumentation layer that captures it.
Evaluations
An evaluation turns "was this answer any good" into a score. Code checks handle what's mechanical, such as whether the output parsed or included required fields, an LLM judge scores what needs judgment, such as relevance or whether the answer is supported by the retrieved context, and human reviewers settle the cases neither can. The same evaluator should run on a test dataset before a change ships and on sampled production traffic after it, which is the core idea behind LLM evaluation in production.
Cost and Token Tracking
Every call has a price that maps directly to a line on an invoice. Recording input and output tokens per call, then rolling them up by model, feature, and customer, shows which part of the product drives spend and which change made it move. Without that attribution, a cost increase shows up as a bigger monthly bill with no way to trace it back.
Prompt Versioning
Prompts change more often than code, and a prompt edit can shift output quality as much as a model swap. Versioning prompts outside the codebase, as prompt versioning tools do, and tagging every trace with the version that produced it lets you compare versions on real traffic and roll back without a deploy.
Monitoring and Alerts
Monitoring watches the numbers that come out of all of this, such as error rate, latency, token volume, cost, and eval scores, and alerts when one crosses a threshold. Which of those to alert on, and at what level, depends on your traffic, and LLM monitoring works through the production metrics worth alerting on. What observability adds is the path from an alert back to the calls that caused it.
Key LLM Observability Metrics
Once instrumentation is in place, these are the numbers worth tracking, grouped by the question each one answers.
Performance Metrics
Performance metrics tell you whether the app is fast enough and where the time goes:
- Time to first token - The delay before a streamed response starts appearing, which is the latency users notice first, and measuring TTFT in production means timing it per request rather than as an average.
- Total latency by percentile - p95 and p99 rather than averages, broken down by model so one slow provider doesn't hide in a blended number.
- Output tokens per second - Generation speed, which tells you whether latency comes from a slow model or a long answer.
- Error, timeout, and rate-limit rates - Split by provider, along with how often requests fell back to another model.
Quality Metrics
Quality metrics tell you whether the output was any good, which is the part performance numbers can't show:
- Eval pass rate by prompt version - Tracked per release, so a regression shows up as a drop tied to a specific change.
- Groundedness - Whether answers are supported by the documents retrieved for them, which is the central signal in RAG observability.
- Refusal and format-failure rate - How often the model declines a valid request or returns output your code can't parse.
- User feedback - Explicit ratings plus implicit signals like regenerations, edits, and abandoned sessions.
Cost Metrics
Cost metrics tell you where spend goes and what's driving it:
- Tokens per request - Input and output tracked separately, along with context length, since growing conversation history quietly inflates input tokens.
- Cost per feature and per customer - The breakdown that shows which parts of the product are profitable and which customers drive spend.
- Cache hit rate - The share of exact repeat requests served from cache instead of the model.
Performance and cost metrics come out of almost any instrumentation. Quality metrics need evaluations behind them, and they're the group that tells you whether the app is actually working.
LLM Observability vs AI Observability
The two terms often get used interchangeably, but they describe different scopes. LLM observability works at the level of the individual model call: the prompt, the completion, the tokens, and the score attached to that output. AI observability covers the system around those calls, including agents that chain many of them together, the data and infrastructure underneath, and the governance around what gets stored.
In practice you need both levels, because diagnosing a failure in a larger system usually ends at a single call. A multi-step workflow that went wrong is investigated by opening its trace and reading the individual LLM calls inside it, so the system-level view of AI observability depends on the call-level data being captured.
How to Add Observability to Your LLM App
Setting up LLM observability takes four steps, and each one builds on what the previous step captures:
- Instrument every call - Route model calls through a gateway or wrap your clients with an SDK, so each request becomes a span with its prompt, completion, tokens, latency, and cost. If you already use OpenTelemetry, send spans over OTLP instead of adding a second SDK.
- Tag requests so you can slice them - Attach a customer ID, feature, environment, and prompt version to each request. Breakdowns by model, user, and API key are what turn a cost total into an answer about which feature drove it.
- Score outputs on real traffic - Build a dataset from production requests and run your evaluators against it before you ship a change, then run the same evaluators on sampled live traffic so wrong-but-successful responses get caught.
- Set monitors on what matters - Put thresholds on error rate, latency, tokens, and cost, route alerts to where your team already works, and keep a saved view next to each monitor so the logs behind a breach are one filter away.
Each step makes the next one more useful: tags make monitors specific, and scores turn the trace from a log of what happened into a judgment of whether it was right.
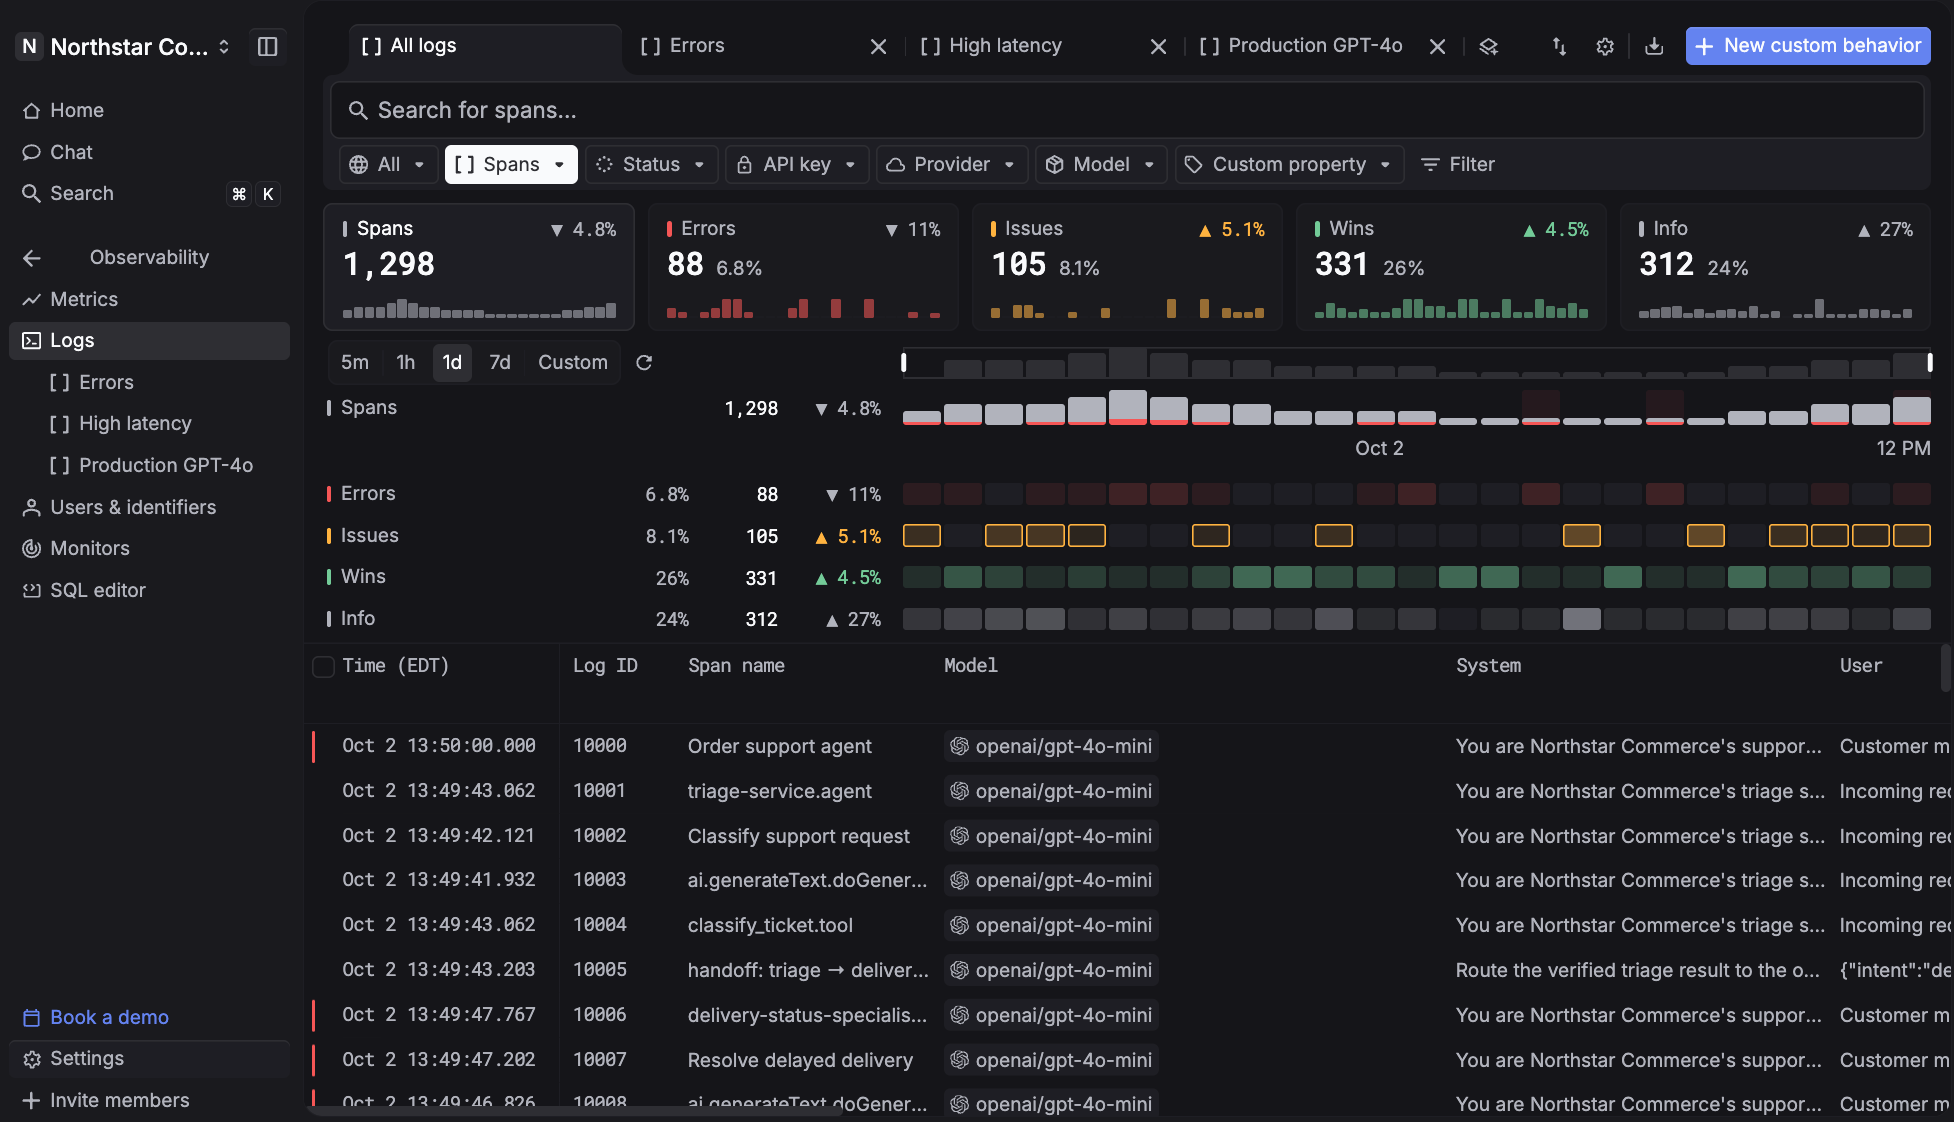
Respan covers all four steps on one platform. Route, observe, and evaluate every LLM call: requests that go through the AI gateway are logged as spans automatically with latency and cost attached, and the same record carries the prompt version, the scores, and the monitors watching it. Instead of reading logs after the fact, use Respan to run observability in production, know when production shifts, and act before it spreads.
- Instrument once - Route through the gateway to 1,000+ models, add tracing to the OpenAI SDK in a few lines, or send spans over OTLP.
- Keep conversations together - Threads group multi-turn sessions, so a conversation reads as one session instead of a string of disconnected requests.
- Score with the same evaluators everywhere - LLM judges, code checks, and human review compose into one evaluator that runs on datasets before release and on sampled production spans after.
- See where the money goes - Cost broken down by model, request, and end customer, with soft warnings and hard limits per key or customer.
- Hear about it first - Monitors on request count, errors, tokens, cost, or latency alert Slack, Microsoft Teams, email, or a webhook, with the top users, API keys, and models behind each breach.
- Ship prompt changes without a deploy - Versioned prompts go live when you publish, and every trace records the version that served it.
LLM Observability Best Practices
The setup above gets the record in place. These practices keep it useful as the app and its traffic grow:
- Instrument while you're still building - Tracing added during development means the first production incident already has a record behind it, instead of starting the investigation from scratch.
- Version everything that changes output - Tag traces with prompt version, model, and configuration, so any shift in quality maps to a specific change rather than a guess.
- Sample evals on high-volume traffic - Running an LLM judge on every request adds real cost, so score a sample and raise the rate on features where a wrong answer matters more.
- Keep sensitive data out of the record - Prompts and completions carry user data, so mask identifiers at ingest and keep retention to what debugging and audits actually need.
- Turn production failures into test cases - When a bad output turns up, add it to an eval dataset so the same regression gets caught before the next release.
- Break latency and cost down by model - Blended numbers let one slow or expensive provider hide behind the others.
Most of these come down to the same habit, which is making sure every call leaves a record specific enough to explain itself later.
FAQ
What Are the Best LLM Observability Tools?
The best LLM observability tool traces every call, scores output on real traffic, and attributes cost without making you stitch tools together. Respan does that with routing built in, so the model that served each request is part of the same record. The wider field of LLM observability tools runs from hosted platforms like LangSmith to open-source options like Langfuse and Arize Phoenix, and they differ mainly in how you instrument and what you end up running yourself.
What Is the Difference Between LLM Observability and LLM Monitoring?
LLM monitoring watches predefined numbers, such as error rate, latency, cost, and eval scores, and alerts when one crosses a threshold. LLM observability is the broader ability to investigate any call after the fact, including failures nobody set a threshold for, so monitoring tells you something changed and observability tells you why. It's the same distinction as general observability vs monitoring, applied to model calls.
Do You Need LLM Observability If You Already Have APM?
Usually, yes. APM tracks the health of your services, such as latency, errors, and throughput, but it treats a model's response as an opaque payload, so it can't tell you whether an answer was correct, which prompt version produced it, or why it cost more than yesterday. A common setup is to keep APM for infrastructure and add LLM observability for the content and cost of model calls.