When an LLM bill doubles, the invoice tells you which provider and model got more expensive. It doesn't tell you which agent, feature, or customer caused the increase, and that's the information you need to do anything about it.
The gap widens once agents run in production. One user action can turn into a dozen model calls, retries and tool steps add tokens nobody estimated, and spend ends up split across several providers' consoles, each showing its own slice.
Cost tracking closes that gap by tying every call to the work that caused it, accurately enough to set budgets and act before the month closes.
Below are the LLM cost tracking tools worth comparing, the metrics they track, and the best practices for monitoring spend in production.
What is LLM cost tracking?
LLM cost tracking is the practice of recording the token usage and cost of every LLM call and attributing it to the request, agent run, user, feature, or customer that caused it, so teams can see what drives spend, set budgets, and catch increases before the invoice arrives.
Provider dashboards cover part of this. They show what you spent per model, project, or API key, which is enough while one app calls one provider. However, they can't see your user IDs, your feature names, or which step of an agent run made a given call, because that context only exists inside your application. Cost tracking captures it at the moment of the call, either in your code or in a gateway the call passes through.
What causes LLM costs to increase?
LLM spend rarely grows in step with traffic, and most of the reasons stay hidden on a provider dashboard because they show up as more tokens on a model line rather than as a cause:
- Agent loops, retries, and failed calls - One user task can trigger many model calls as an agent plans, calls tools, and reads results. A retry after a timeout or a parse failure pays for the request twice, and without per-run attribution all of it lands in one model's total.
- Context that grows over a session - Chat APIs resend the conversation history on each turn, so the cost per request climbs as a session gets longer even when the request count looks flat.
- Reasoning, cached, and tool-call tokens - Reasoning models bill their thinking as output tokens, and prompt caching discounts cache reads while charging more for cache writes on some providers. A tracker that only counts input and output tokens will misprice all of these.
- Model upgrades and provider price changes - Moving to a new model version can change the rate per token, and rates differ between providers for similar tiers, as an OpenAI vs Anthropic pricing comparison shows. A tracker with a stale price table keeps reporting the old rate.
- Spend split across teams, keys, and providers - When each team holds its own keys and accounts, no single console shows the whole bill, and nobody owns the total.
Tracking is what tells you which of these is behind an increase. Cutting the cost once you've found it is a separate job, and the tactics for that are covered in LLM cost optimization.
Best LLM cost tracking tools
Cost tracking tools sit at one of two points in the request path, and that position decides how far down they can attribute spend.
An LLM gateway sits between your code and the providers, so it sees every call, prices it as the response comes back, and can refuse a request that would push past a budget. A tool built on LLM tracing records calls from inside your application instead, which lets it attach cost to the agent step that made each call, though it only sees what you instrument and can alert on spend without stopping it.
The comparison that matters is how far down each tool attributes cost (request, agent step, user or customer) and whether it can act on what it finds with alerts or hard budgets.
| Tool | Layer | Deepest cost attribution | Alerts or budgets | Starting price |
|---|---|---|---|---|
| Respan | Gateway with built-in tracing | Customer, span in trace | Monitors, key and customer caps | Free; Team $199/mo billed yearly |
| LiteLLM | Self-hosted gateway | Key, team, end user | Hard and soft budgets | Free (open source) |
| Langfuse | Tracing | User, session, tag | Cost alerts | Free; Core $29/mo |
| LangSmith | Tracing, beta gateway | Child run in trace | Alerts; gateway caps (beta) | Free; Plus $39/seat/mo |
| Datadog Agent Observability | APM add-on | LLM span, bounded tags | Cost monitors | Free; Pro $160/mo |
If you're short on time, the choice usually comes down to what you need and what you already run:
- Attribution and spend caps in one place - Respan, since cost per request, per agent step, and per customer feed the same monitors and limits.
- Budgets in a gateway you host - LiteLLM, if you're comfortable running the proxy and its database.
- A LangChain or LangGraph stack - LangSmith, for cost inside the trace tree you already debug with.
- Open-source tracing with prices you configure - Langfuse, paired with a gateway for spend limits.
- Services already on Datadog APM - Datadog Agent Observability, for LLM spend next to infrastructure metrics.
Each of those picks comes with its own setup and limits, which the sections below go through tool by tool.
1. Respan
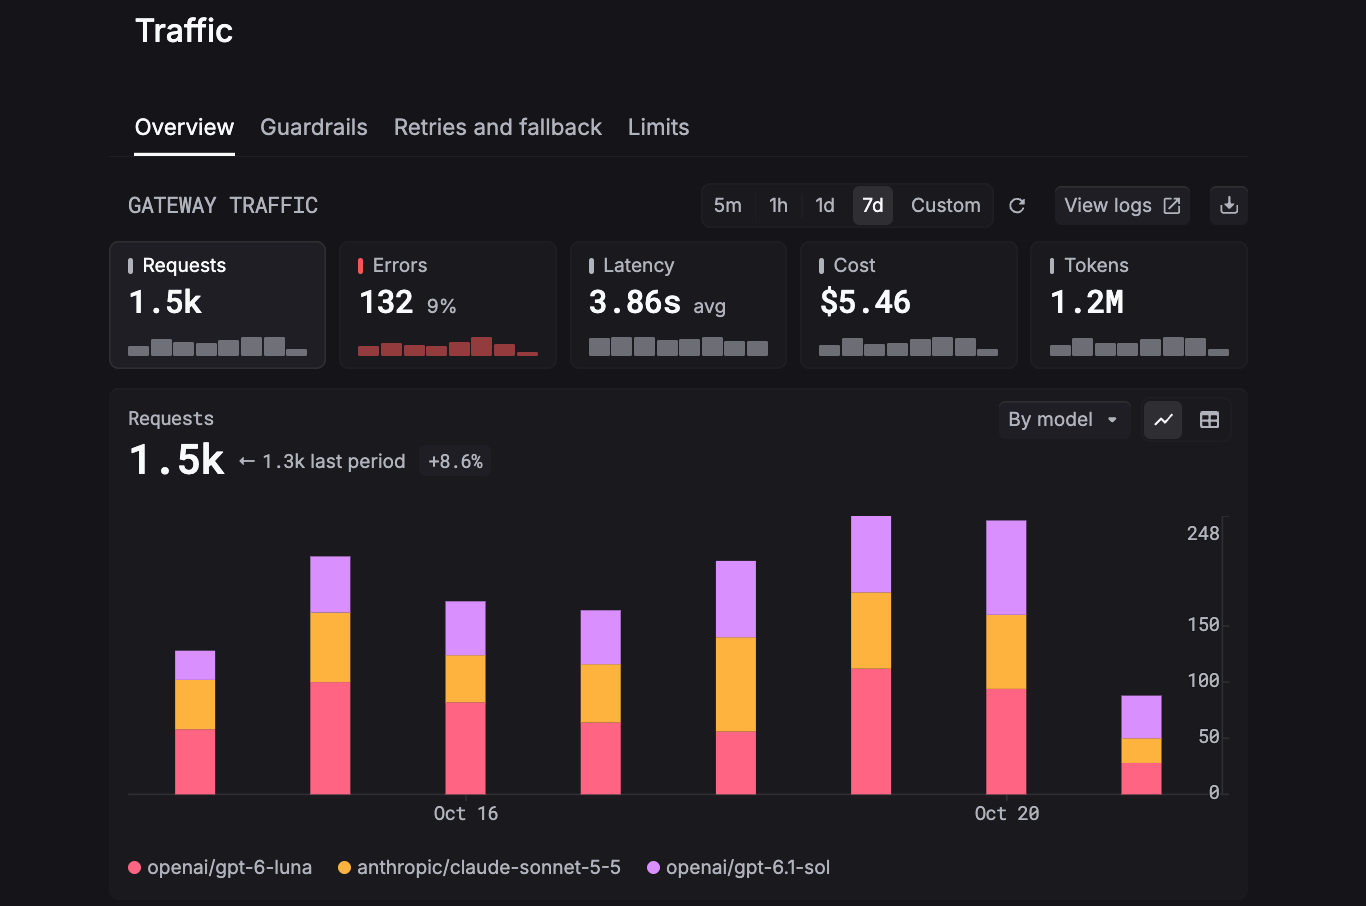
Every call through Respan's AI gateway, one API for 1,000+ models, is logged as a span with its tokens, latency, and cost attached, whether it runs on Respan credits or your own provider keys. Setup starts with pointing an OpenAI-compatible SDK's base URL at the gateway, and once the agent is traced with Respan's SDK, those spans sit inside the trace for the run that made them. When cost spikes, you can filter that window by customer or model, then open the trace to see which step cost the most.
Monitors and budgets read the same per-call cost record the gateway logs, so the number that triggers an alert is the same one a spend limit enforces.
- Cost down to the agent step - Traces nest LLM calls, tool runs, and agent turns, each with its own cost, so you can see which step ran up a run's total.
- Cost per customer, with a budget to match - Attach a customer ID through the gateway or the Python and TypeScript SDKs to see spend, requests, and tokens per end user, then cap each customer's monthly spend at the gateway.
- Cost monitors - Watch cost over windows from 5 minutes to 7 days, filtered by key, model, customer, or metadata, with alerts sent to Slack, email, Microsoft Teams, or a webhook.
- Hard limits per key - Set caps on cost, requests, or tokens that warn or block, checked before a provider is ever called.
- Routing on cost (beta) - Respan Router sends each task to a model that fits it, so simpler steps stop paying frontier prices, and it factors cached reads and writes in before switching.
- Any cost question in SQL - Query spend by customer, feature, or model with read-only SQL when the log filters don't go far enough.
Cost attribution: Request, agent step, customer, and custom attributes.
Alerts and budgets: Cost monitors, per-key caps that warn or block, and per-customer budgets.
Pricing: Free is $0 with 100k logs and unlimited seats. Team is $199 per month billed yearly, with 5 members included and $8 per additional 100k logs. Because billing follows logs, the cost of tracking grows with request volume and not with the size of your team.
Best for: Teams running agents in production who want routing, cost attribution down to the customer, and spend limits in the same place as their traces and evals.
2. LiteLLM
LiteLLM runs as an open-source proxy you deploy yourself, and once it has a database and virtual keys configured, it records the cost of every request it forwards and returns that cost in a response header. Spend is attributed to the key, the user who owns it, the team, the end user passed in the request's user field, and request tags.
Budgets are where LiteLLM goes furthest, with hard limits available at the proxy, team, user, key, customer, and agent-session level, and soft budgets that send Slack or webhook alerts without blocking requests. Attribution stops at the request, though. Spend logs can be grouped by session, but there's no trace tree to show which step inside an agent run cost the most. Because callers can set their own user value, spend can also shift away from the key owner's totals unless you issue keys per user. Owning the database and upgrades is part of the deal as well, and it's a common reason teams weigh LiteLLM alternatives.
Cost attribution: Key, user, team, end user, and tags, per request.
Alerts and budgets: Hard and soft budgets at most levels, with Slack and webhook alerts.
Pricing: The proxy is free under the MIT license, so the cost is the infrastructure and database you run it on. LiteLLM Enterprise is custom-priced and adds SSO, audit logs, and RBAC, and email budget alerts and spend reports also require an Enterprise license.
Best for: Teams that want budgets enforced in a gateway they host and are comfortable running its database.
3. Langfuse
Cost in Langfuse comes from one of two places: the provider's response, when your integration sends cost directly, or a model definition that multiplies token usage by a price. Langfuse maintains prices for common OpenAI, Anthropic, and Google models, and you can add your own, including tiers that change the rate by context length.
Usage is stored in separate buckets, so cached input and reasoning output get their own prices. The catch is that providers that report inclusive counts, where prompt tokens already include cache hits, need converting first, or cost gets counted twice. Langfuse's own integrations handle that normalization for you. Dashboards break spend down by user, session, tag, and model, and alerts on cost metrics can notify Slack, trigger GitHub Actions, or call a webhook.
The docs don't describe budgets or hard caps, so stopping spend at a limit means pairing Langfuse with a gateway, which is one of the gaps teams look at when comparing Langfuse alternatives.
Cost attribution: Per LLM call, rolled up by user, session, tag, and model.
Alerts and budgets: Cost alerts to Slack, GitHub Actions, or webhooks, with no budgets.
Pricing: Hobby is free with 50k units and 2 users. Core is $29 per month for 100k units, then $8 per additional 100k. A unit is any trace, observation, or score, so an agent run with many steps uses several units, and volume might climb faster than your request count suggests.
Best for: Teams that want open-source tracing with prices they can configure, and that handle spend limits elsewhere.
4. LangSmith
For agents built on LangChain or LangGraph, LangSmith shows cost along the structure of the run. The trace tree carries the total for the whole trace, aggregated costs on parent runs, and a breakdown for each child run, and you can record a cost on non-LLM runs such as a paid tool call. Threads add up cost across a conversation once child runs carry a session or thread ID.
Cost is calculated automatically for LangChain, @traceable with OpenAI or Anthropic models, and the OpenAI and Anthropic wrappers. Other providers need token and cost data sent in. Custom pricing can split rates by token type, such as cache reads and reasoning, with an activation date, although price changes don't apply to traces already logged. The cost docs don't describe breaking spend down by user or customer.
Alerts can fire on a cost threshold, and LangSmith LLM Gateway, in public beta since July 2026, enforces spend caps by refusing requests with a 402. If you're on a different framework, the setup work might weigh more, which comes up often in LangSmith alternatives.
Cost attribution: Trace, parent run, and child run, including tool calls.
Alerts and budgets: Cost-threshold alerts, plus spend caps through the beta gateway.
Pricing: Developer is free with one seat and 5k base traces per month. Plus is $39 per seat per month with 10k base traces, then pay-as-you-go. Seats and traces meter separately, so the bill grows with team size as well as volume.
Best for: LangChain and LangGraph teams who want cost inside the traces they already debug with.
5. Datadog Agent Observability
If your services already report to Datadog, Datadog Agent Observability, formerly LLM Observability, puts LLM cost on the same traces as the rest of the application. Each LLM span is priced on its own from token counts and providers' public rates across 800+ models, a banner on the trace shows the total, and the Cost Overview breaks spend down by application, provider, and model.
You can promote span tags such as team or customer_tier to cost metrics and build monitors that alert when spend crosses a threshold, including per tag value. Those tags need a small, bounded set of values, since tags with many unique values can be truncated, so tracking cost per individual customer at scale might be awkward. There are no budgets, and the figures are estimates. Spend reported by provider integrations such as OpenAI, Anthropic, and Amazon Bedrock lives in a separate product, Cloud Cost Management, which adds another meter to a bill that's already a reason teams look at Datadog alternatives.
Cost attribution: Per LLM span and trace, plus bounded custom tags.
Alerts and budgets: Metric monitors on cost, with no budgets.
Pricing: Free covers up to 40,000 LLM spans per month. Pro is $160 per month on annual billing for 100,000 LLM spans, with on-demand usage above that. Only LLM spans bill, while tool, agent, and retrieval spans are free, so the cost follows model calls and not how complex the agent is.
Best for: Teams already on Datadog APM who want LLM spend next to infrastructure metrics.
What metrics do LLM cost tracking tools track?
The tools above overlap on a core set of metrics, and the differences come down to which of these each one can break down far enough to act on:
- Cost per request and per agent run - The base unit is the cost of one call, but agents make the run the more useful number. AI observability platforms nest LLM calls, tool runs, and agent steps in one trace, so you can see the run's total and the step that drove it.
- Token counts by type - Input, output, cached, and reasoning tokens each carry their own price, so a tracker needs them split out to get cost right.
- Cost by model and provider - Shows where spend concentrates and whether a model change moved it.
- Cost per user, feature, or customer - Answers which part of the product, and which accounts, drive the bill. It depends on tagging requests with those IDs when they're made.
- Estimated cost vs billed cost - Trackers estimate from price tables, so comparing their totals with the provider invoice shows whether the estimates have drifted.
Per-customer and per-run views are the ones that need setup ahead of time, because the IDs have to travel with each request from the start.
Best practices for monitoring and tracking LLM costs
Tag every request with user, feature, and environment
Attribution only works if the IDs are attached when the call is made, because no invoice will ever contain your user or feature names. Pass a customer ID, a feature name, and the environment on every request, at the gateway or through your SDK, and use the field your tool provides for user IDs instead of a metric tag, since metrics systems often truncate tags with many unique values.
Field names vary by tool, but with an OpenAI-compatible client the pattern looks like this:
response = client.chat.completions.create(
    model="gpt-5.5",
    messages=messages,
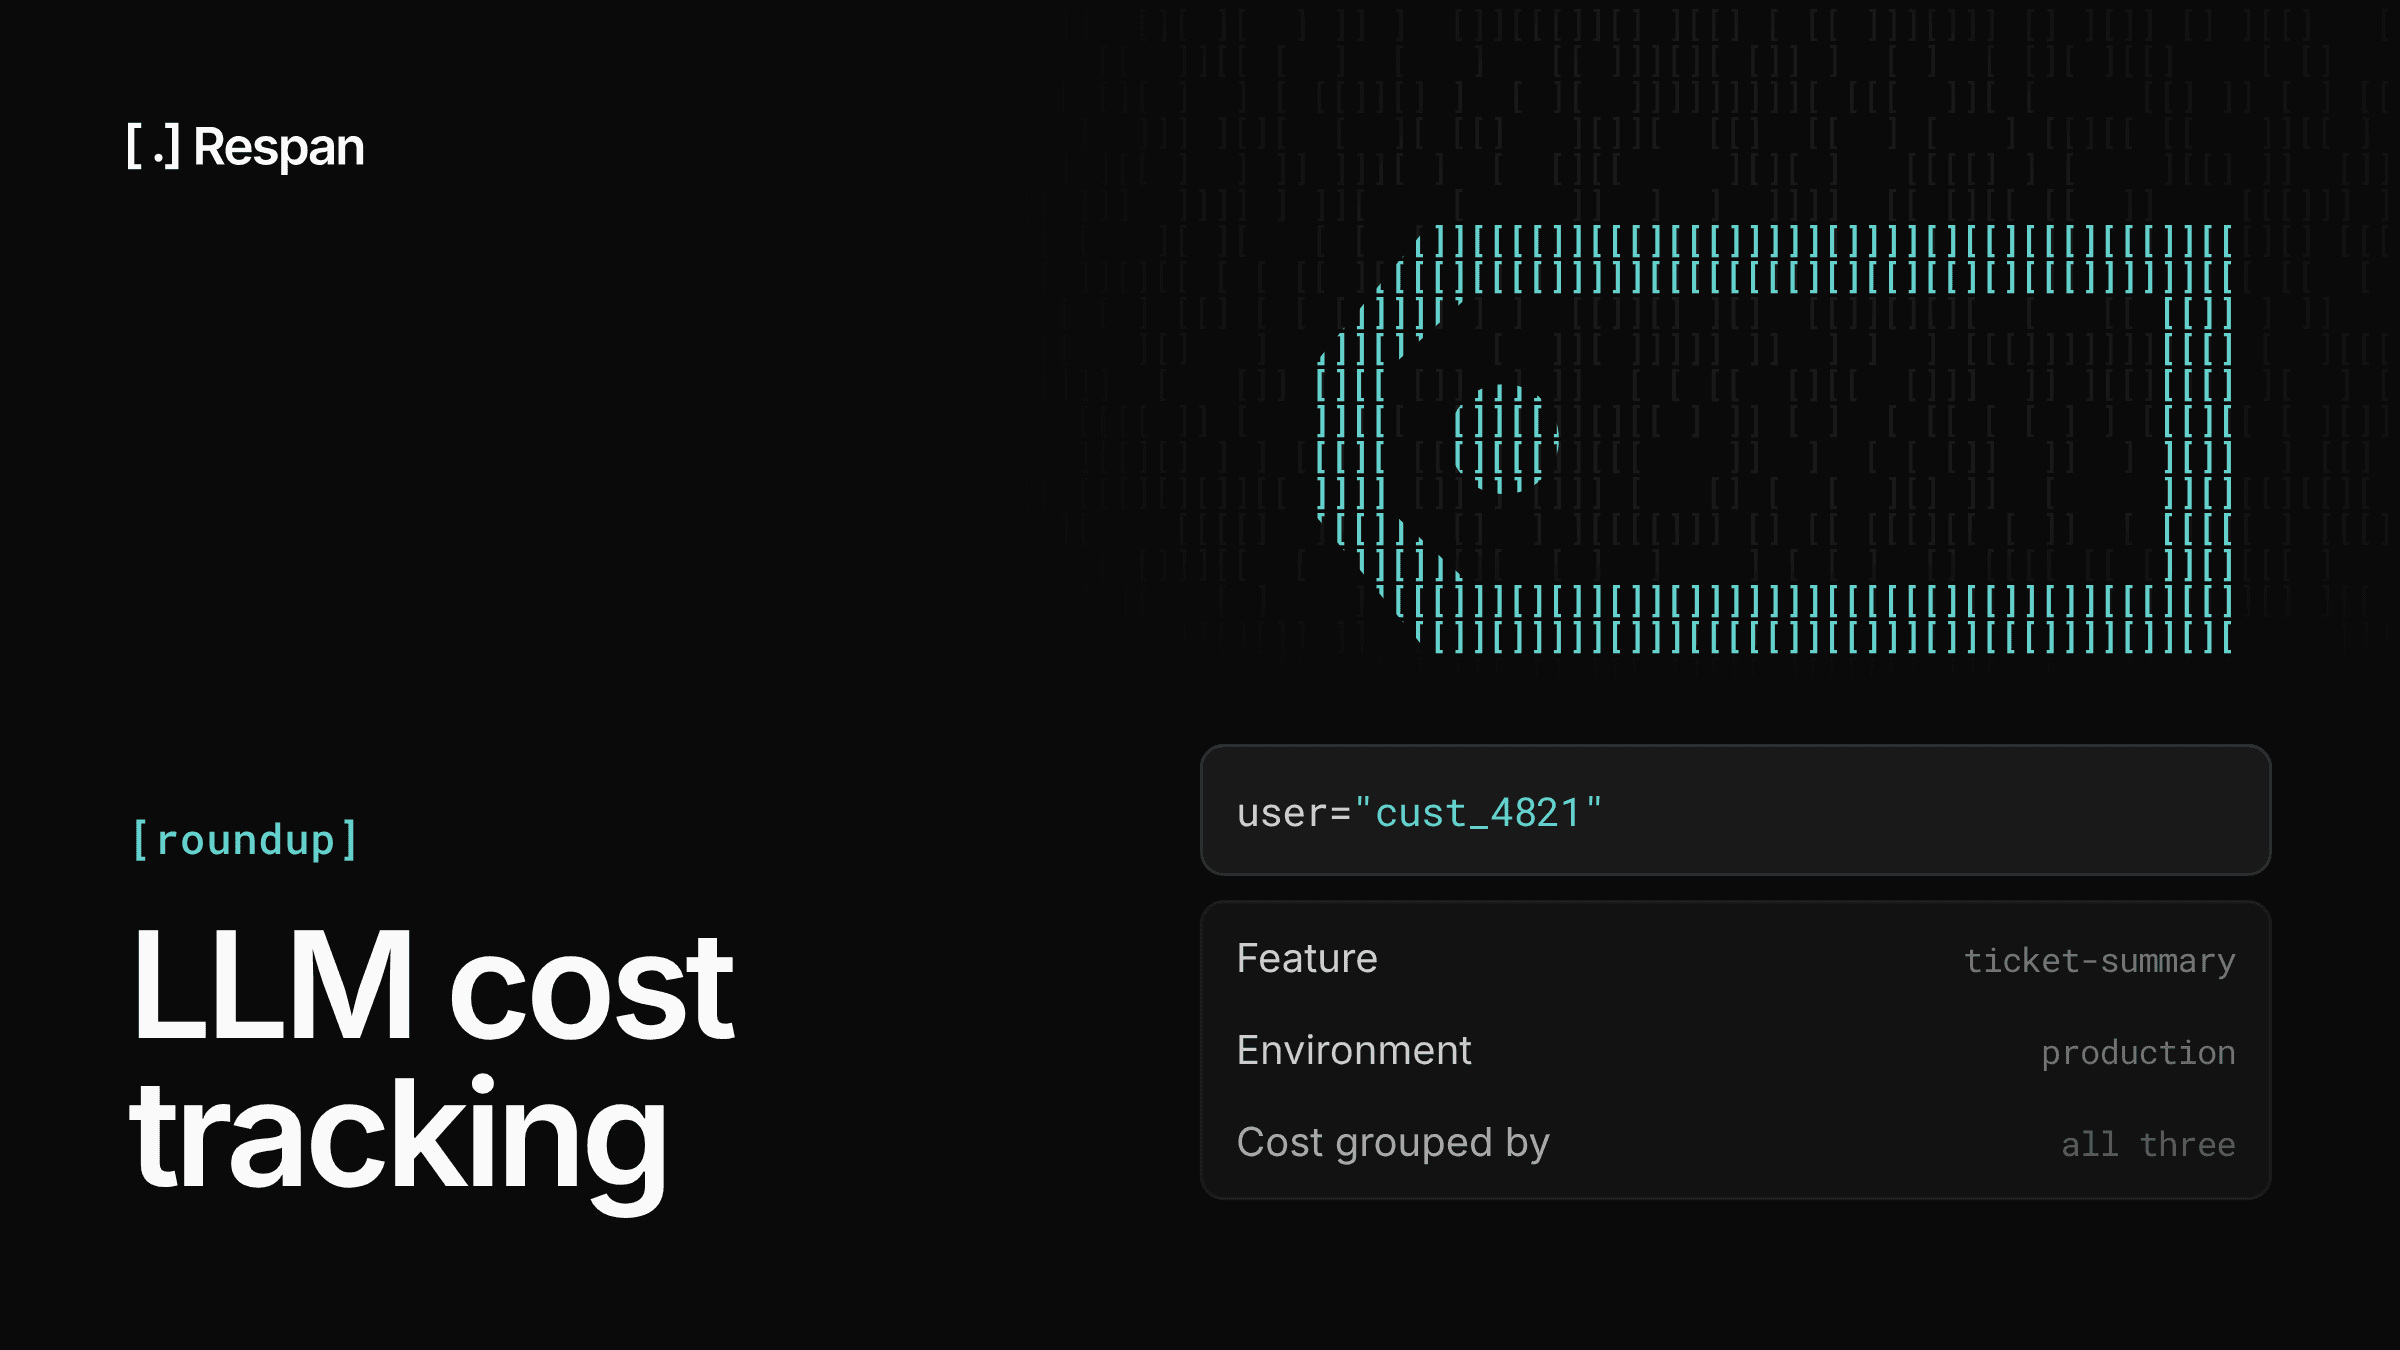
    user="cust_4821",
    extra_body={"metadata": {"feature": "ticket-summary", "env": "production"}},
)
In that call, user carries the customer ID and the metadata carries the feature and environment, so your tracker can group cost by any of the three.
Count retries and failed calls in the workflow's cost
A failed attempt that the provider still billed is part of what a task cost. If your tracker only records successful responses, it understates spend, and the gap grows with your error rate. Grouping calls by trace rolls retries and fallbacks into the task that triggered them, which is the number that matters for margins.
Set spend alerts and budgets before the invoice arrives
An alert tells someone that spend crossed a line, while a hard limit stops the request. A leaked key or an agent stuck in a loop overnight can run up real money between an alert and a person reading it, so set hard caps per key and per customer at the gateway, where they're checked before a provider is called, and keep alerts for trends that need a human decision.
Keep model prices current and reconcile against the provider bill
Trackers calculate cost from price tables, and those tables drift when a provider changes a rate, when you negotiate a discount, or when a new model ships before the table includes it. Some tools don't apply a price change to calls already logged, so set custom prices for contracted rates as soon as they apply.
Reconcile your tracked total against the provider invoice each month. A gap usually points to models priced at $0 because the tool has no rate for them, or to streaming calls that never reported usage, since OpenAI's API, and many compatible ones, only return usage on a stream when the request sets stream_options: {"include_usage": true}.
Review cost changes alongside quality
A drop in cost per request can mean a cheaper model is working, or it can mean responses are getting truncated or failing early. Pair cost dashboards with output scores from evals, so a cost change and its effect on quality show up together before you treat the saving as real.
FAQ
Do any AI gateways include cost tracking?
Yes. Because a gateway sits in the request path, it can price every call without extra instrumentation, and several gateways also enforce budgets. Respan logs the cost of each call through its gateway, breaks spend down by customer and trace, and enforces per-key caps and per-customer budgets.
Among other options, LiteLLM tracks spend per key, team, and end user with budgets at several levels, and Portkey, now Prisma AIRS AI Gateway, tracks cost per request and supports budget limits on keys and workspaces. Vercel AI Gateway logs cost per request and supports budgets by team, project, or key, although those budgets exclude spend on your own provider keys, and OpenRouter returns each request's cost in the response. A comparison of the best LLM gateways covers how they differ beyond cost.
How much do LLM cost tracking tools cost?
Most have a free tier, and the paid price depends on what each one meters: logs for Respan, units for Langfuse, seats and traces for LangSmith, LLM spans for Datadog, and your own infrastructure for self-hosted LiteLLM. Since the same traffic can land in very different places depending on the unit, compare them on your own request volume and team size, starting from the prices in the table above.
How do you track LLM costs per user?
Attach a user or customer ID to every LLM request, either as a request parameter at the gateway or as an attribute in your tracing SDK, then group cost by that ID. In Respan, a customer identifier on a request or span gives you spend, requests, and tokens for each end user, and requests through the gateway can also be held to a per-customer budget.
LiteLLM reads the request's user field as the end user, and Langfuse breaks dashboards down by user once the ID is passed with each trace. Whichever tool you use, set the ID on the server side where users can't change it.
Can you track LLM costs without a dedicated tool?
Yes, at a small scale. Provider responses include token usage, so you can log it with each request, multiply by a price table you maintain, and use the provider's dashboard for monthly totals. That approach gets harder to keep accurate once you call several providers, run agents that make many calls per task, or need cost per customer, because you end up maintaining prices, token types, and attribution yourself.
A gateway takes that work off your code. Respan writes the usage and cost of every call it routes to a log without extra parameters, and calculates the same cost whether the call runs on Respan credits or your own provider keys.