

Datasets for agent tracing
Use this setup to evaluate an agent end to end. An agent run is not one LLM call: a request arrives, the agent classifies it, hands off between sub-agents, calls tools, and eventually returns a single answer. Scoring one span tells you whether one model call was good. Scoring a trace tells you whether the run was good, which is the thing your user experienced.
Unlike the other setups in this section, there are no columns to map. You sample traces, and each row arrives filled in from the run. What decides whether the rows are any good is your tracing.
Spans or traces
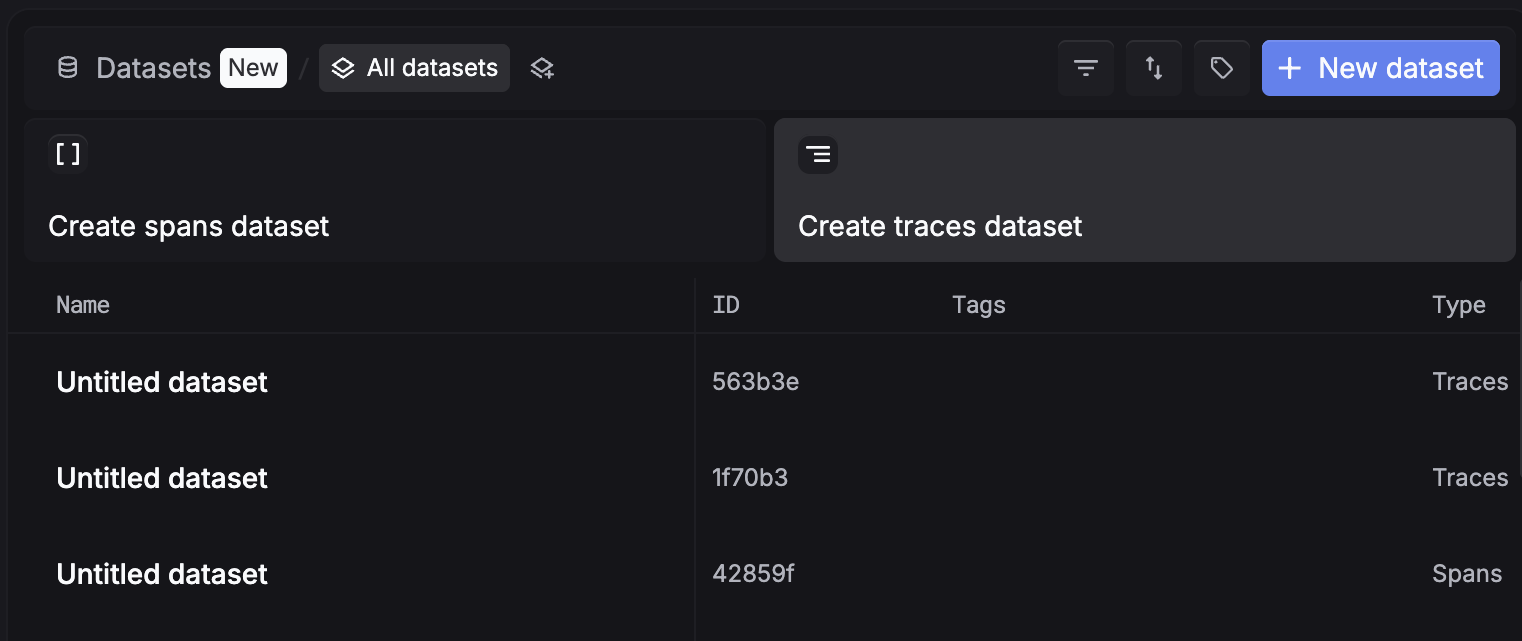
You pick the granularity when you create the dataset, on the Datasets page: Create spans dataset or Create traces dataset. The Type column on the list tells you which one you are looking at.
What your traces need
One trace has to be one agent run, because the trace’s root span is what becomes the row. Your instrumentation decides whether you get that:
Name the root span while you are there: that name is the Workflow name filter you sample with.
If a root span carries no input or output, its traces still sample, as empty rows. Open one trace and check that you can see a user request and a final answer before you sample a few hundred of them.
Create the dataset
Create a traces dataset
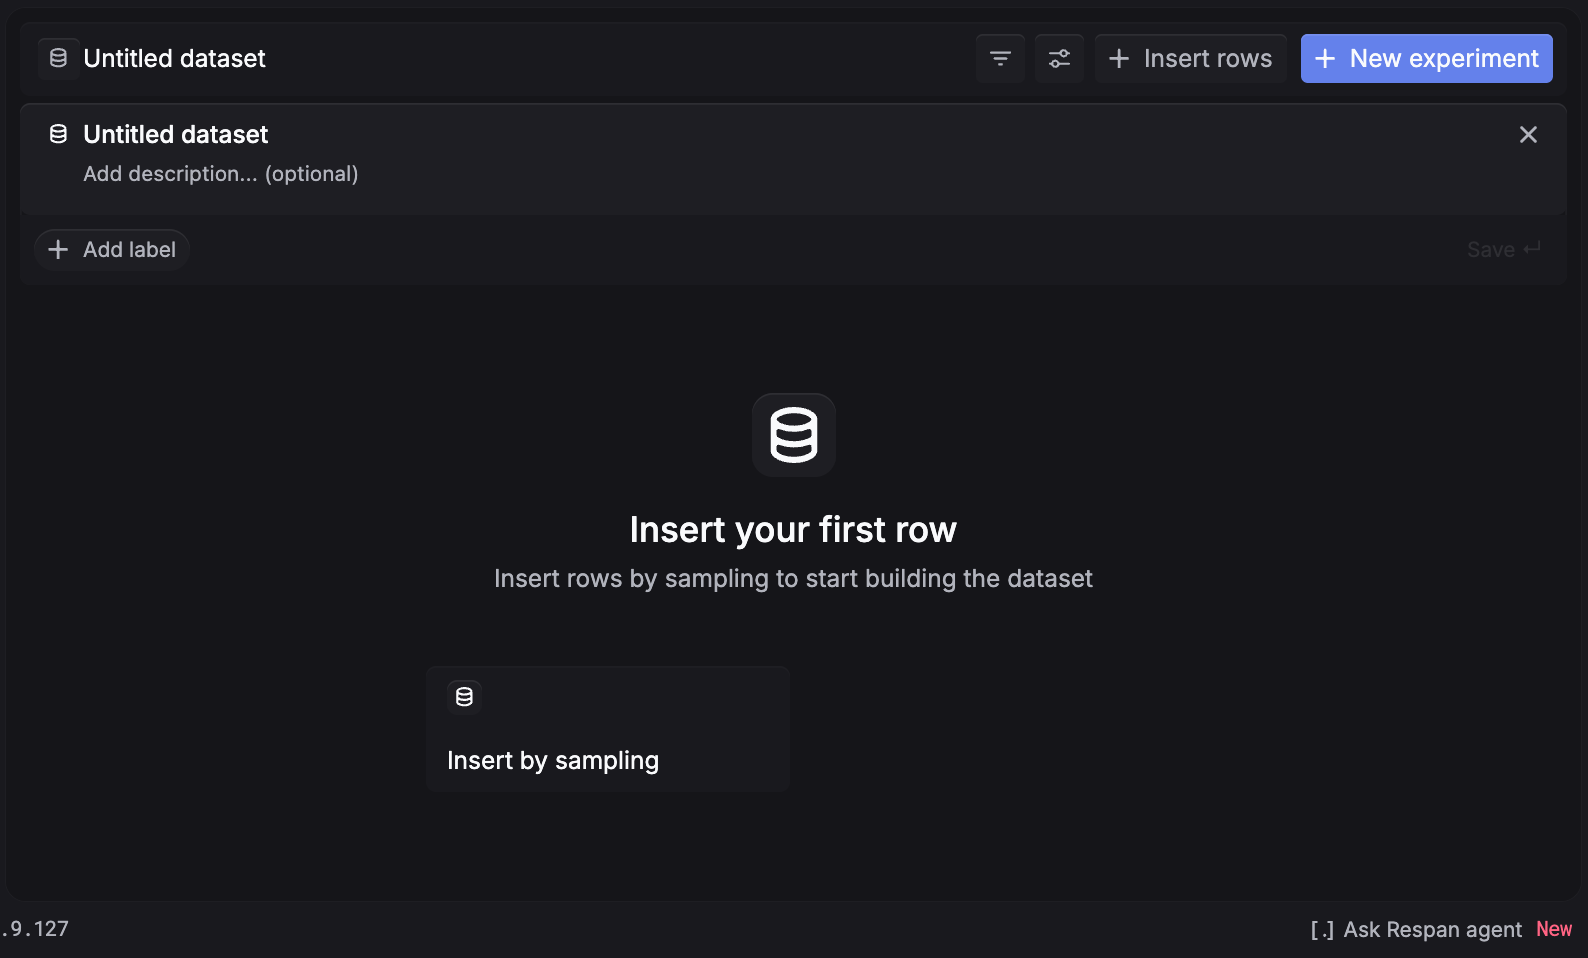
Go to Datasets and click Create traces dataset. Give it a name. You land on an empty dataset whose only way in is Insert by sampling: trace rows come from your traffic, not from a CSV.
Sample your traces
Click Insert by sampling, then set the time range the runs happened in. It defaults to a narrow recent window, so widen it if Estimated rows reads 0.
Filter to the runs you care about
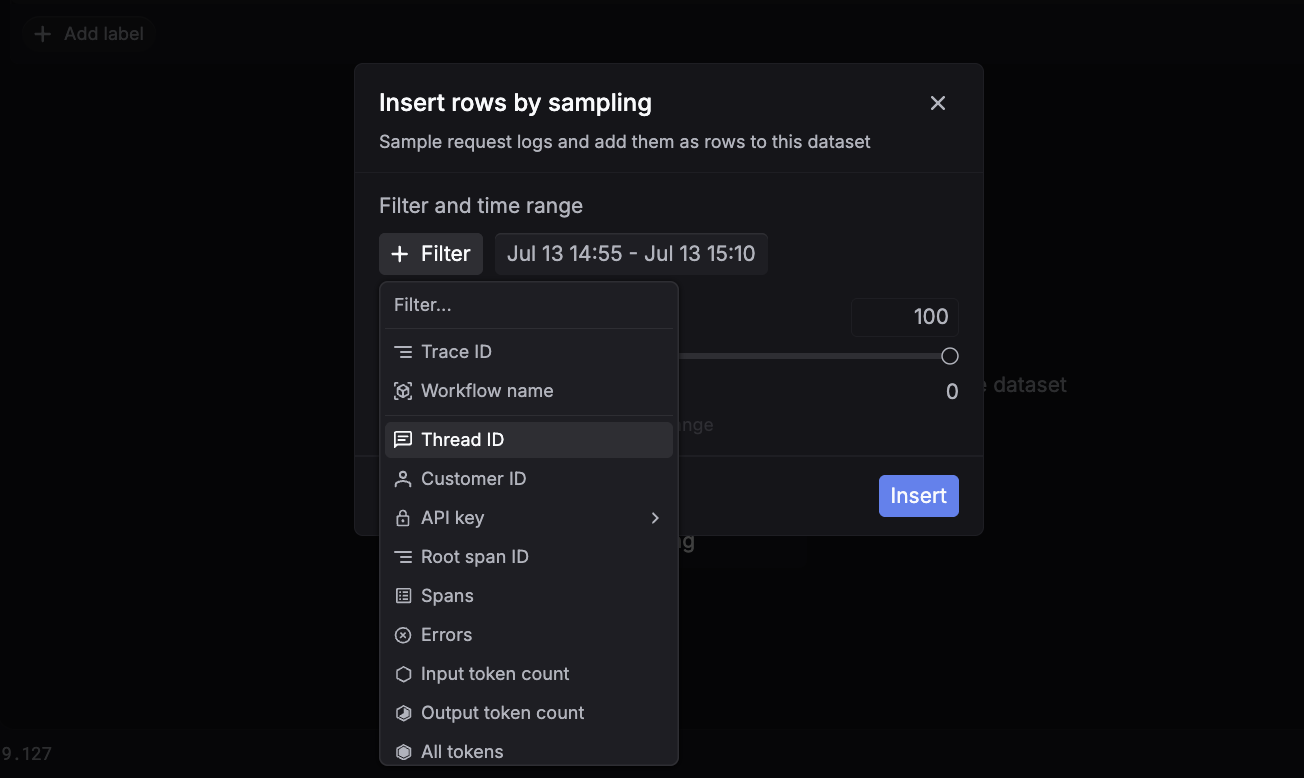
Click + Filter. Because you are sampling traces, every filter field is trace-level: Workflow name, Trace ID, Root span ID, Thread ID, Customer ID, API key, Spans, Errors, Duration, and the token counts. They describe the shape of the run, not the contents of one call.
Four of them find bad runs before anyone has read one:
- Errors greater than 0 gives you the runs that broke.
- Spans greater than some threshold gives you the runs that wandered: the agent that took 40 spans to answer a question that usually takes 8.
- Duration and the token counts give you the runs that were slow or expensive, which for an agent usually means the same thing. It looped.
Insert the rows
Drag the Sampling percentage slider, watch Estimated rows update, then click Insert. Each trace lands as one row, with a link back to the full trace.
Curate the rows
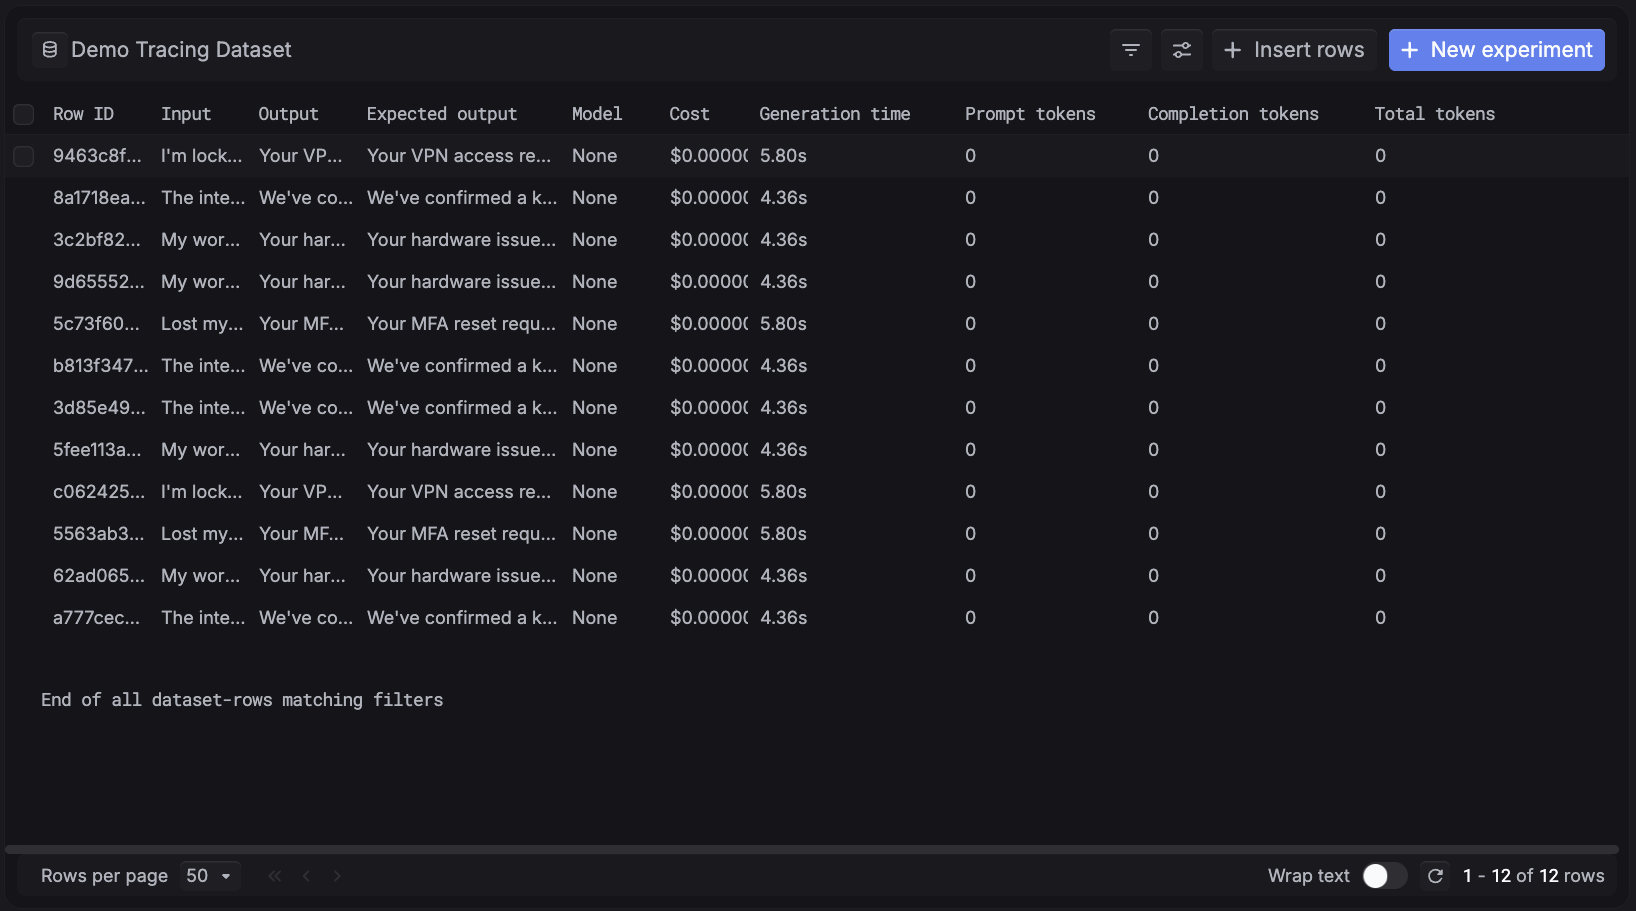
Sampling seeds each row’s expected_output with the answer production actually gave. That is a starting point, not a golden answer. A correctness grader run against it would score every row 1 by construction.
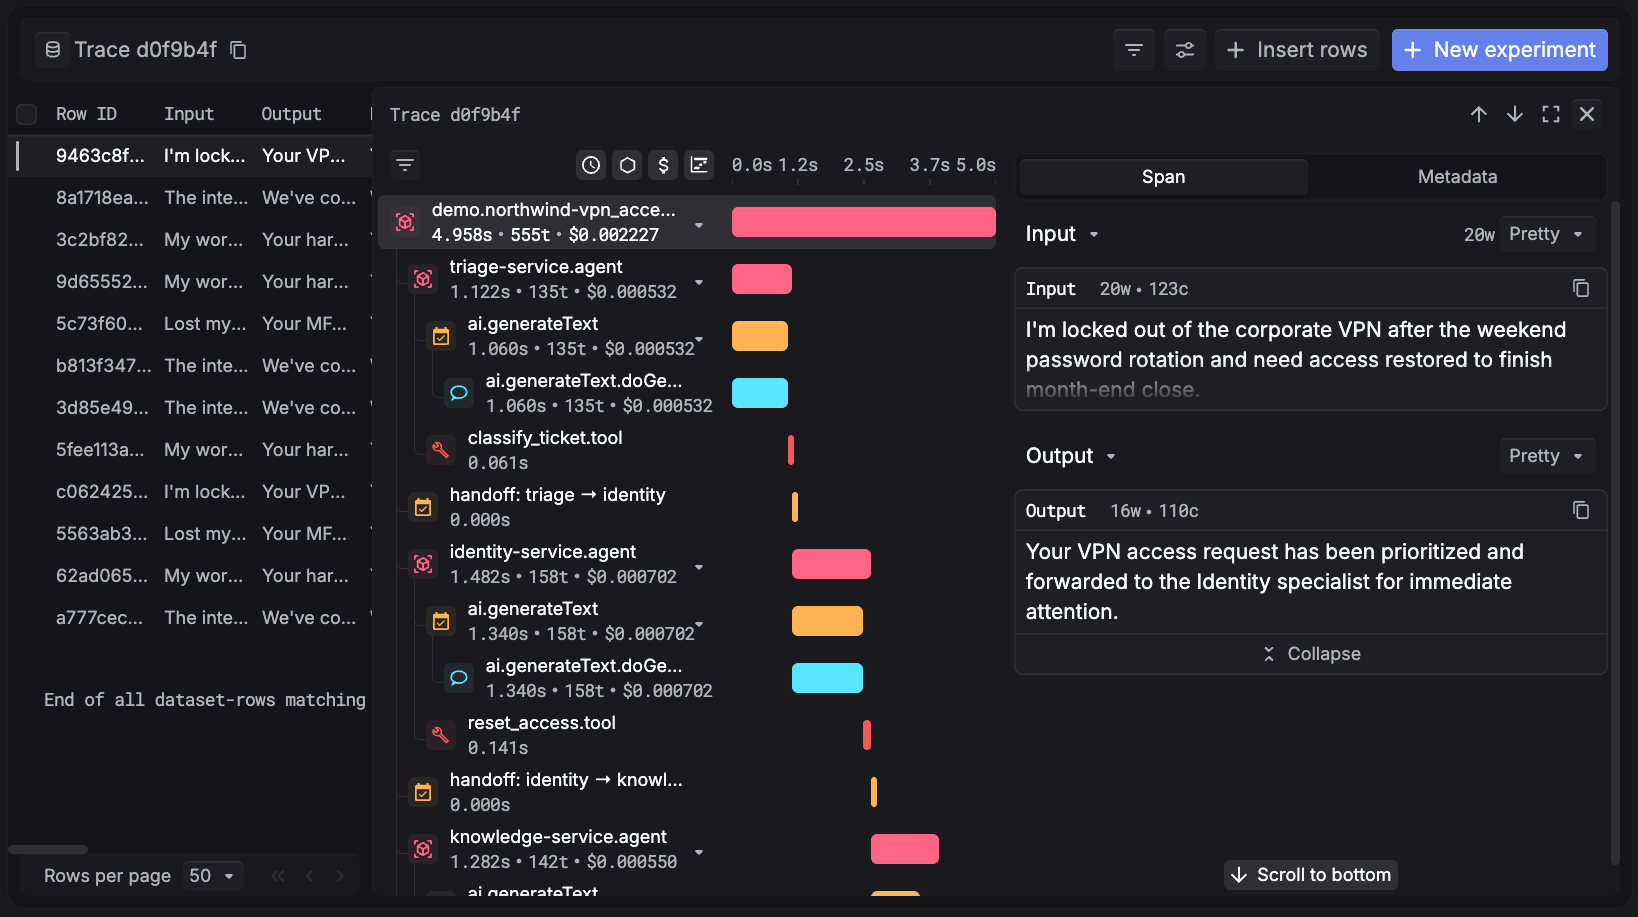
So before you grade anything reference-based, go through the rows and fix expected_output to say what the agent should have said. This is where the trace drill-down earns its keep: click a row and the trace opens beside it, so you can follow the run (the classification, each handoff, each tool call) and decide whether the delivered answer was right before you write down what right looks like.
expected_output is optional. You only need it for evaluators that compare the answer against a known-correct one, so curate it for the rows where exactly one answer is correct and skip it for the rest.
With the rows in, run the dataset through an experiment with Task type = Dataset outputs. Nothing is generated: Respan scores the answer each run already delivered.
Related setups
- Datasets for prompt optimization. Generate from a saved prompt template.
- Datasets for model comparison. Generate from a raw model.
- Datasets for production data. Score stored outputs at the span level.
- Back to the Datasets overview.