

Explore spans
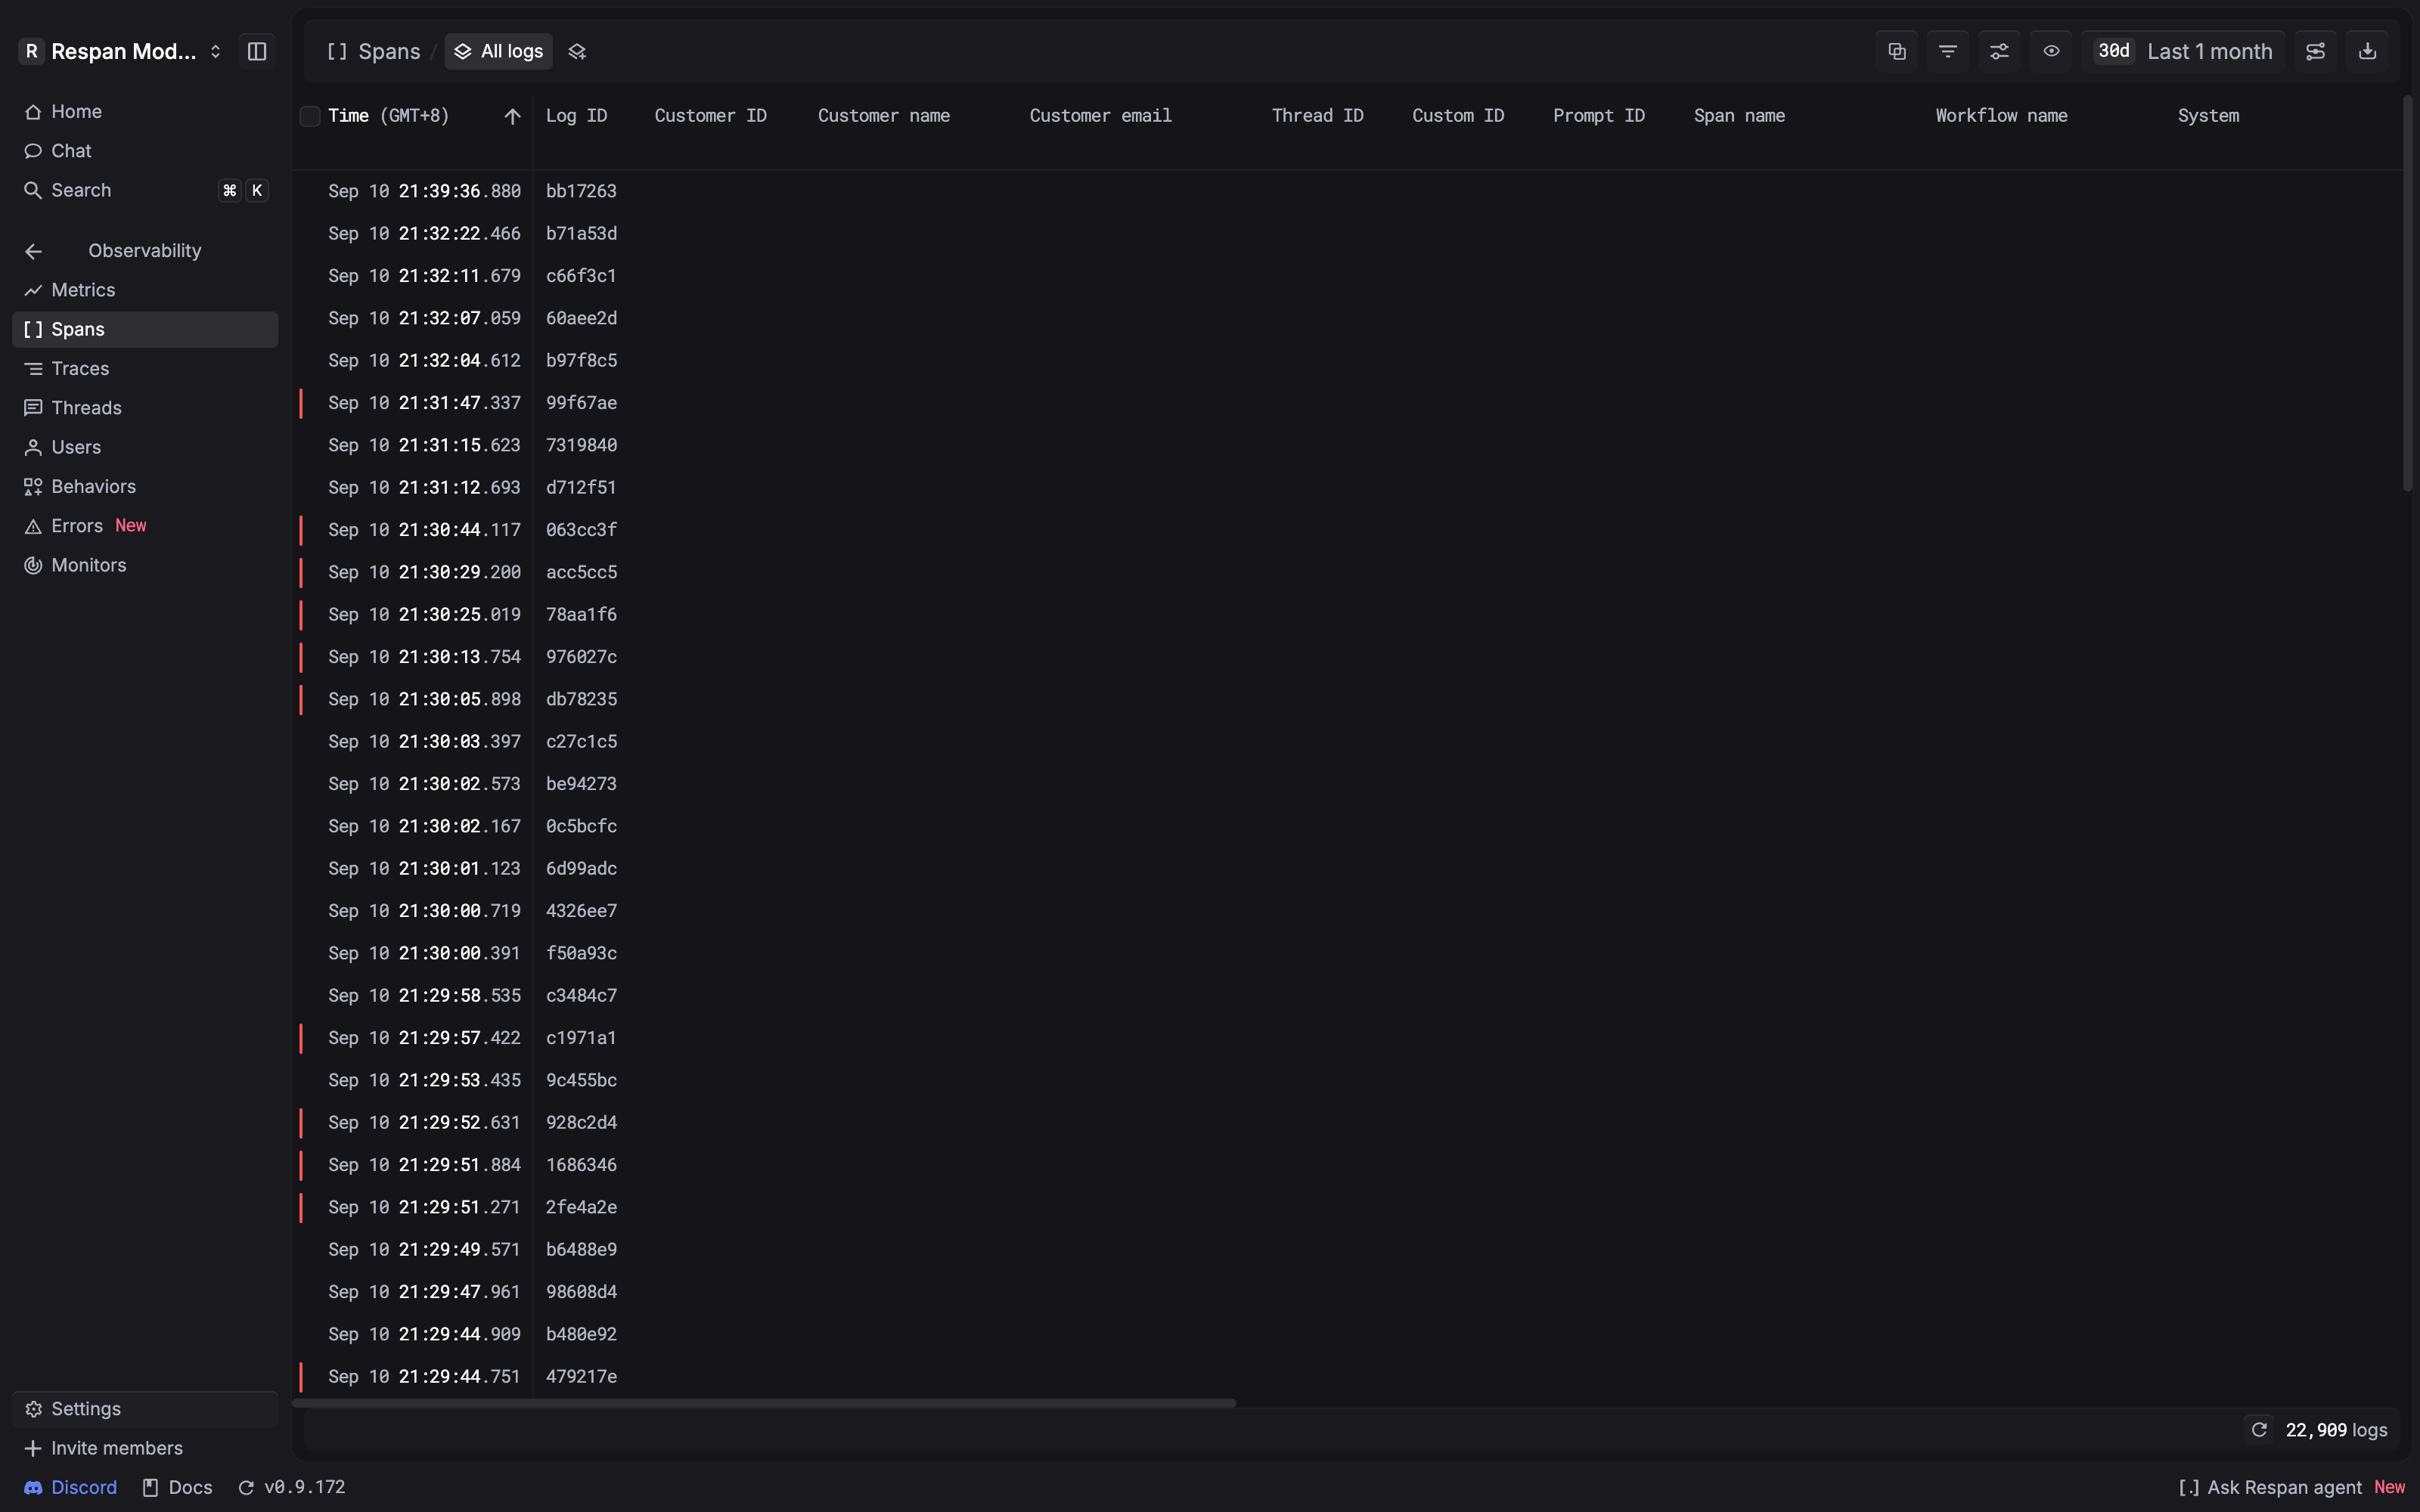
Open Observability → Spans to inspect individual LLM requests, tool calls, and workflow steps. Each row is one recorded operation.
Find the spans that matter
Select a project, then use the time picker to choose a preset range or enter a start and end time. The Time column shows the timezone.
Open table settings to change Sort by, the sort direction, and visible columns. Use Log ID to identify a span. For performance and usage, show Latency, Cost, and Total tokens; add Model or Span name for context. You can also display recorded custom properties as columns.
Filter spans
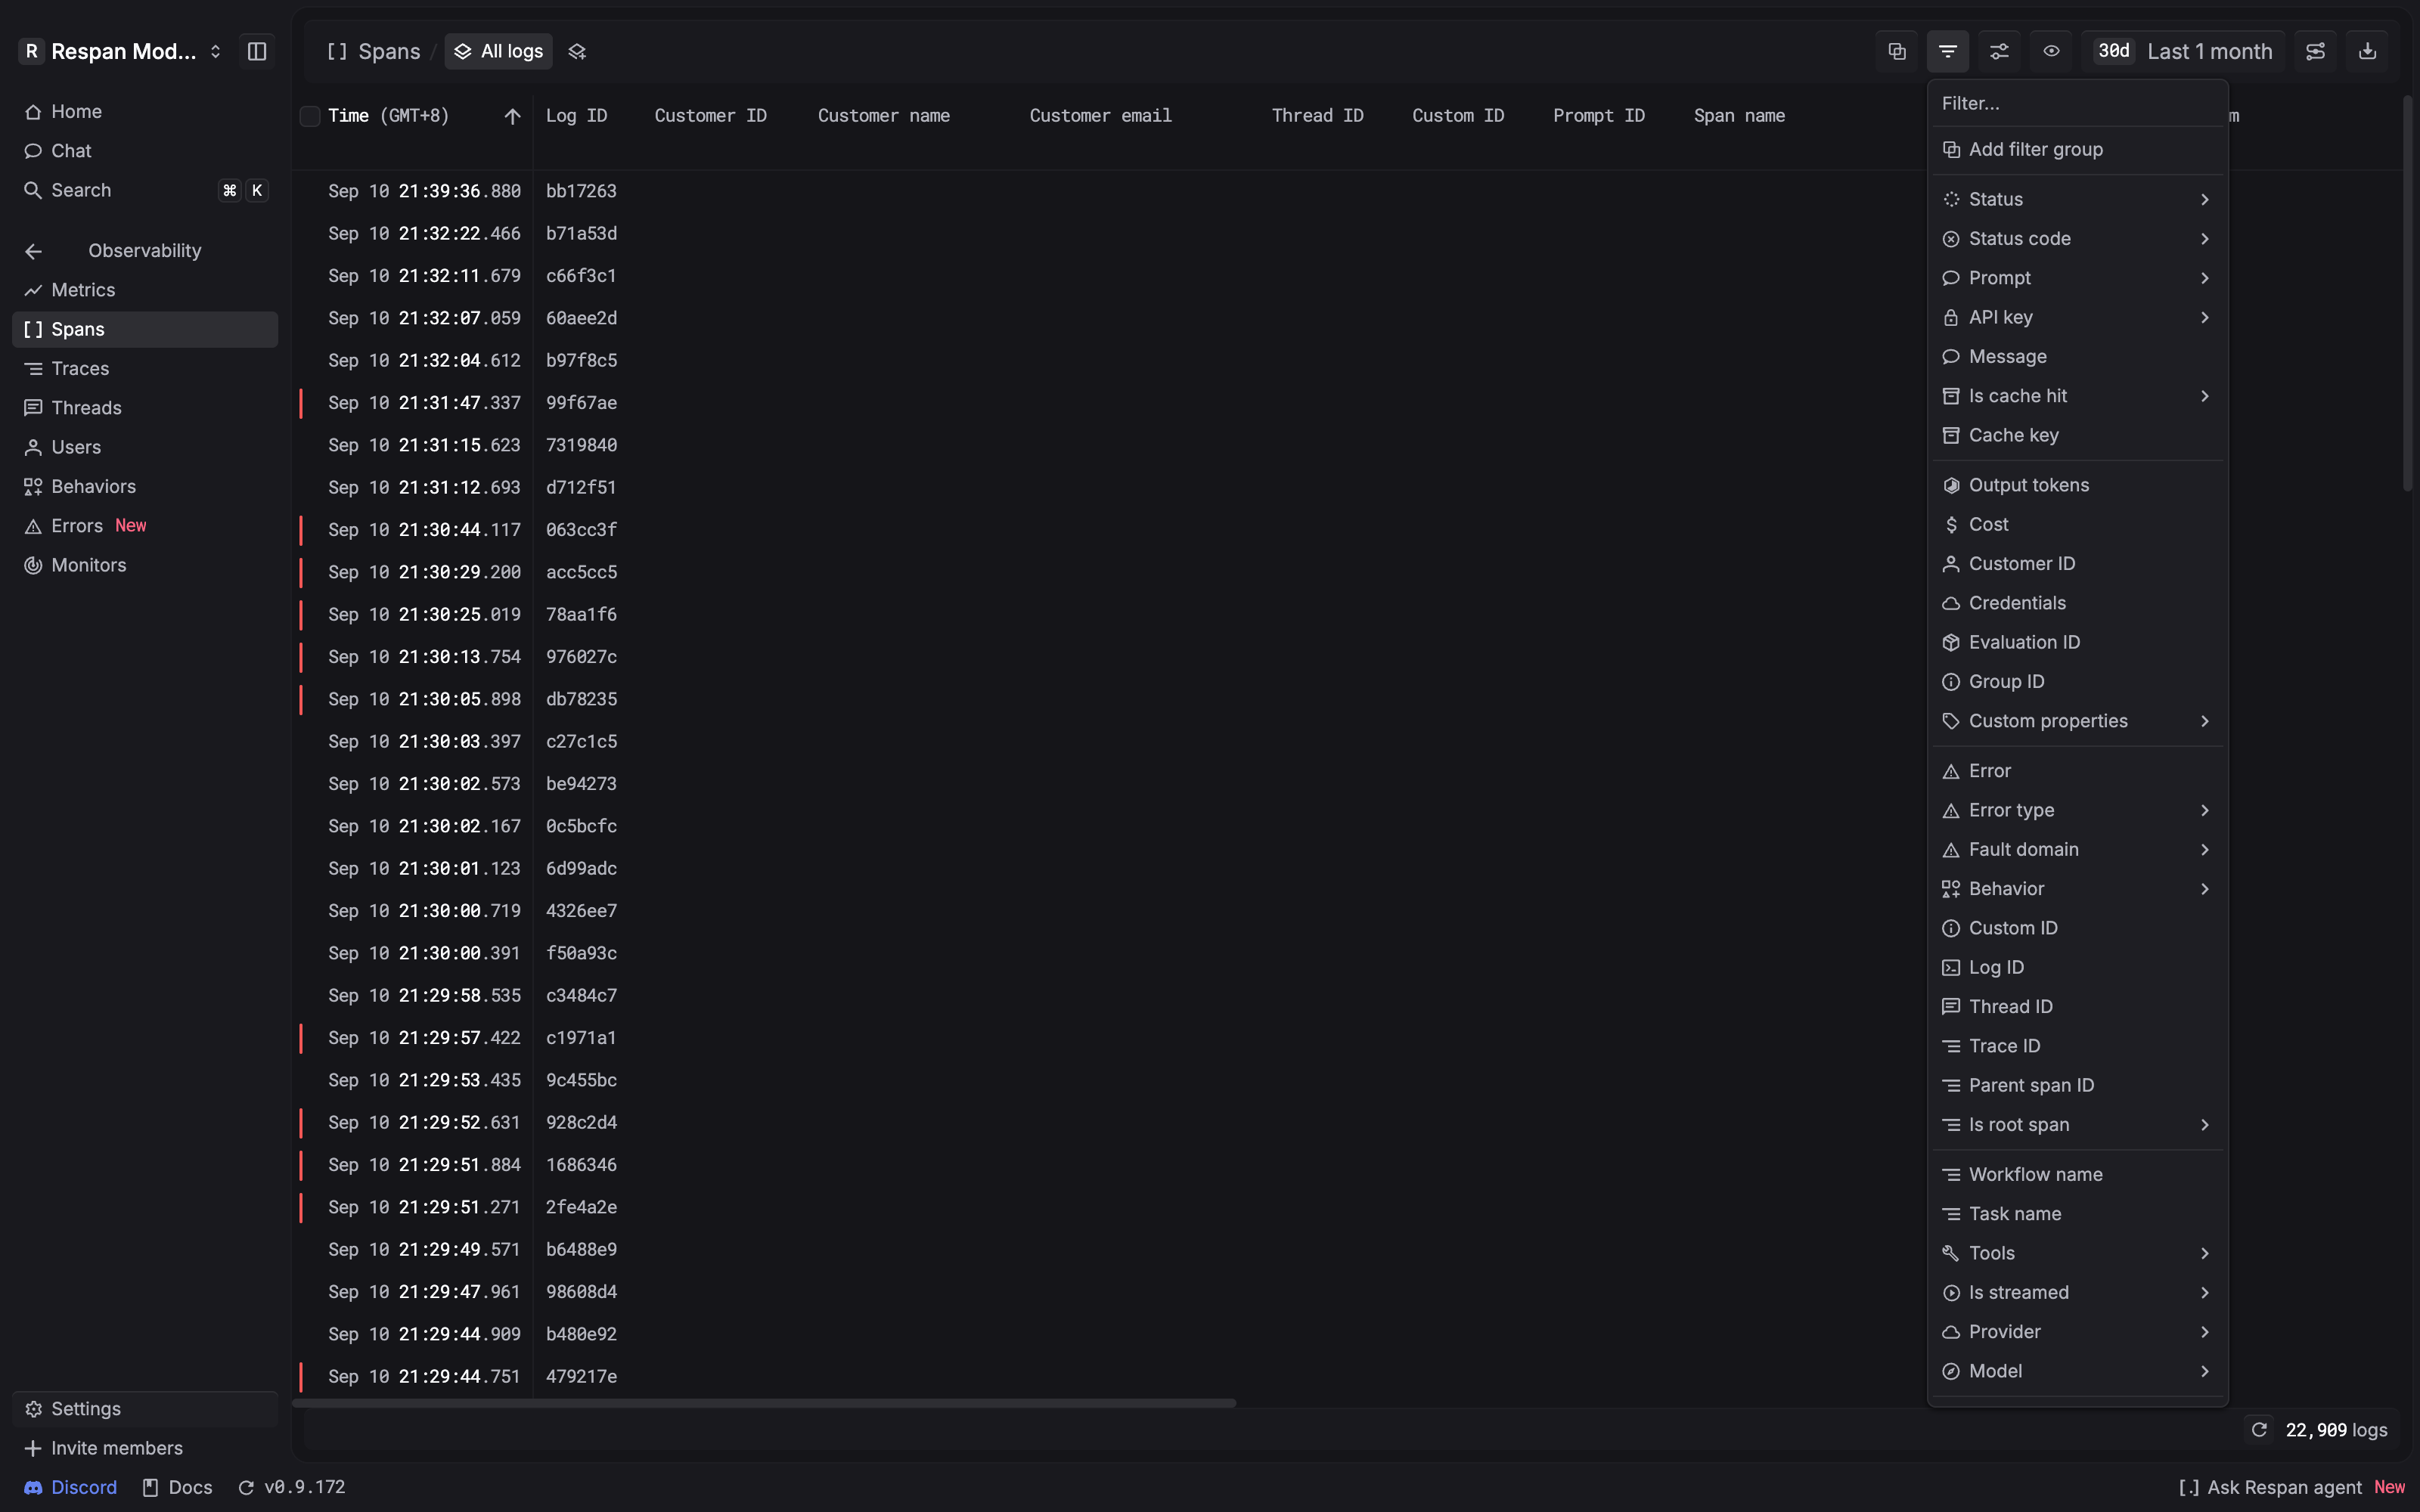
Click Filter (the funnel icon) in the table toolbar. Search for a field or scroll through the menu, then select the field you want to filter.
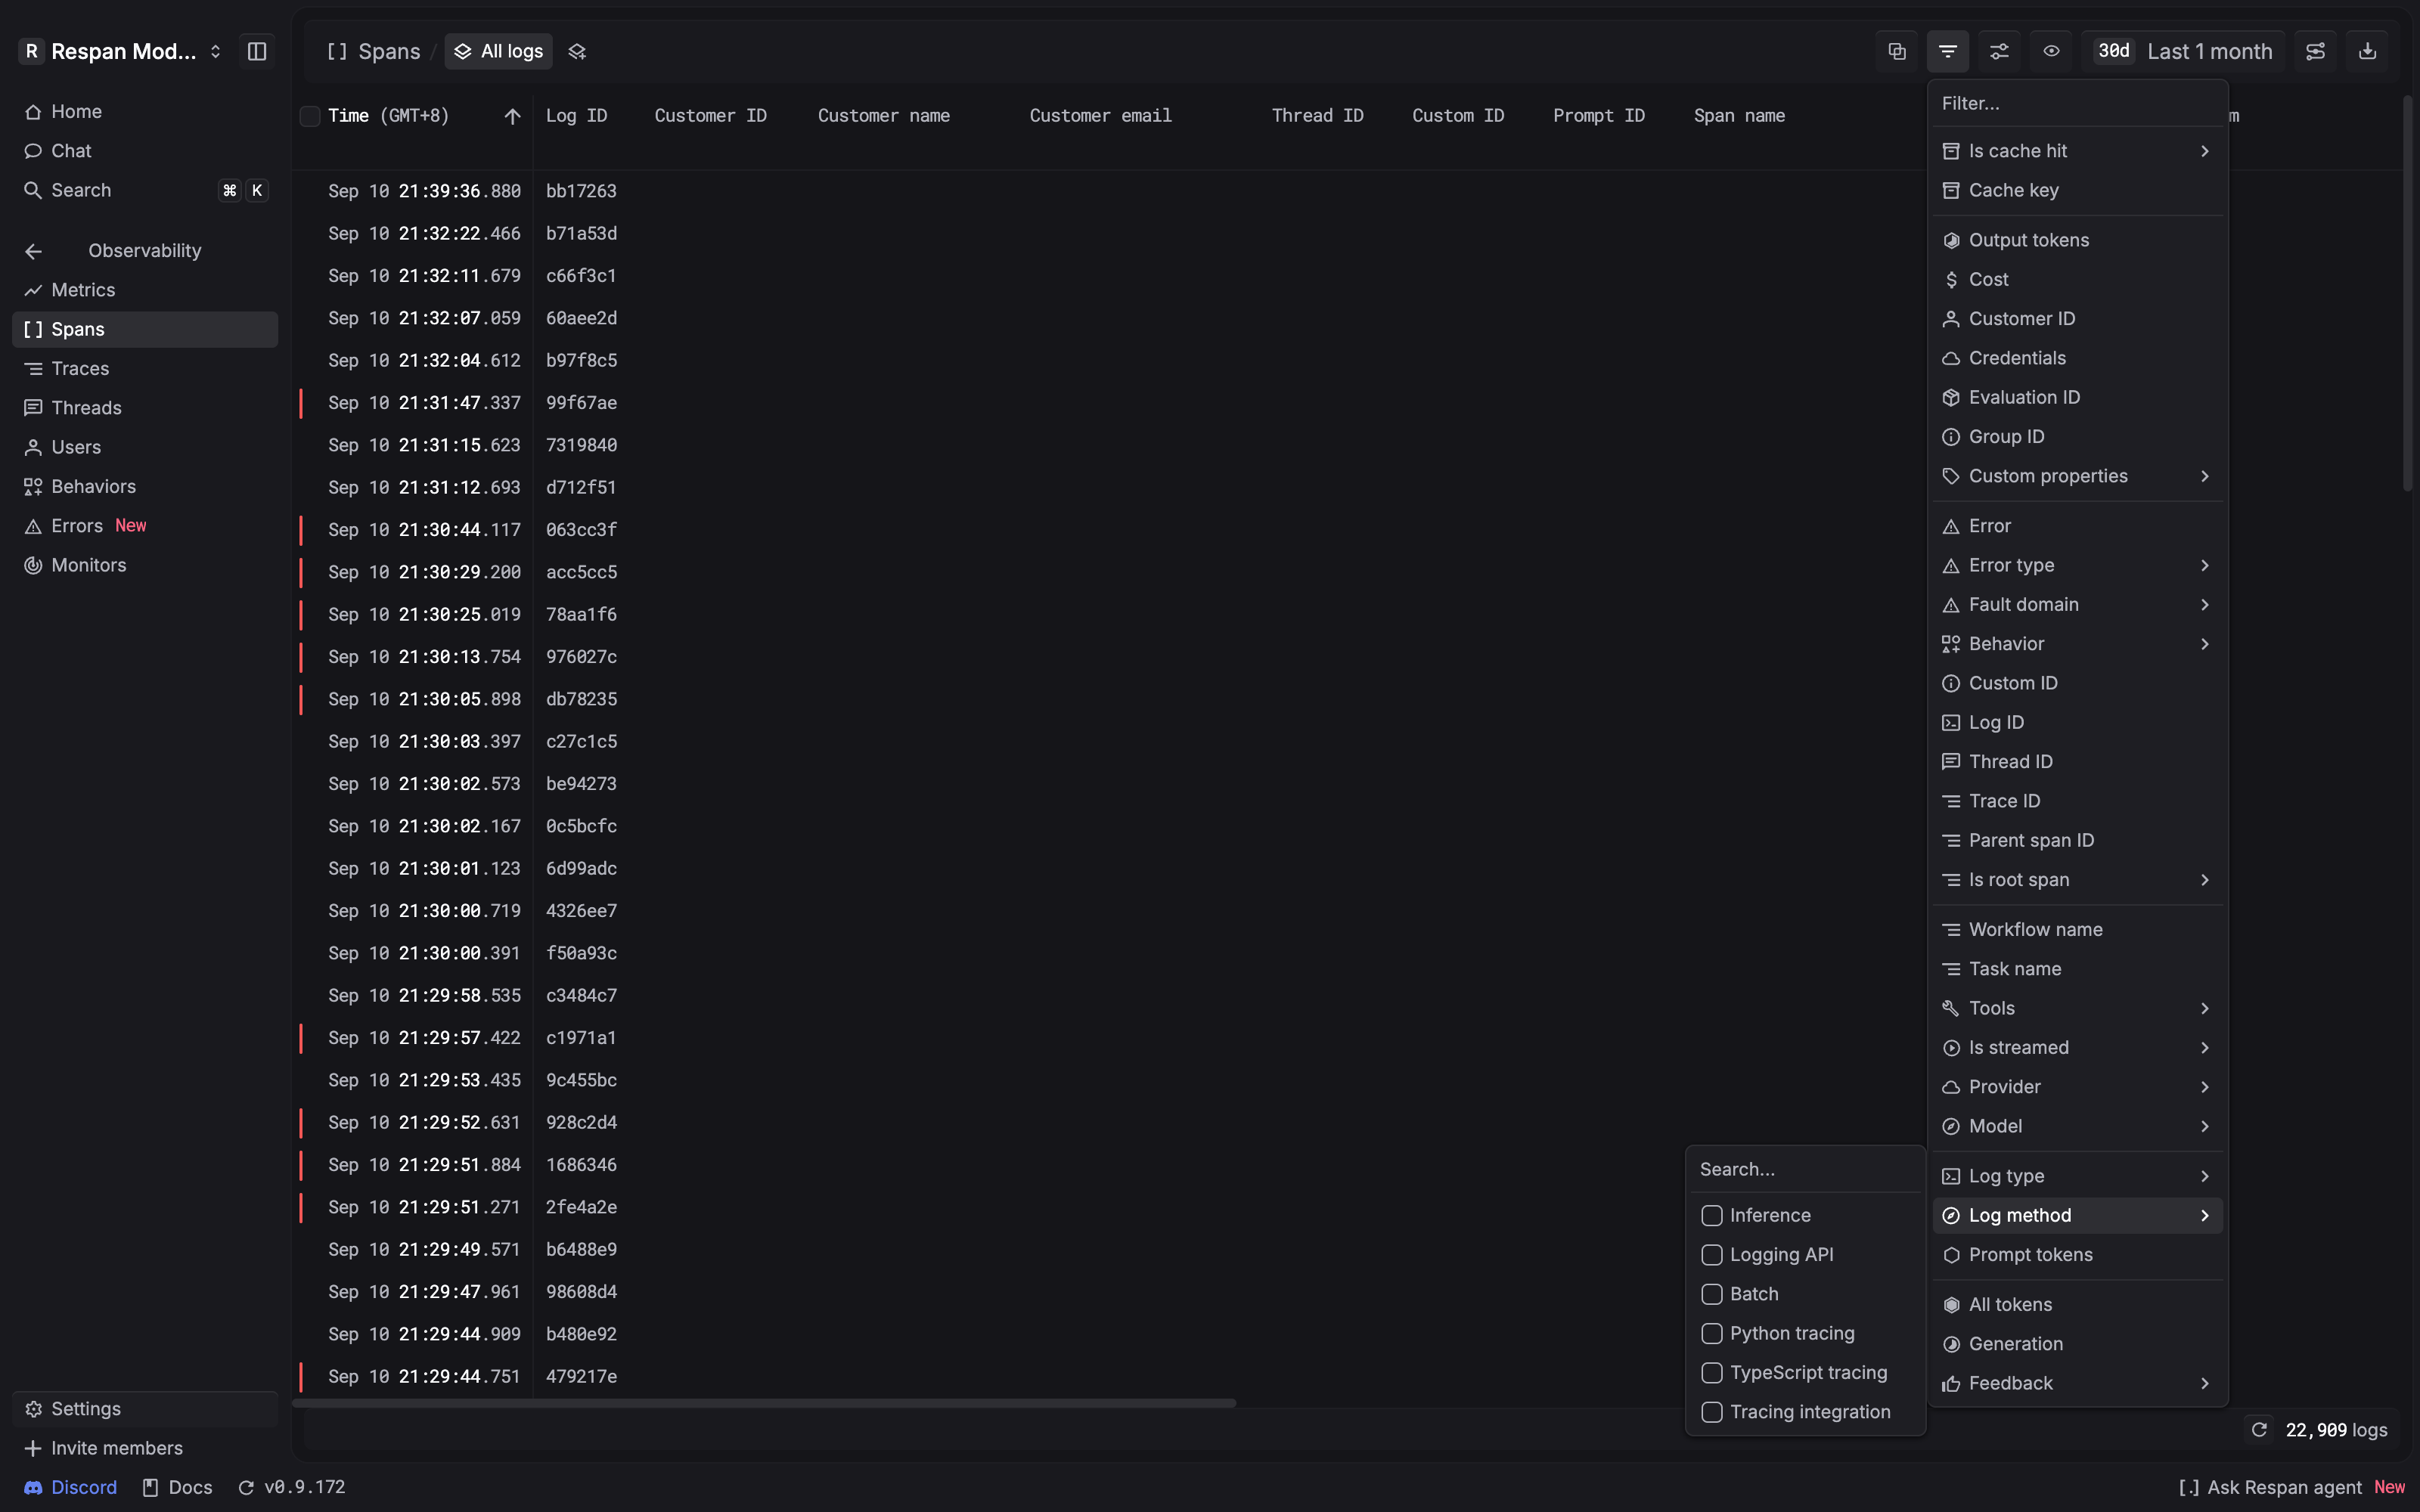
The value controls depend on the field:
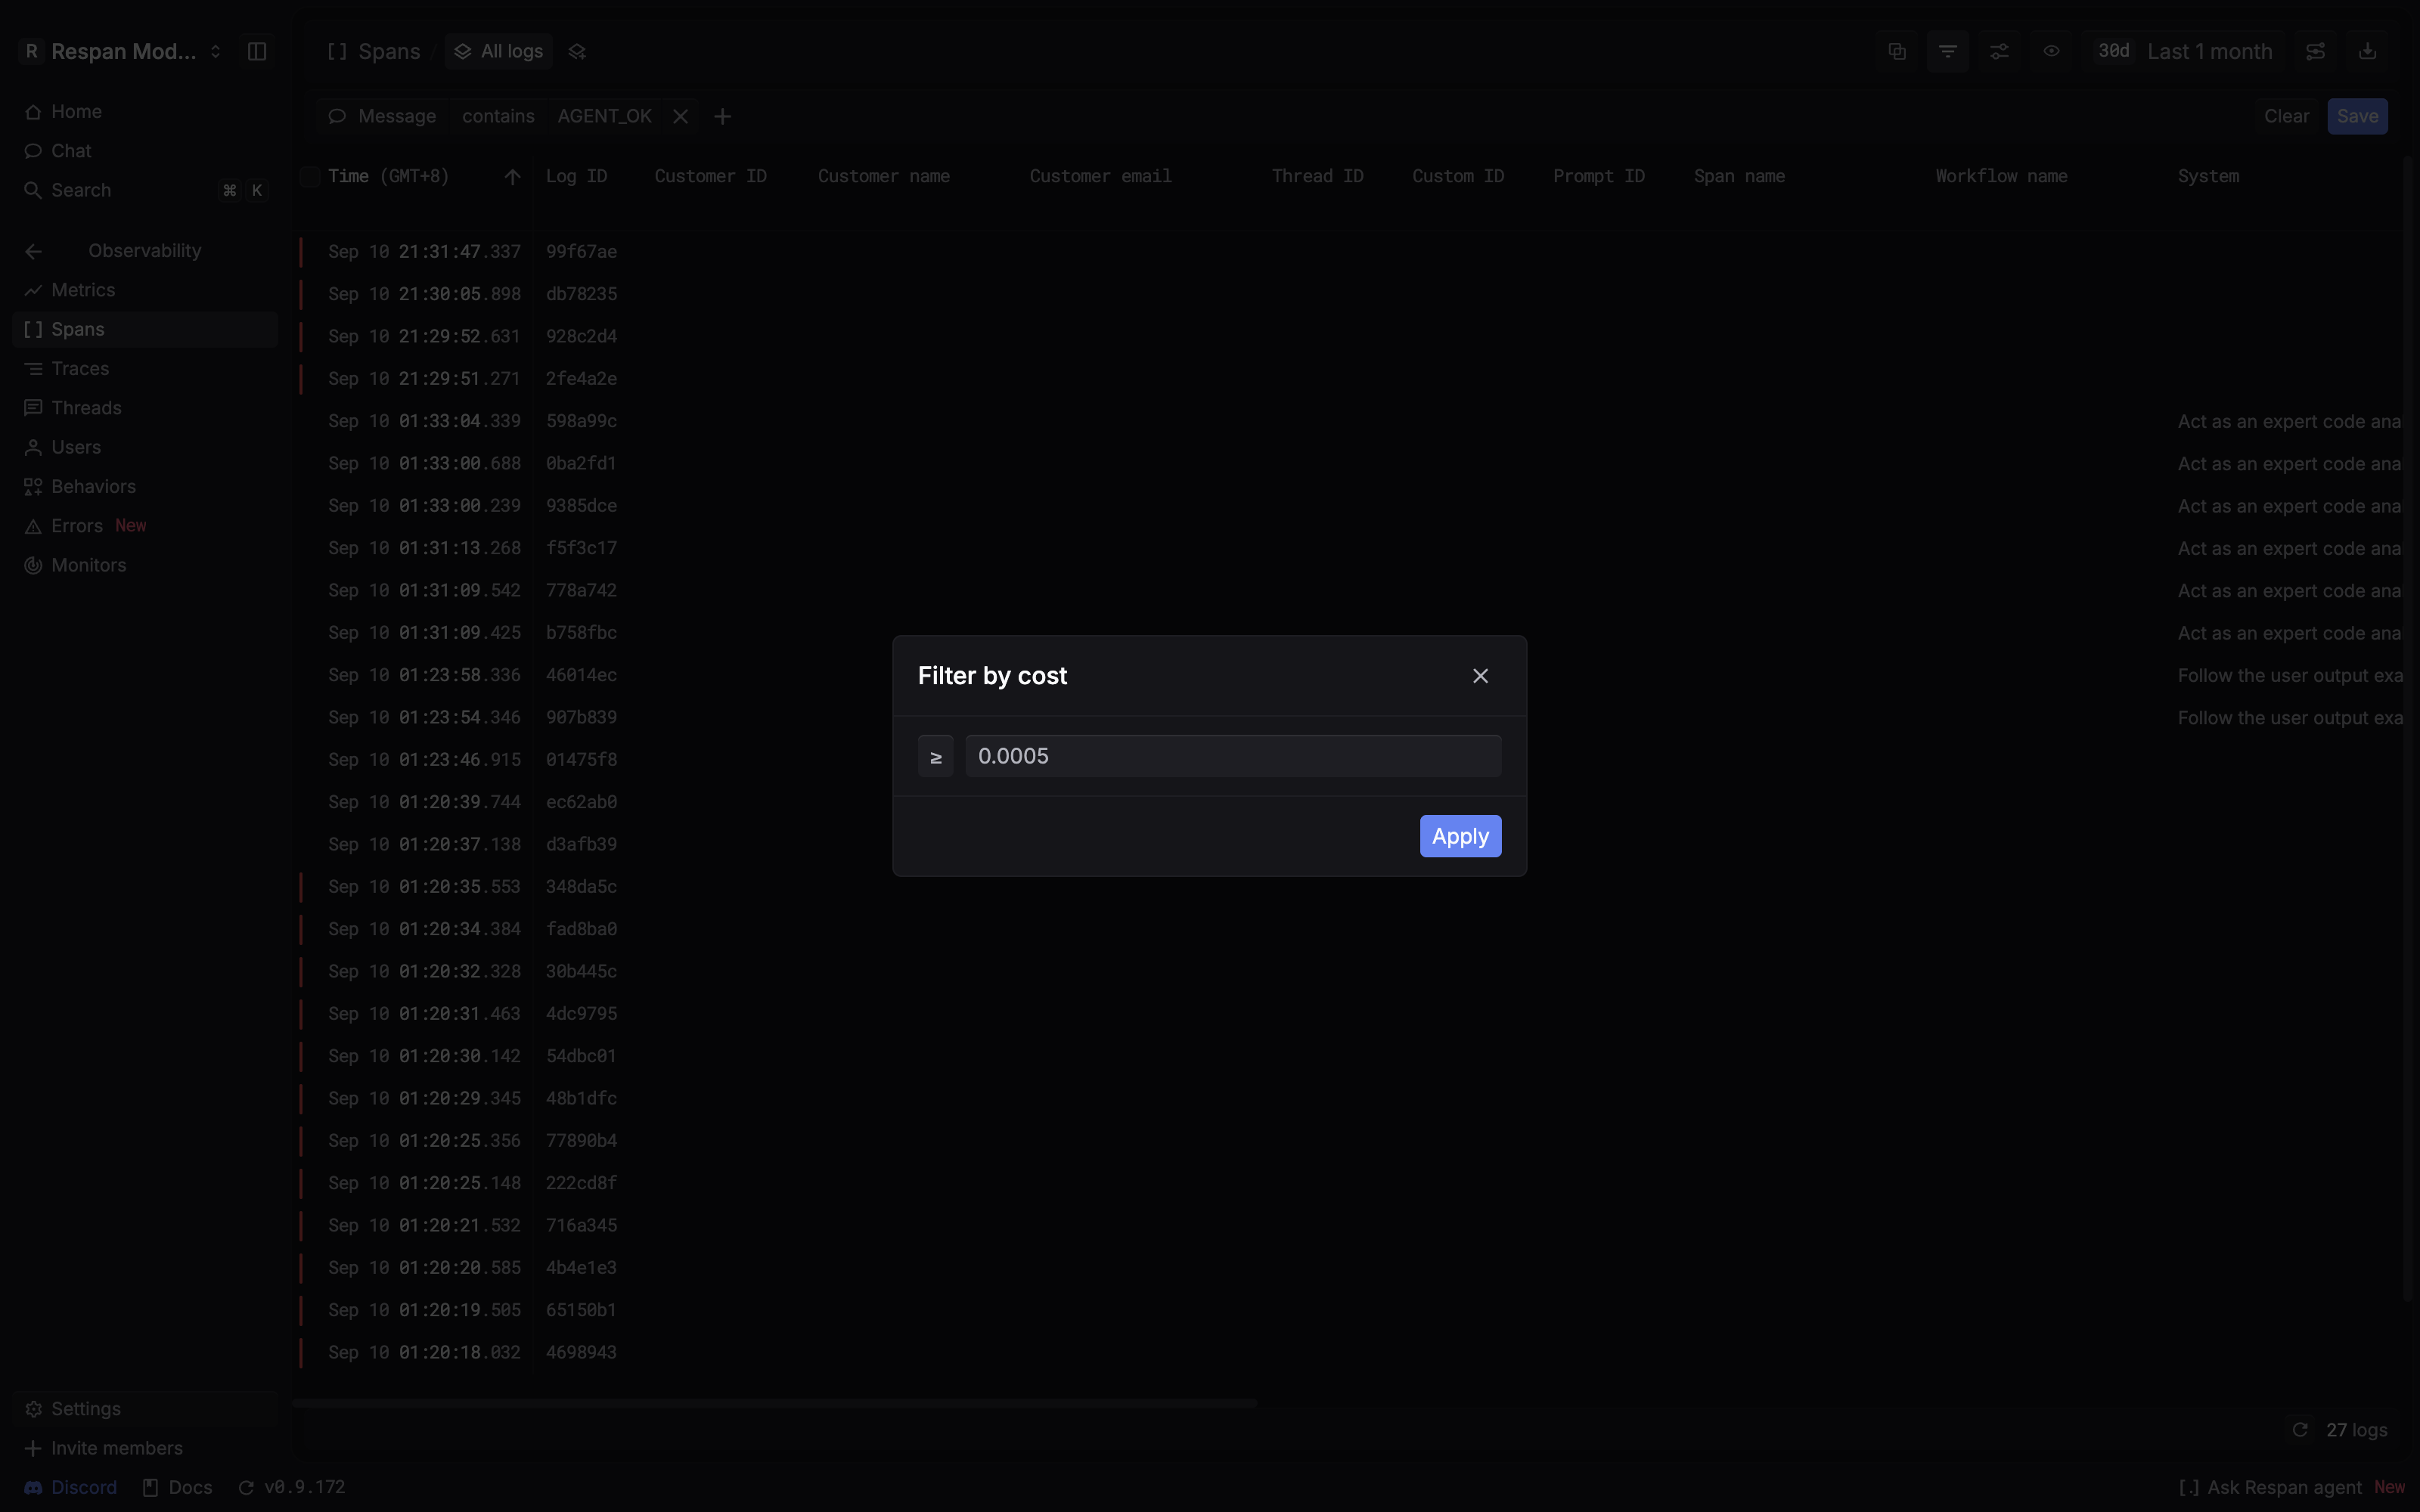
Use a condition’s × control to remove it, or Clear to remove all filters. The project and time range still limit the results.
Available filter fields
Table columns and filter fields differ. Latency and Span name are columns; they are not fields in this filter menu. Provider is a filter, while Provider cache is a separate table column.
Combine filters with Add filter group
Conditions outside a group use AND: a span must match all of them. A new filter group uses OR, so a span can match any condition inside it. Click the group’s OR control to switch it to AND when every condition in the group must match.
This example finds spans containing AGENT_OK that either failed or cost at
least 0.0005. The screenshots use a test request; replace AGENT_OK with text
from your own spans.
- Choose Filter → Message, enter
AGENT_OK, and click Apply. - Open Filter again and choose Add filter group.
- In the group, choose Status → Error.
- Click Filter inside that group and choose Cost. Select ≥, enter
0.0005, and click Apply. - Keep OR selected inside the group.
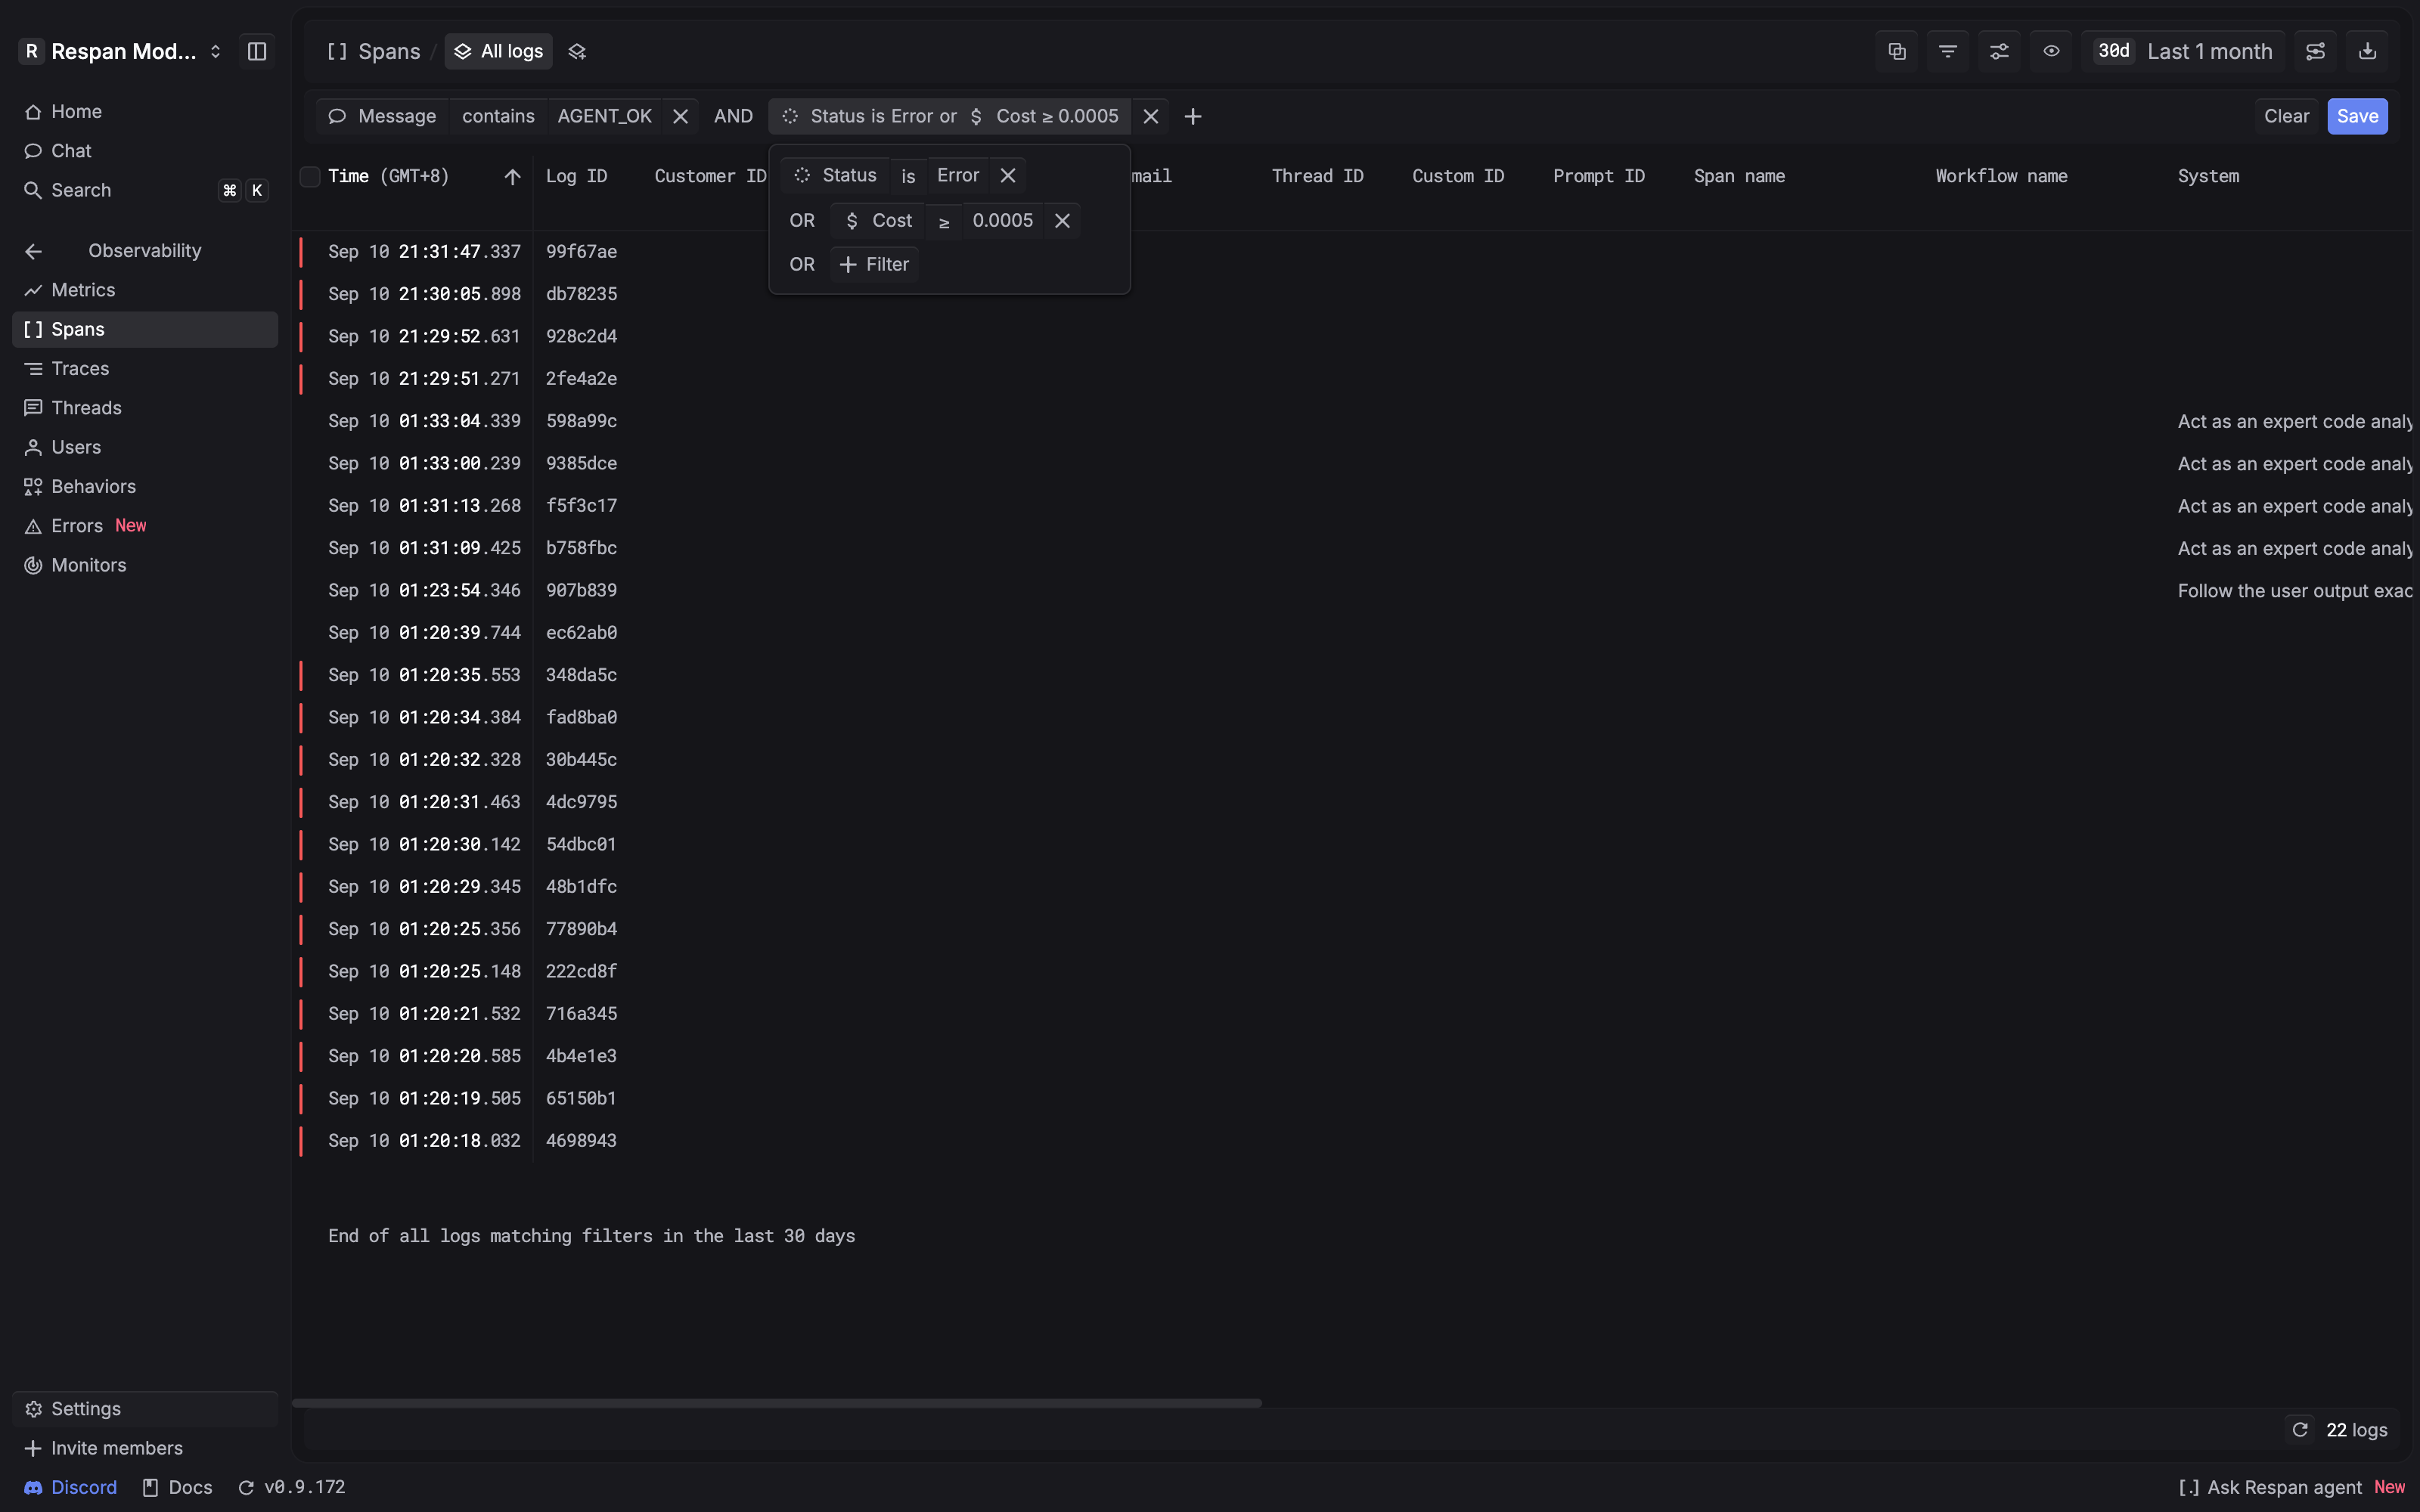
The complete filter is:
Failed spans can match even when their cost is below the threshold. Successful
spans can match when their cost meets it. Both still need AGENT_OK in their
recorded message content.
Switch the group to AND to require both Error status and Cost ≥ 0.0005,
as well as the Message condition:
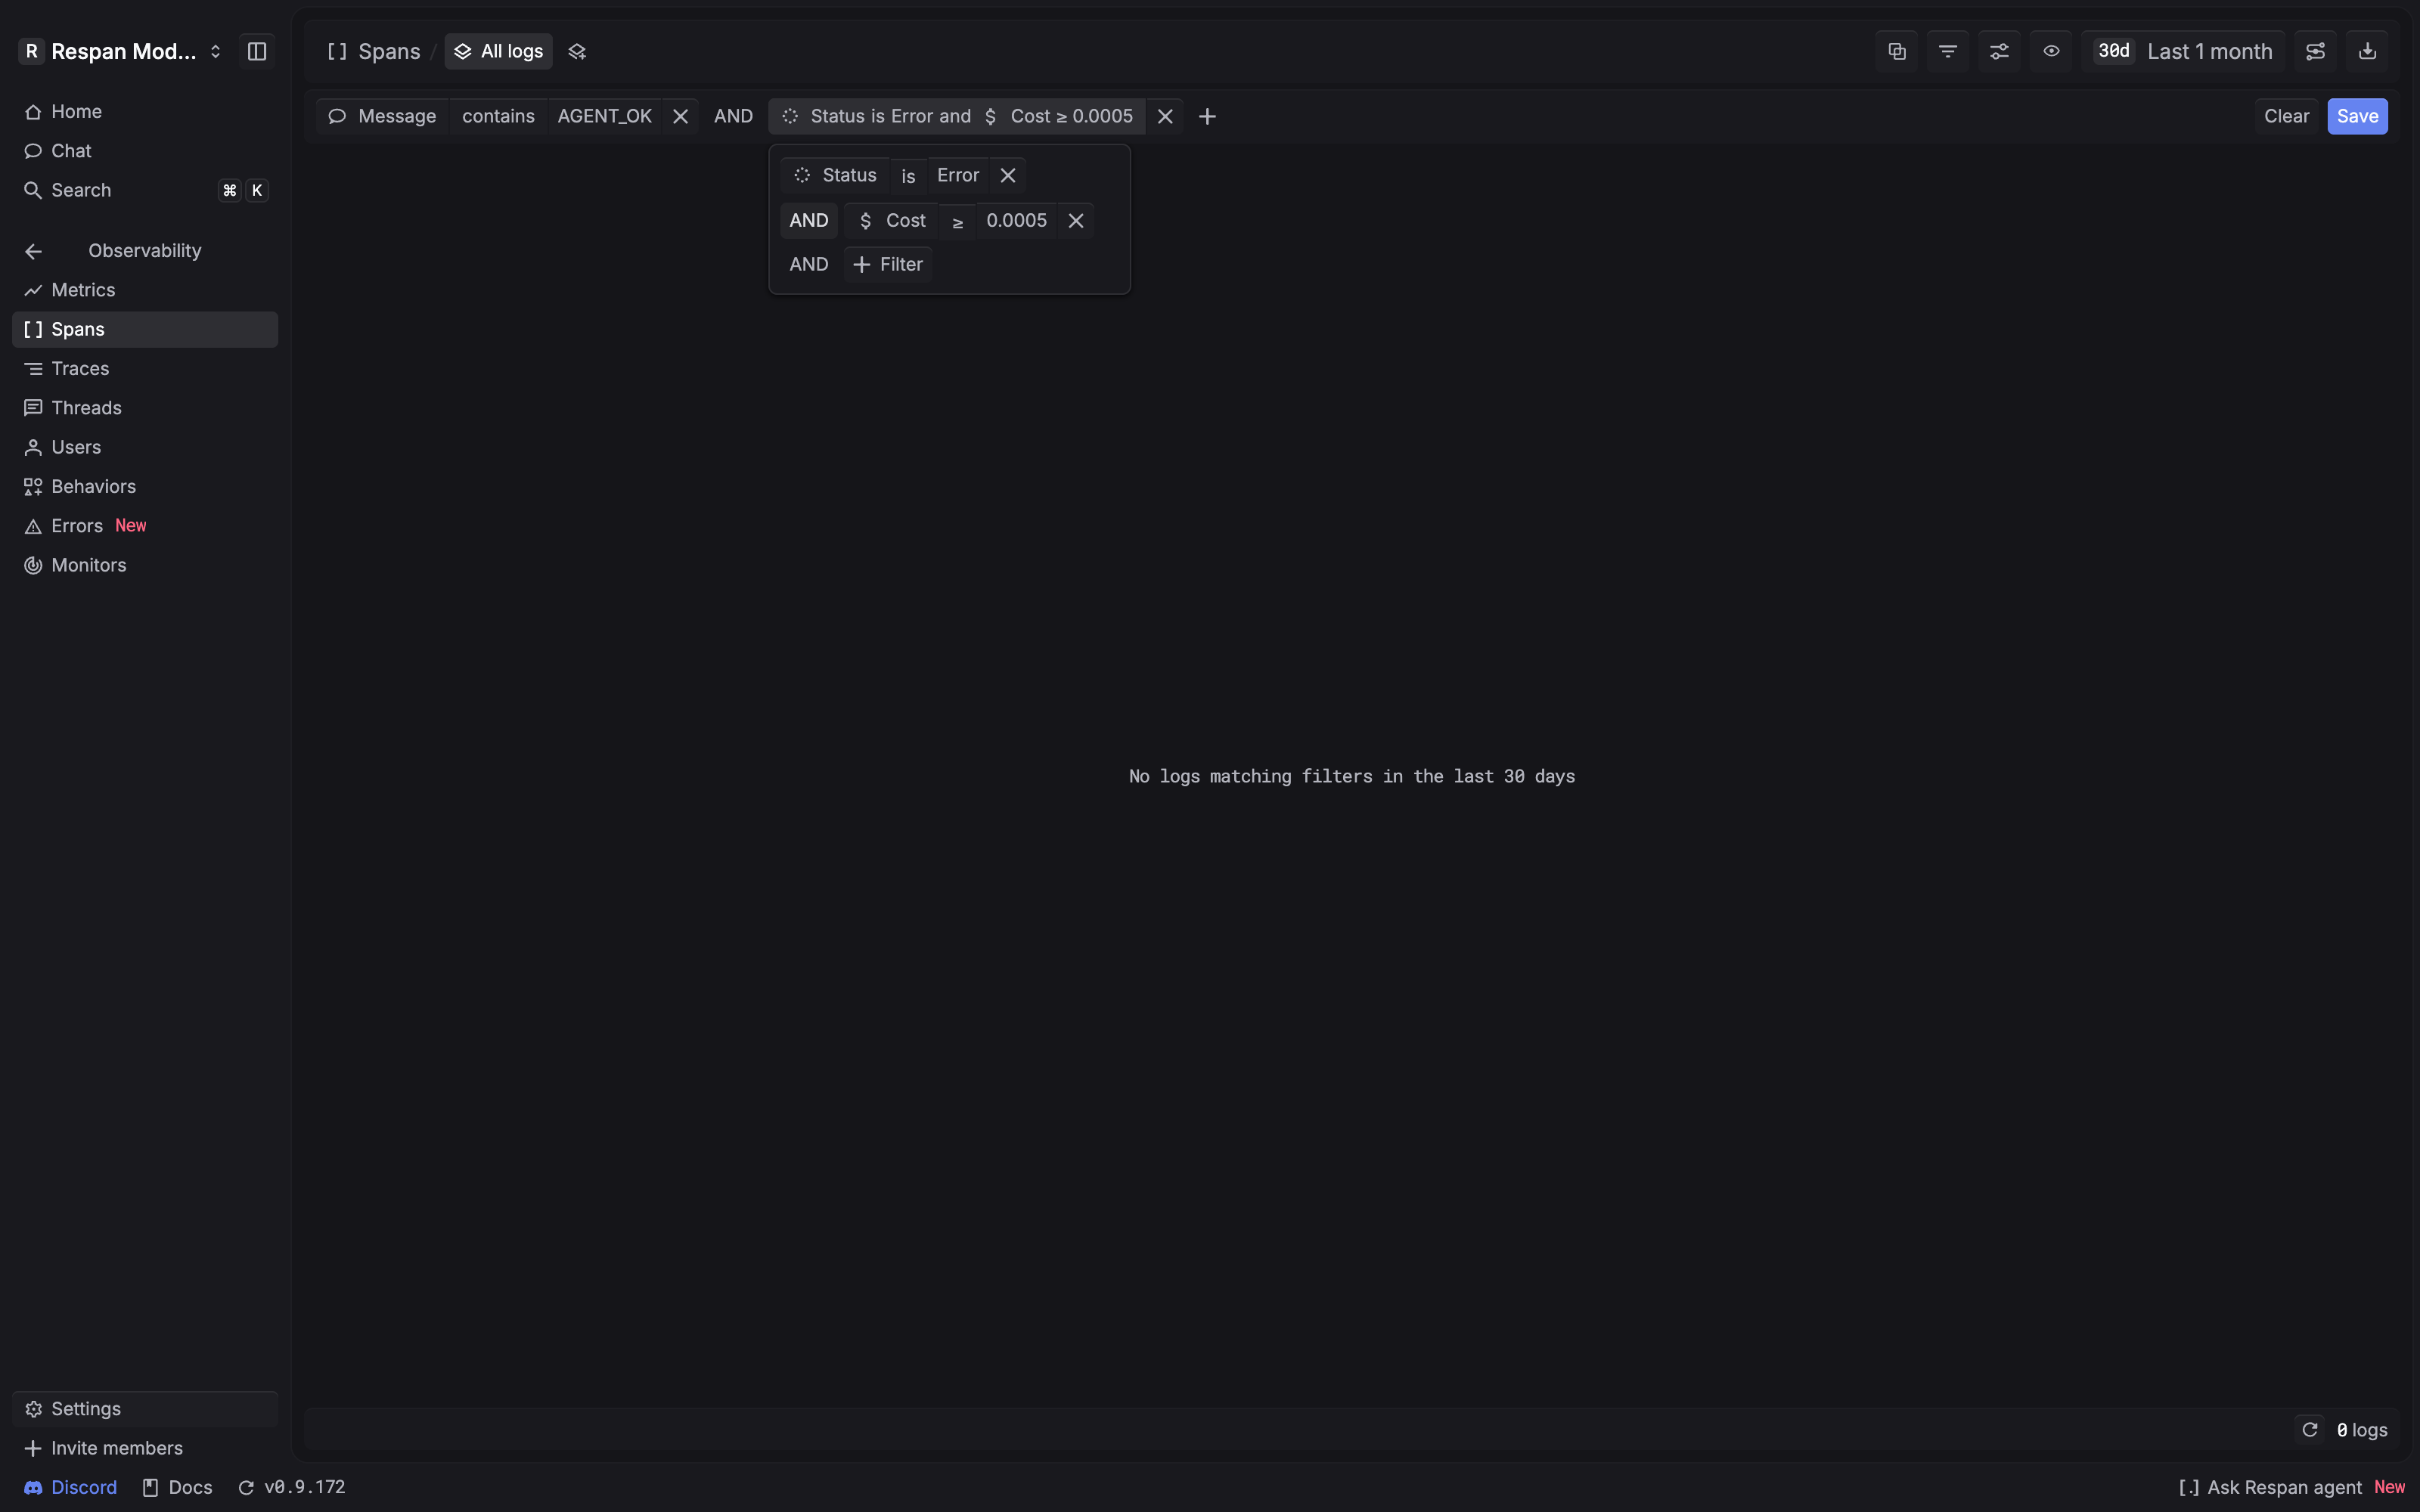
Use × beside a condition to remove just that condition. The × beside the group removes the whole group.
Filter by custom properties
Choose Filter → Custom properties, select a property key, and enter its value with is or is not. Click Apply to add the condition.
For example, if your spans record environment: production, select
environment and set it to is production. Available keys depend on what
your application records. Check a span’s Metadata tab to see its properties.
Inspect a span
Select a row to open its detail panel. The header identifies the span and its timestamp, status, request type, and model where available.
The populated tabs and fields depend on the span type and what your application recorded.
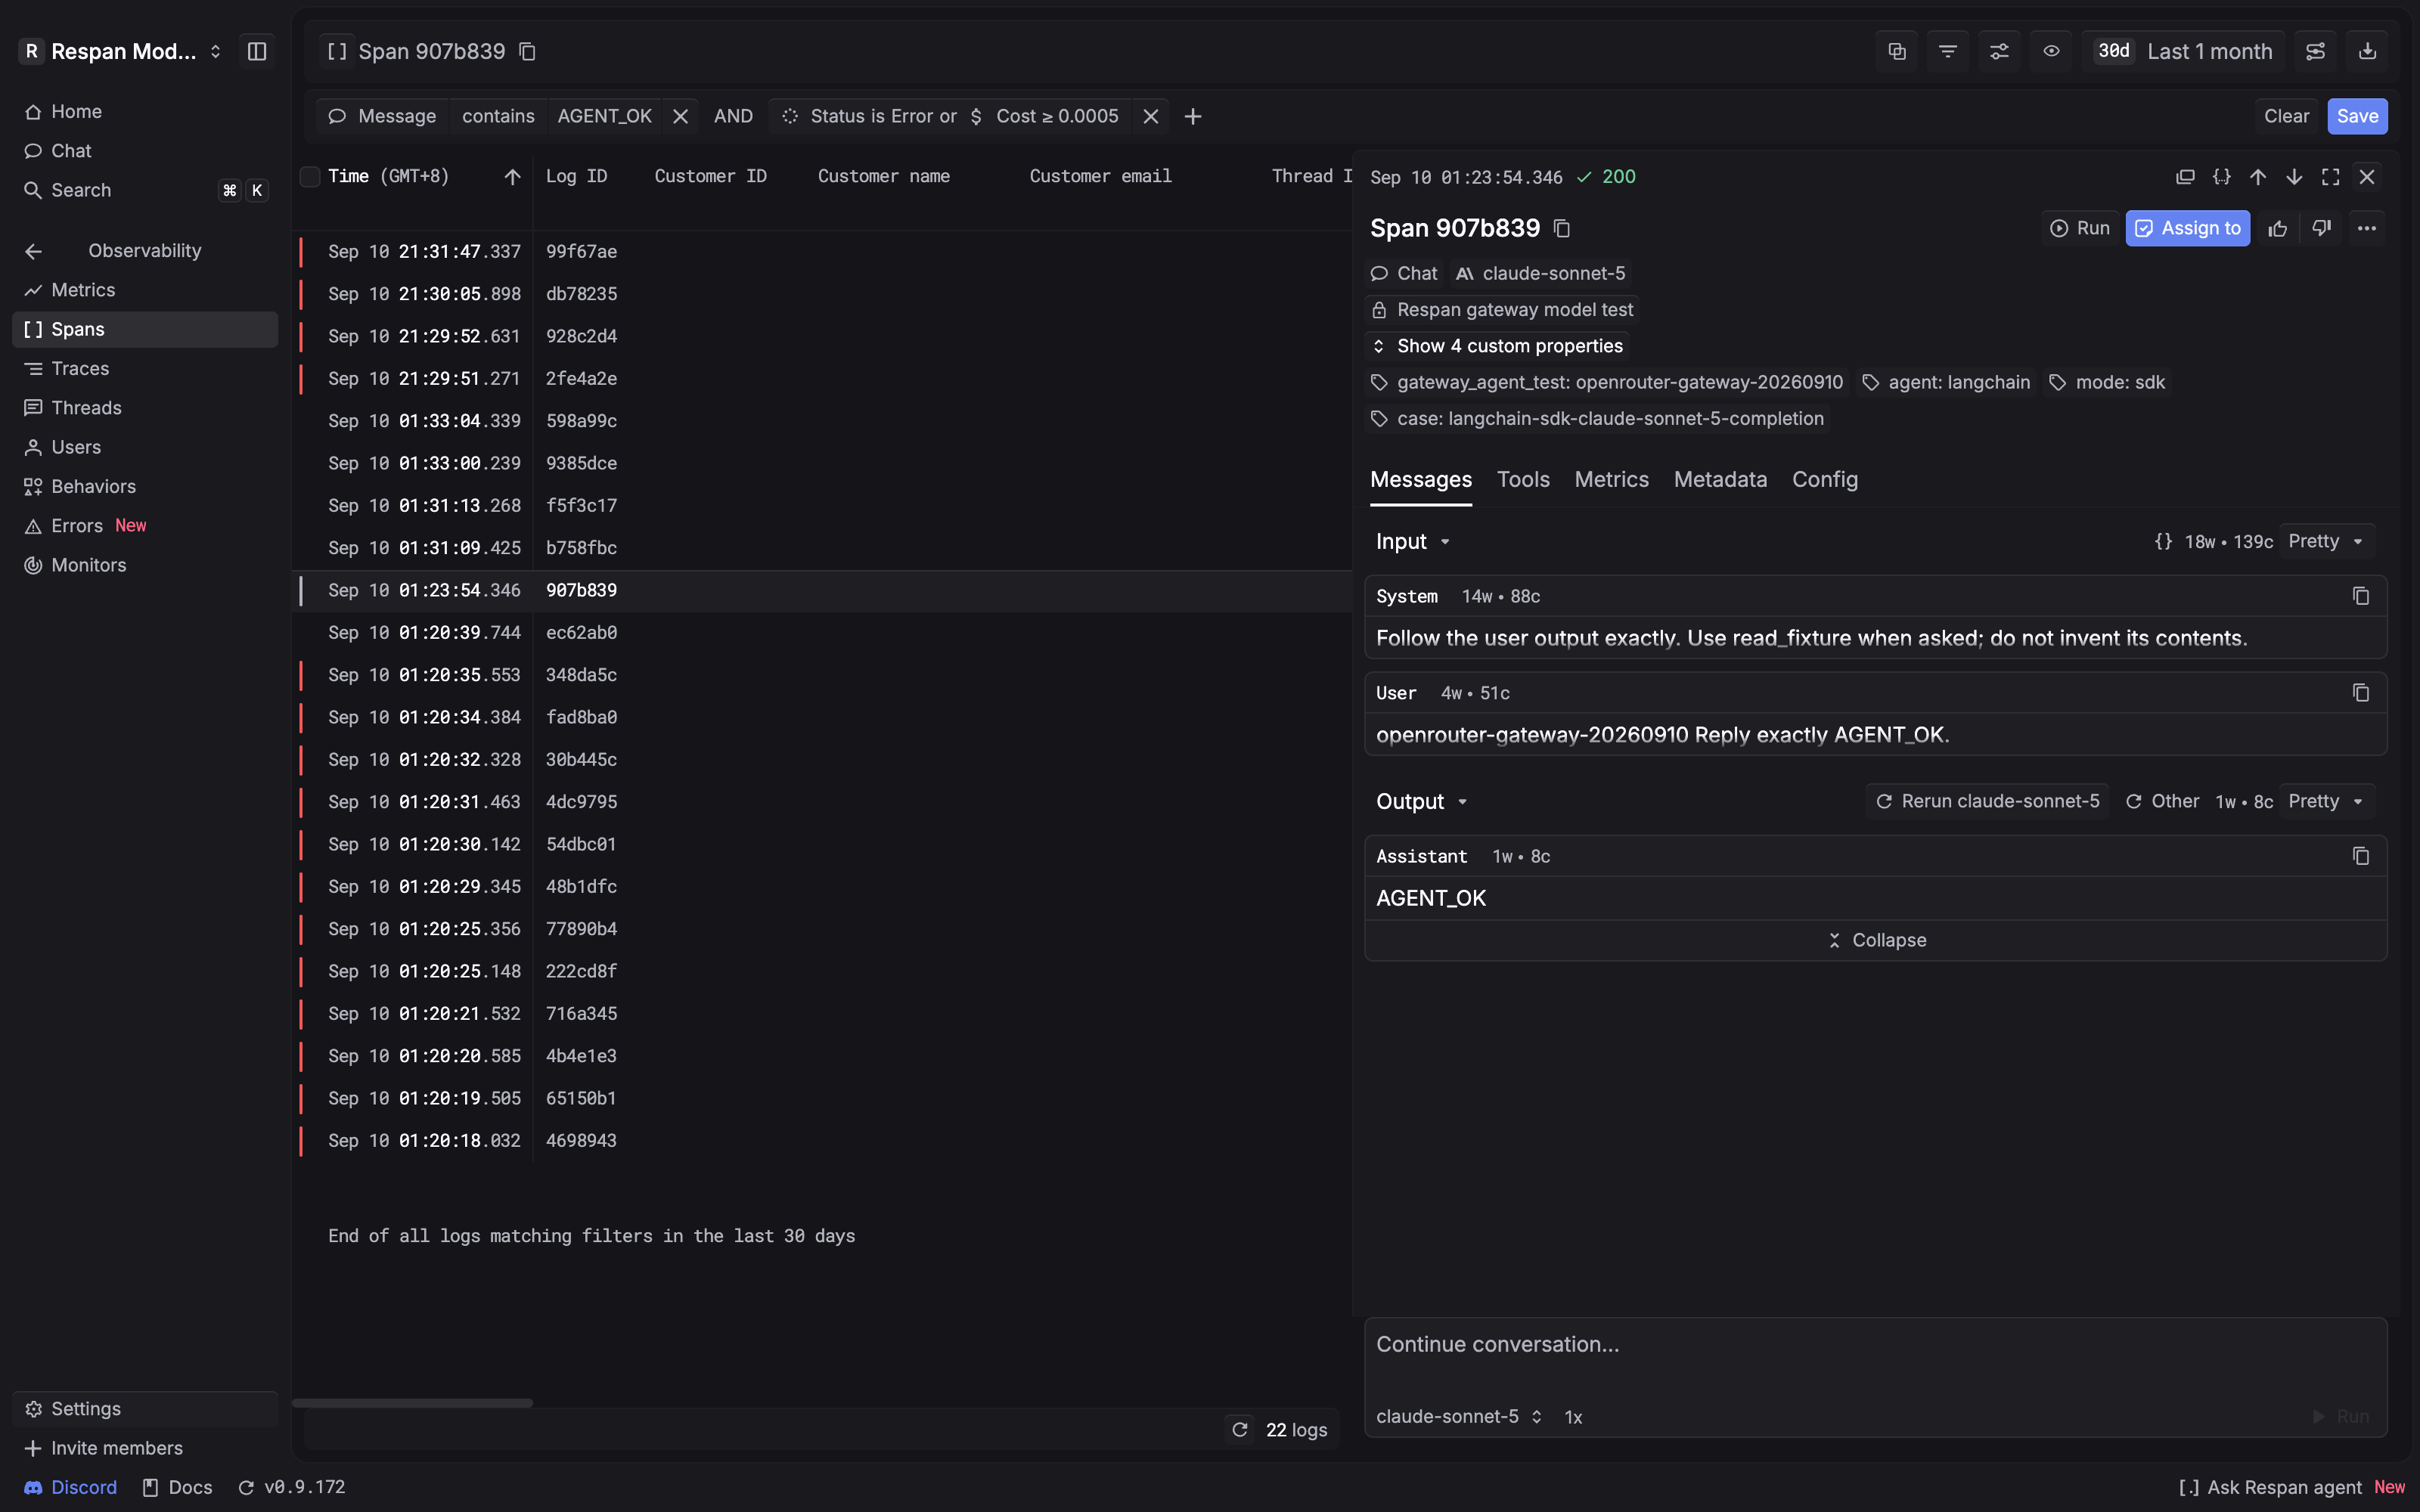
Use the message-format selector to choose Pretty, Markdown, JSON, or YAML. This changes the display format without changing the stored span.
Work with spans
The detail header includes Run, Assign to, and positive or negative feedback controls. Open the overflow menu for Show nearby requests and Save as Prompt.
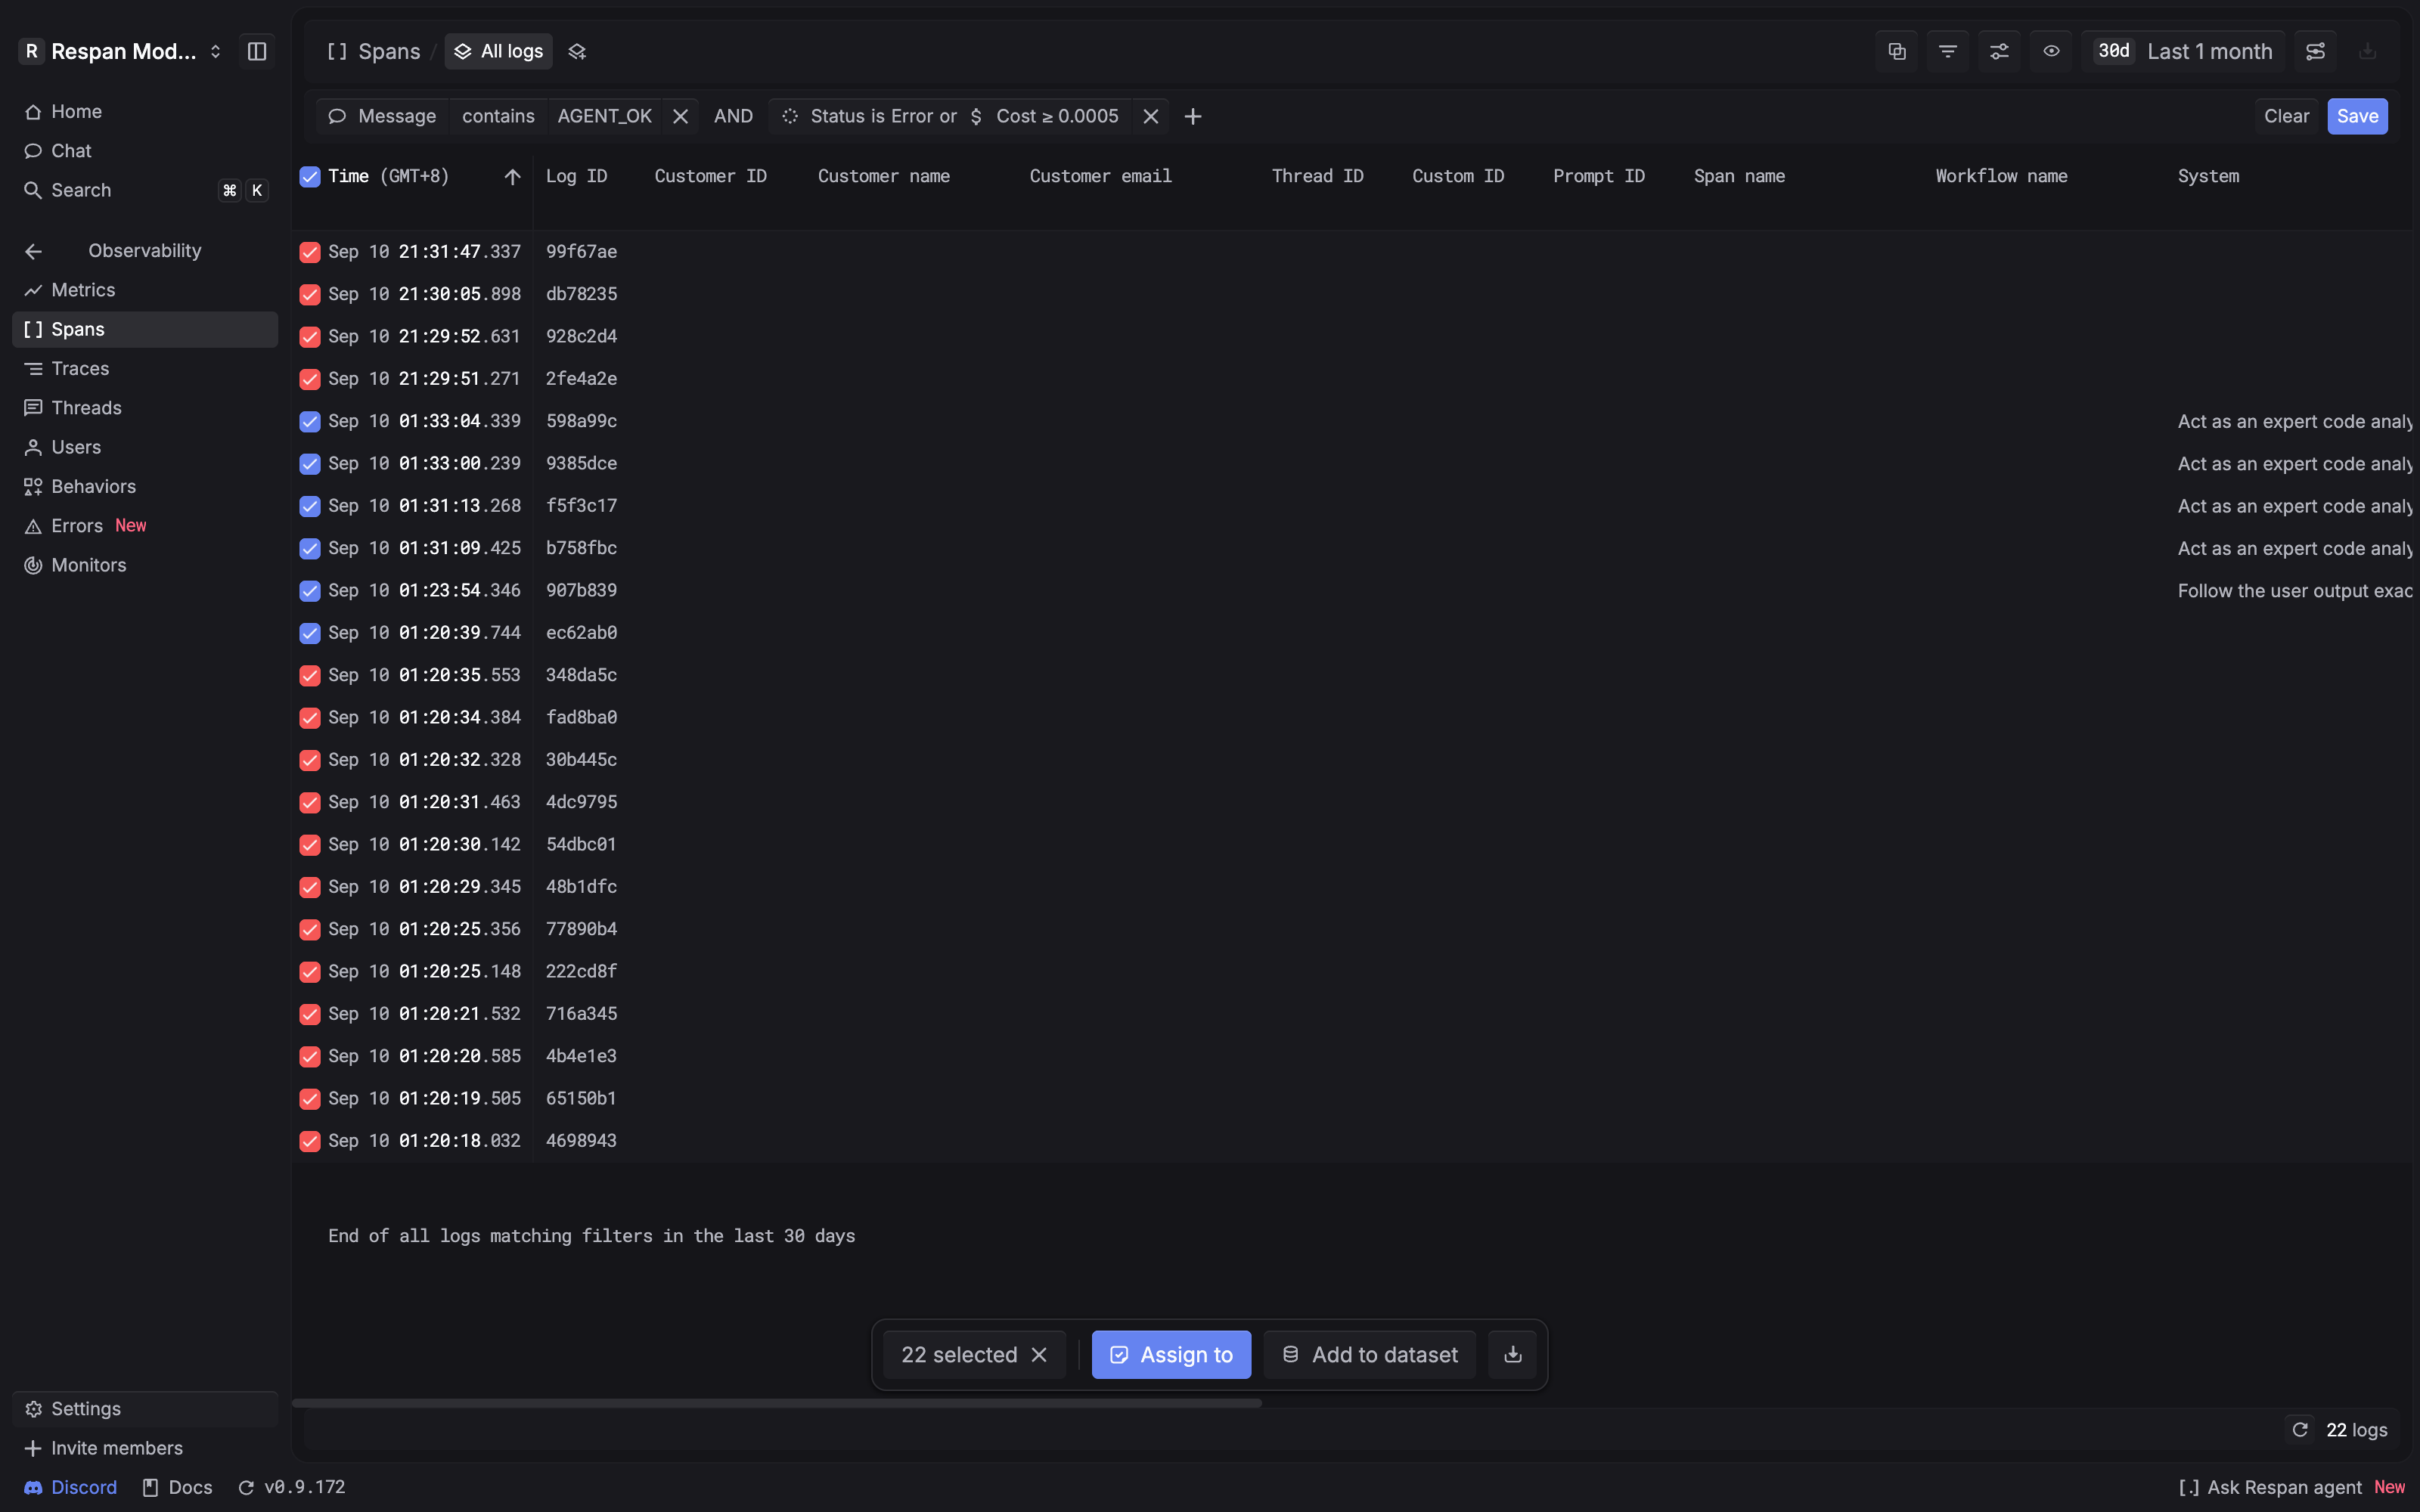
To work with several spans, select their table checkboxes. The selection bar offers Assign to, Add to dataset, and a download control.
Troubleshooting
No spans match
Check the project and time range. Click Clear, then add conditions back one at a time. For a filter group, check whether AND requires conditions that the spans do not satisfy together.
Input or output is missing
Some span types do not contain messages. Check Metadata and Config for other recorded details, then confirm whether your application recorded content for that operation.