

View and debug traces
Use the Traces page when an error, latency spike, unexpected cost, or user report points to a specific application run. A trace connects the complete run to every model call, tool invocation, task, and workflow step that happened inside it.
This guide follows one investigation from the trace list to the span that needs attention.
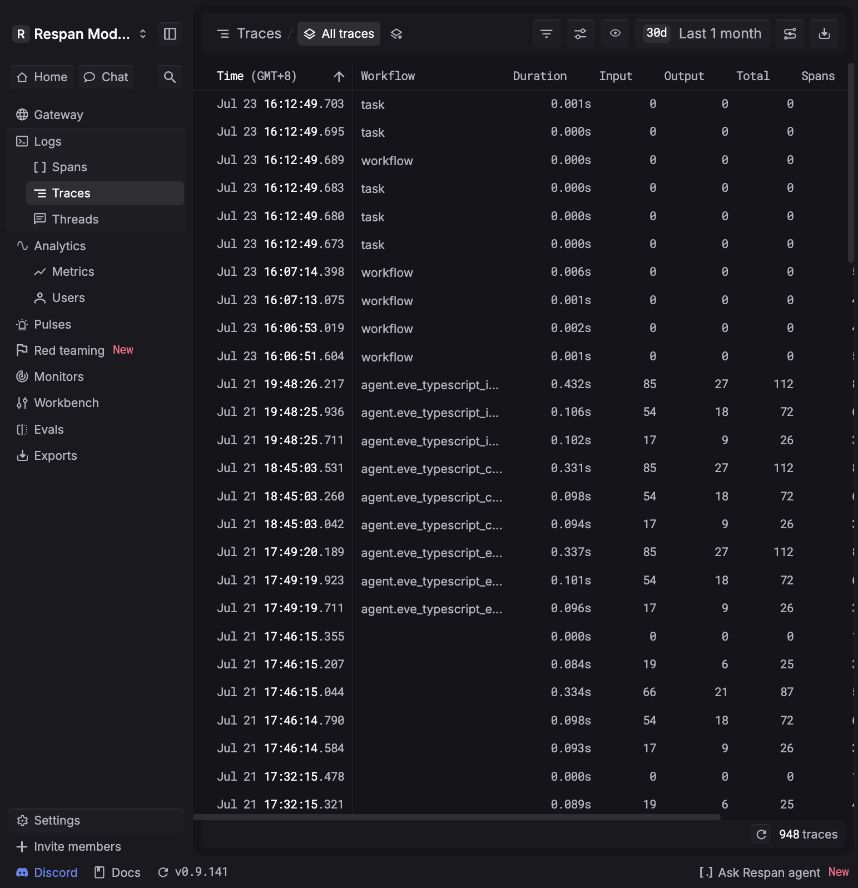
Choose the right level
Respan groups telemetry at three levels:
For details about the hierarchy, see Tracing core concepts.
Investigate a run
Open Traces and set the time range
In the platform sidebar, go to Logs → Traces, or open the Traces page.
Set the time range in the upper-right corner to cover the incident. The Time column includes the timezone used to display each timestamp.
If the table is empty, widen the time range before changing your filters. This quickly separates “no data in this window” from “a filter excluded the data.”
Narrow the table to candidate traces
Select Filter, then choose the field that describes the symptom. The filter builder includes identifiers such as Trace ID, Thread ID, and Customer ID; operational fields such as Workflow name, Errors, Duration, Status, and token counts; and dimensions such as Provider, Model, and Custom properties.
Use Add filter group when the investigation needs another group of conditions. Check the resulting rows before saving the filter setup.
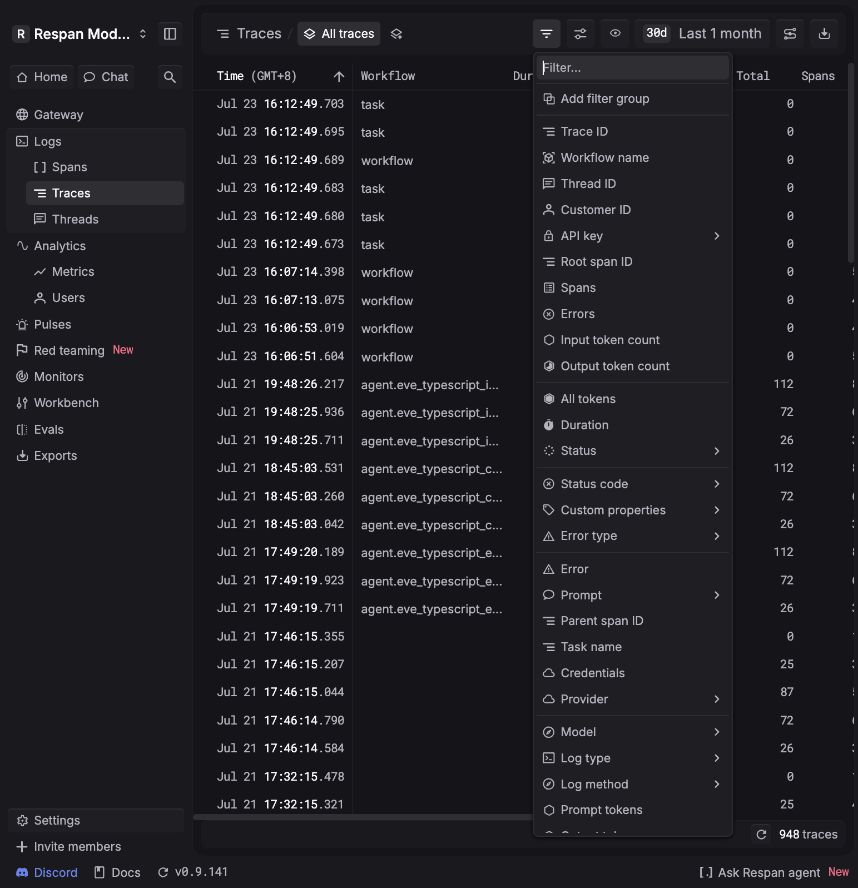
A trace can contain many spans. A trace-level total, such as total duration, tokens, span count, cost, or errors, describes the complete run. Open the trace before deciding which individual span caused that total.
Show the columns that help answer the question
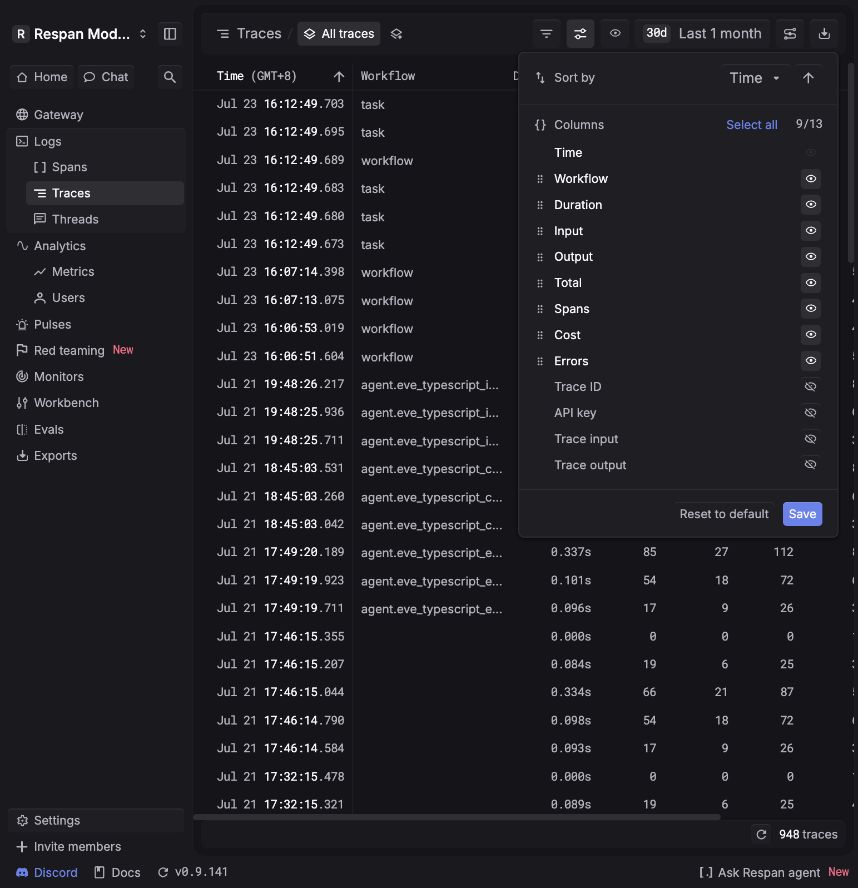
Open the table settings control to choose the sort field and direction, and to show or hide columns. A useful default investigation layout is:
- Time and Workflow for context
- Duration for slow runs
- Input, Output, and Total for token usage
- Spans for unexpectedly long agent paths
- Cost and Errors for impact
Show Trace ID when you need to correlate a row with application logs. Hide identifiers and API-key columns before sharing a screenshot.
Record the investigation context
After confirming that the filters return the intended traces, record the project, time range, timezone, filter fields, operators, and values in the incident or engineering issue. Include the sorted column and direction when the first or last matching run matters.
This gives another investigator enough information to rebuild the same result without relying on an unsupported saved-filter state.
Open a trace and read its execution
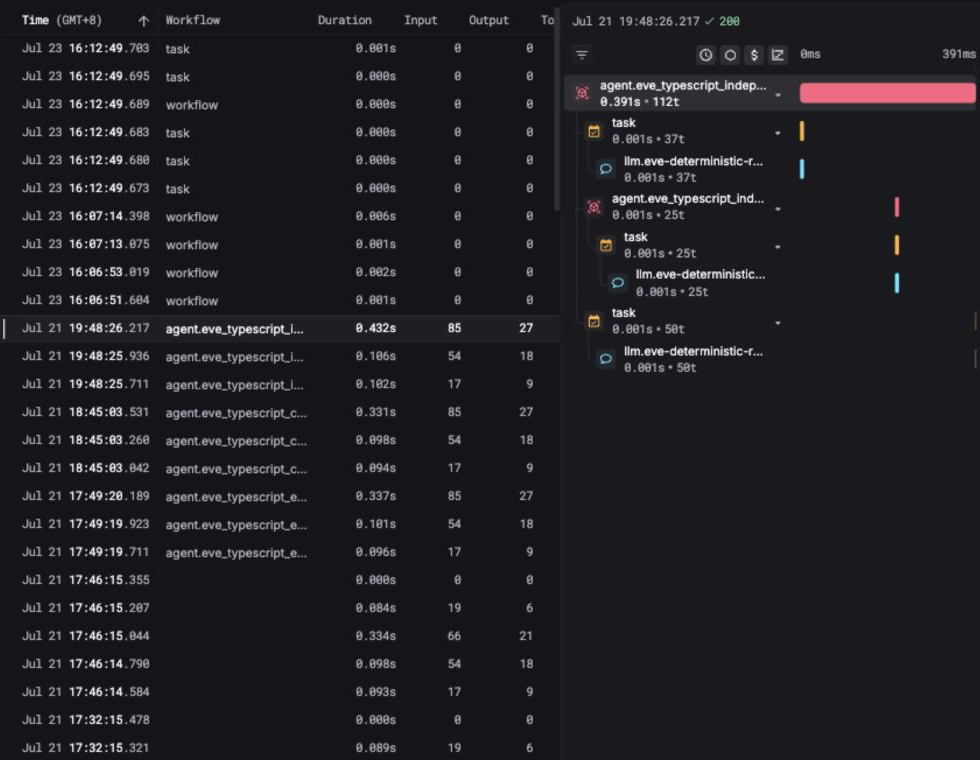
Select a row to open the trace workspace. Keep these regions connected while you investigate:
- The selected trace in the results table.
- The nested span hierarchy, which shows parent-child execution order.
- The duration timeline, which shows when each span ran and how long it took.
Indented spans are children of the span above them. Expand a branch to inspect its work, then compare its duration bar with neighboring spans. The longest bar is the best place to begin a latency investigation, but it is not automatically the root cause of an error.
Focus the hierarchy on relevant span types
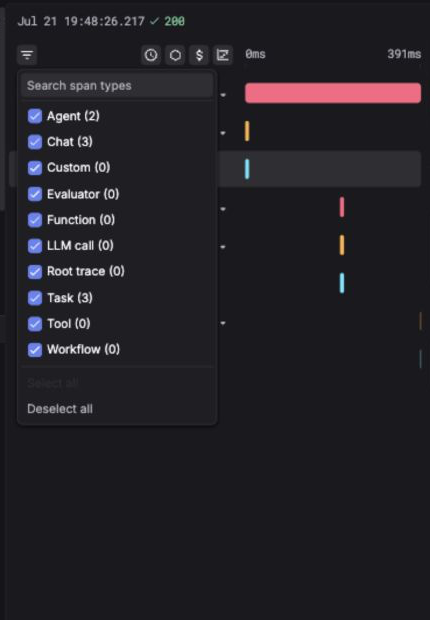
Open the span-type filter in the trace workspace. Search for a type or select only the types relevant to the investigation, including Agent, Chat, Evaluator, Function, LLM call, Root trace, Task, Tool, and Workflow.
Examples:
- Show Tool and Task spans to debug a failed tool path.
- Show LLM call and Chat spans to inspect prompt and response behavior.
- Show Agent and Workflow spans to understand orchestration and handoffs.
Filtering changes what is visible in the hierarchy; it does not change the stored trace.
Inspect the suspicious span
Select a span in the hierarchy, then use:
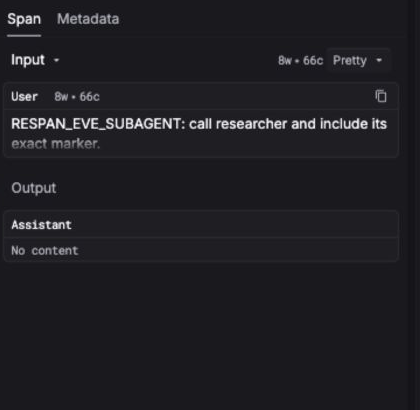
- Span to read the exact input and output captured for that operation.
- Metadata to inspect its identifiers, model and provider context, and attached custom properties.
- The content-format selector to switch among the representations available for that span.
For a model call, compare the actual input with what the application intended to send. For a tool call, compare the tool arguments with its returned value. Then move one level up the hierarchy and verify how the parent used that output.
Confirm the cause before changing the application
Work from the earliest span that contains incorrect data, not merely the last span that displays the failure.
Once the evidence supports a cause, copy the trace identifier into the engineering issue and record the time range, applied filters, failing span, and expected behavior. This gives another investigator enough context to reproduce the finding.
Follow a session with Threads
Use Logs → Threads when the investigation spans more than one trace, such as a multi-turn conversation or long-running customer workflow. A thread is a time-ordered group of spans that share one thread identifier; the group can include spans from one or more traces.
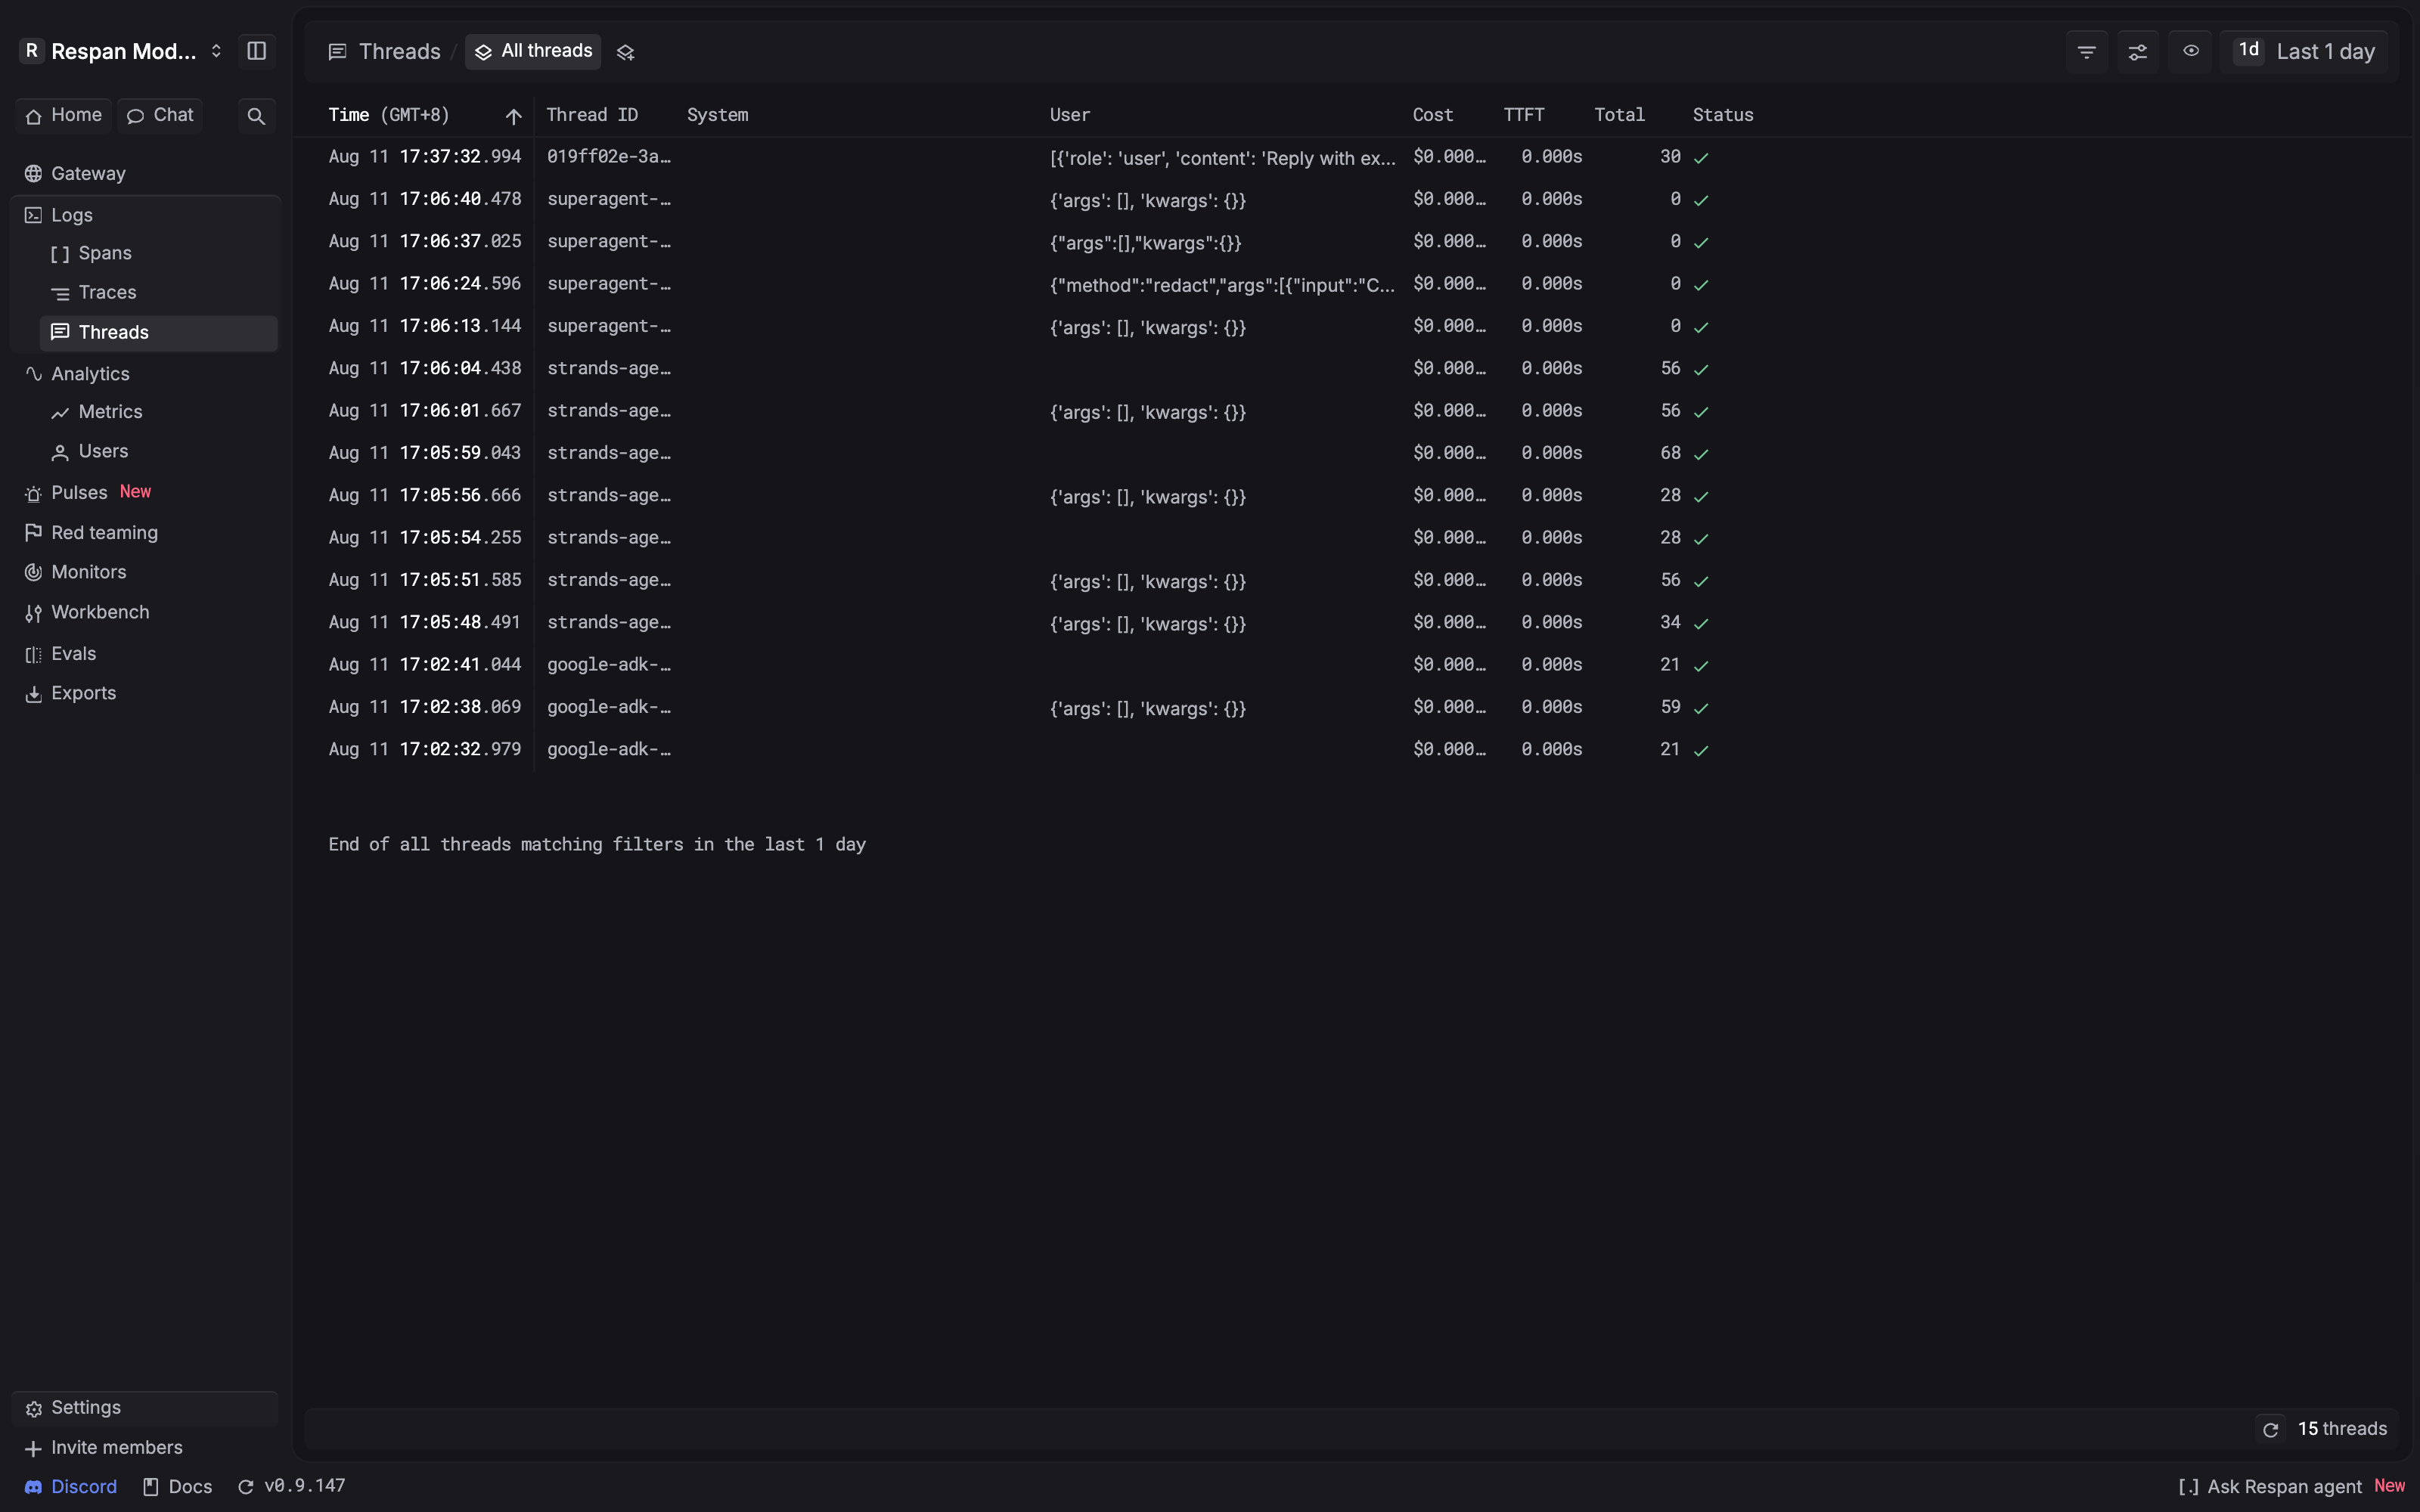
Open Threads and find the session
Open the Threads page, choose a time range, then filter or sort the table to find the session. Useful columns include Thread ID, System, User, Cost, TTFT, Total, and Status. Start with a wider range when a recent window is empty.
Filter to the reported session
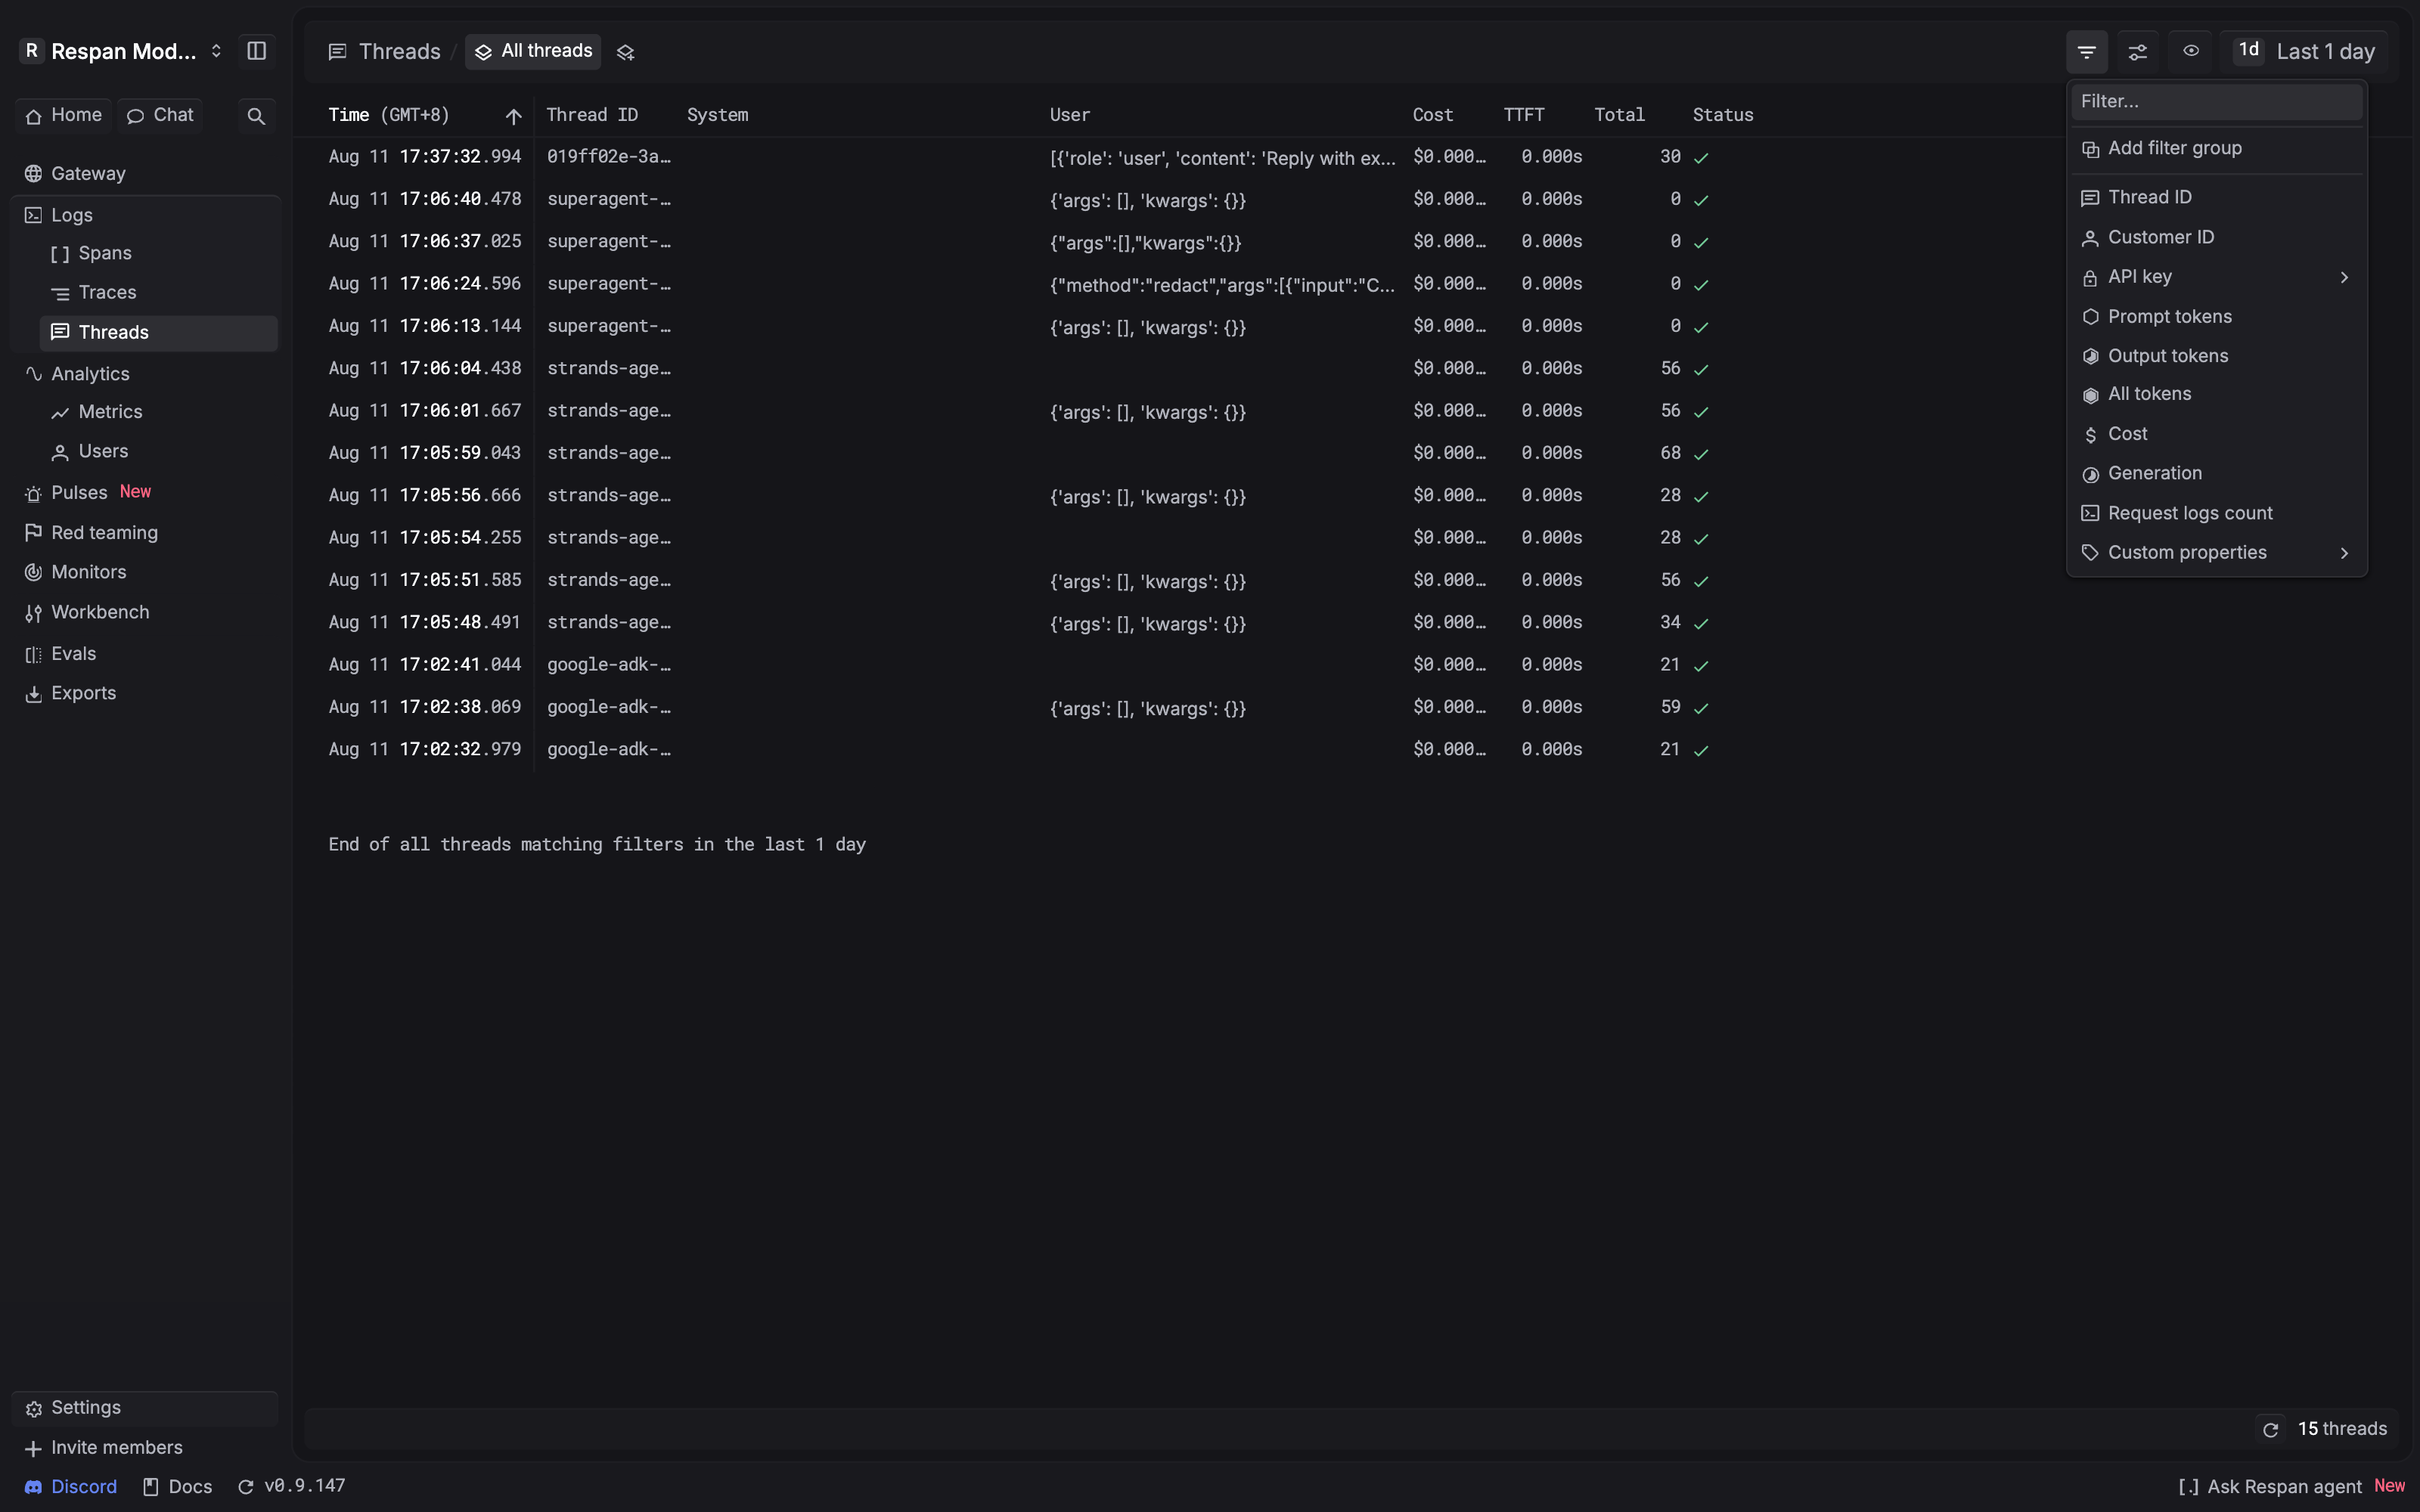
Open Filter and choose the field that best identifies the session. The Threads filter menu includes Thread ID, Customer ID, API key, prompt and output token fields, Cost, Generation, Request logs count, and Custom properties. Combine the identifier with the incident time when a value can occur in more than one session.
Return to the traces in that thread
Copy the Thread ID, open Logs → Traces, and filter by that value. Order the traces by time, then open the run where the behavior changed and continue through its span hierarchy.
This preserves the distinction between the levels: the thread supplies session context, the trace explains one run, and the span shows one operation.
Troubleshooting trace data
No traces appear
Confirm the project and time range, temporarily clear filters, and send a test request. If the request is not traced, complete the Tracing quickstart.
A run appears as separate flat traces
Individual model calls can appear separately when the application does not
create or propagate a parent workflow span. Add a framework instrumentor or
group the operations with
@workflow and @task.
Input or output is missing
Check whether content logging was disabled, whether the selected span recorded messages, or whether the record is outside your retention window. See Retention and export.
The trace is difficult to find again
Attach stable fields such as a customer, thread, workflow, and environment as trace metadata, then filter on them. See Metadata and tags.
Continue from one trace
One trace explains one run. Use the next workflow that matches your goal:
Inspect one recorded operation and its messages, metrics, metadata, or configuration.
Record stable thread, customer, workflow, and environment fields for future filtering.
Check whether the error, latency, or cost issue affects more traffic.
Create a monitor for the production signal you confirmed.
Run an evaluator against sampled production spans.
Review the searchable window or create an export job.